Dividend Payout Ratio – (Top 10 Stocks With Highest Payout In 2017)
")
What is Dividend Pay Out Ratio
For dividend stock investors, the dividend payout ratio is a core measurement. Using this method to primarily determine whether an investment will be made. The dividend payout ratio is a metric to calculate the total amount of dividends paid to shareholders relative to the total earnings for the same time frame. Essentially, it is the percentage of earnings paid to shareholders as dividends on a per share basis. The portion of earnings not issued to shareholders is referred to as retained earnings. This is used to pay off debts and pursue investments.
How do you calculate Dividend Payout Ratio?
The dividend payout ratio can be calculated by dividing the annual dividend per share by the earnings per share. This ratio simply displays how much of the company’s earnings the shareholders are receiving, and how much the company is keeping. From a shareholder’s point of view, the annual dividend payout lets them know how much cash they will receive for every share they own. The ratio signifies how much of corporate earnings each shareholder can expect to collect.
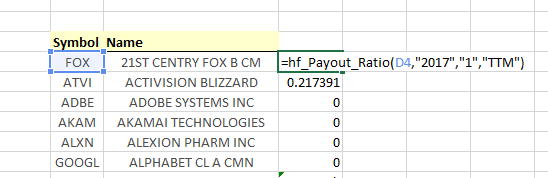
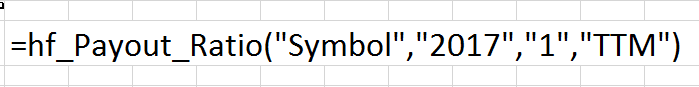
You can use MarketXLS formula as shown below…MarketXLS inbuilt calculator will get the value.
In general, more established the company the more will be its regular dividends
Not all dividend payout ratios are alike. Depending on the objectives of the business, the percentage of earnings issued as dividends will vary. Companies who are focused on growth and rapid expansion will maintain a great share of its earnings for reinvestment or acquisitions that will help advance its goals. Therefore, their payout ratios will be very low or even zero. However, long established corporations are more inclined to shell out higher dividend payments to shareholders. This results in a higher payout ratio.
Once companies begin to issue dividends, and even generous dividends, the moment those payments are reduced, investors view it as a negative result. If dividends reduce, the belief is that earnings have reduced, meaning the company is notably less profitable. Shareholders are not super supportive of investing in businesses that experience downturns of their financials.
Also, the perception from the outside drives away any potential investors in the near future. Shareholders cherish the dividends they receive and do not take it lightly to be invested in a business that does not have consistent dividend growth. The moment dividends are cut you can almost guarantee the stock price will drop. Even if a company has experienced a down year in sales and earnings, maintaining a consistent dividend payout ratio will help soften the blow from pessimistic investors.
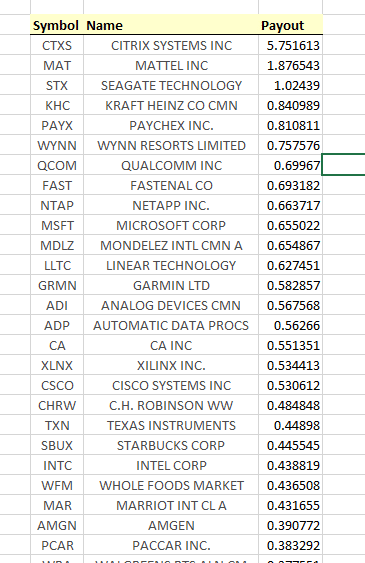
With marketXLS you can get historical dividends of all US stocks and sort them out by the pay out ratio. So, as you can see below we could easily find out top dividend stocks in NASDAQ. As on Q2 2017, Citrix seems to be one of stock with highest dividend payout.
Depending on the industry, the dividend payout ratio will vary from marginal to high. Technology companies resist issuing sizable dividends, to allow continuous opportunities to create new innovations and reach new markets. At least 90% of Real estate investment trusts earnings(REIT) are obligated to disburse earnings in order to benefit from special tax exemptions. Well established consumer staples have a good history of issuing generous dividends with steady growth over many years.
How to use dividend payout to identify growth in a company?
A positive growth trend in dividend payouts typically points to a healthy business and happy shareholders. Good dividend paying stocks do not have to be a high ratio to be considered. As long as the dividends do not spike or tumble, then shareholders will view it as a consistent stock to own. Dependable dividend payouts keep investors around as some may be reliant on the payments as income for reasons of retirement, or supplemental earnings.
Analysts view particular payout ratios as poor, good, healthy, high, or unsustainable. These ratio categories may be subjective to the analyst. However, the overall premise of different levels is to detail the quality of the dividend shares being issued, as this is meaningful. This creates the ability for interested investors to research specific stocks by filtering those with high or low payout ratios.
The level of payout is typically synonymous with the orientation of the business. For growth directed companies the ratio may be less than 20% and as low as zero. This is not a bad thing as long as the company continues to increase its revenue and earnings over the years. For companies considered value stocks their dividend payout ratio may be above 35%. Typically well established companies, with a high reputation, are leaders in their industry.
For income investors, the desired payout ratio can be anywhere from 55% to higher. Capital appreciation does not typically interest Income investors. It is solely about high dividend paying companies. A good source for solid and consistent dividend paying stocks is the Dow Jones Industrial Average.
In MarketXLS we provide many formulas that help you find out high monthly dividend paying stocks. For example…
You can find out how much dividend a company has paid between two dates in the past. You’re also able to see what their dividend yields and so on.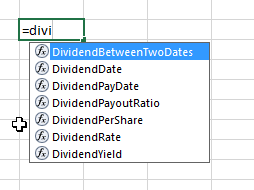
You can also get the full dividend history for all the US stocks. In order to perform trend analysis to get ideas about the growth of the company.

I invite you to book a demo with me or my team to save time, enhance your investment research, and streamline your workflows.