Fundamental Analysis Of Stocks With Marketxls

Fundamental analysis of stocks is the key method of determining a stock’s real or “fair market” value. Fundamental analysts search for stocks that are currently trading at prices that are higher or lower than their real value.
With the MarketXLS add-in, you will be able to create highly flexible templates for the analysis of companies and stocks. Simply by changing the ticker in focus, you will be able to call vast amounts of data about a company into your spreadsheet. Alternatively, you can create spreadsheets in which you will compare several companies you select, by the metrics you specify.
The list of MarketXLS functions that you can use inside our add-in for Microsoft Excel is continuously expanding. This page is your go-to resource for the general overview of fundamental historical functions at your disposal. As new capabilities are added, they will be listed here.
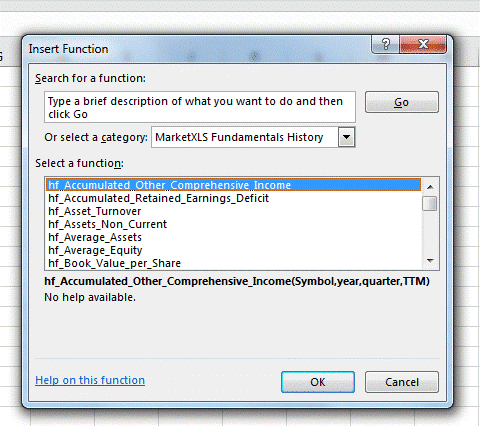
All functions in this category start from a prefix “hf_” hf stands for “Historical Fundamentals“. This is the category of functions that you would use to carry out the fundamental analysis of stocks. These functions can be used to get historical values (quarterly, yearly, trailing 12 months) of fundamentals from a company’s financial statements. The values returned from these functions will exactly match the values that you would get from SEC filings
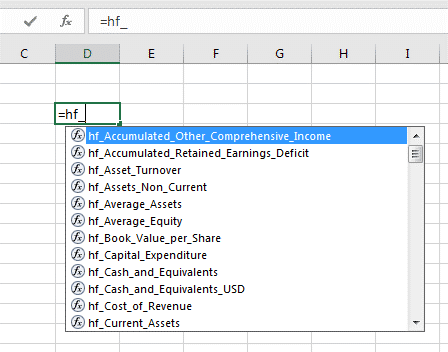
You can just start typing =hf_ and Excel will also give a list of all functions available like shown below:
All these functions have a consistent format of usage which is explained with examples below:
Revenue of MSFT Q3 2013: =hf_revenue("MSFT","2013","3")
Revenue of MSFT Year 2015: =hf_revenue("MSFT","2015")
Trailing 12 months Revenue of MSFT Year 2015 Q3: =hf_revenue("MSFT","2015","3","TTM")
The following are the arguments for these functions…
- Symbol – Any US stock symbol
- Year – Year as a string. Enclose the year number in Double quotes if entering in the formula itself. You can also refer to a cell that carries the year numeric value.
- Optional – Quarter Number – Enclose the Quarter number in Double quotes if entering in the formula itself. You can also refer to a cell that carries the year numeric value.
- Optional TTM – Type “TTM” within double quotes
Important Note: All Quarterly values refer to Calendar Quarters and not the fiscal quarters. So, when you ask to get data for Q1 it means data for January to March End. Now this period could be Quarter 3 in some companies whose Fiscal year is from April to March.
We are especially happy to present to you a new way to define periods, which is a feature that our long-time users will especially appreciate. If using the classical way of defining periods (as explained above), when you wanted to get values from a company’s latest financial statements, you first had to find out which fiscal year (or quarter) is the latest for which a company issued an SEC filing. After that, you often had to find out a company’s terminology in naming fiscal years, which do not end on December 31st. For example, if a company’s fiscal year ends on January 31st, the year which ended on January 31st, 2019, might be considered financial year 2018 or 2019, depending on the company.
To solve this problem, we have introduced the option to define periods with relative references. If you are interested in the last reported year, you will define the period as “ly.” For example:
=hf_revenue("MSFT","ly")
You can do the same for the last reported quarter by using “lq”, or for the last 12 months (last four reported quarters) with period defined as “lt”.
Additionally, you may want to specify cells in which the last date of the specified period will be displayed.
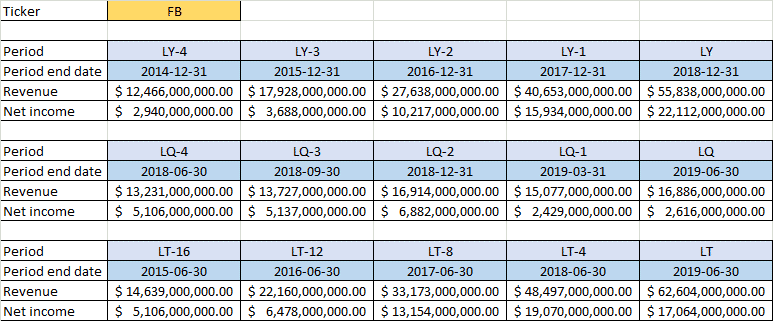
The table above shows a very simple overview of how it works. A spreadsheet set up with relative time references will automatically update with new values when the analyzed company publishes new financial reports. The last 12 months periods (“lt”) are especially useful, as they enable you to track trends in the company’s performance on an annual basis, without waiting for the fiscal year to end.
Take your investments research to next level and power your fundamental analysis of stocks with easy to use MarketXLS functions today.

I invite you to book a demo with me or my team to save time, enhance your investment research, and streamline your workflows.