How to Calculate Terminal Value in Excel for Stock Market Investing

Understanding Terminal Value in Stocks
Terminal value refers to a value used to estimate the future cash flows of a company beyond the explicit forecast period in a discounted cash flow (DCF) analysis. Typically, this value is calculated by applying a multiple to the last forecast period’s cash flow or by using a perpetuity growth model in Excel. Terminal value represents the value of the company beyond the forecast period and encompasses all future expected cash flows assuming that the firm will operate at a similar rate of return in a stable environment. So, investors use Terminal value in Excel to estimate a company’s long-term value, which is essential when making investment decisions.
Calculating Terminal Value in Excel
To calculate the terminal value in Excel, various steps can be taken. Firstly, one can utilize the present value of a perpetuity formula. Secondly, it is essential to have knowledge about the expected future cash flow, the required rate of return, and the expected lifespan of the project. Afterward, you can enter the expected future cash flow, the required rate of return, and the expected life of the project. Subsequently, you can calculate the terminal value using the formula PV = CF/(1+r)^n, where CF is the expected future cash flow, r is the required rate of return, and n is the project life. Finally, enter the formula, and the terminal value will be displayed on the spreadsheet. By following these steps, investors can calculate the terminal value of a company and use it to estimate the company’s long-term value for making informed investment decisions.
How can MarketXLS Help?
MarketXLS can help traders and investors make more informed decisions. With a suite of powerful tools, MarketXLS provides real-time stock market data, analytics, screening, and back-testing capabilities to its users. Its cutting-edge software offers users an efficient way to access market information and make stock-related decisions. Furthermore, its advanced capabilities include powerful analytics, key performance indicators, powerful charting and technical analysis, and more. So, with MarketXLS, traders and investors can build more robust portfolios and make better decisions in more timely manners.
Relevant MarketXLS functions related to terminal value and stock valuation include:
| Function Title | Function Example |
|---|---|
| Profit Margin (Last Quarter) | =hf_Profit_Margin(“MSFT”,2022)- Returns the value for the year 2022. =hf_Profit_Margin(“MSFT”,2022,2)- Returns the value for the year 2022 and the calendar quarter 2 =hf_Profit_Margin(“MSFT”,2022,3,”TTM”)- Returns the value for the year 2022 and trailing twelve months from the calendar quarter =hf_Profit_Margin(“MSFT”,”lq”) – Returns the value for the last quarter =hf_Profit_Margin(“MSFT”,”lq-1″)-Returns the value for the last quarter-1 =hf_Profit_Margin(“MSFT”,”ly”) – Returns the value for the last year =hf_Profit_Margin(“MSFT”,”ly-1″) – Returns the value for the last year – 1 =hf_Profit_Margin(“MSFT”,”lt”) – Returns the value for the last 12 months. =hf_Profit_Margin(“MSFT”,”lt-1″) – Returns the value for the previous last 12 months. |
| 5 Year Return | =StockReturnFiveYears(“MSFT”) – Returns the total stock return for MSFT for the given period =StockReturnFiveYears(“MSFT”,”total”) – Returns the total stock return for MSFT for the given period =StockReturnFiveYears(“MSFT”,”price) – Returns the price return for MSFT for the given period |
| Enterprise Value | =EnterpriseValue(“MSFT”) |
| Market Cap | =marketcap_real_time(“MSFT”) |
Use AI driven search for all functions on MarketXLS here: https://marketxls.com/functions
Download from the link below, a sample spreadsheet created with MarketXLS Spreadsheet builder
Note this spreadsheet will pull latest data if you have MarketXLS installed. If you do not have MarketXLS consider subscribing here
https://mxls-templates.s3.us-west-2.amazonaws.com/MarketXLS-Model-ID-9IqspA.xlsx
MarketXLS also provides relevant templates to help with stock valuation and analysis.
| Template Title | Template Link | Screenshot |
|---|---|---|
| Dividend Growth Model (Gordon Method | https://marketxls.com/template/dividend-growth-model-gordon-method | 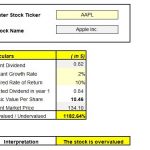 alt="How to Calculate Terminal Value in Excel for Stock Market Investing"> alt="How to Calculate Terminal Value in Excel for Stock Market Investing"> |
Use AI driven Search for all templates on MarketXLS here: https://marketxls.com/templates/
Conclusion
In conclusion, understanding terminal value is an essential part of stock valuation, and MarketXLS offers a wide range of powerful tools and functions to help traders and investors make informed decisions.

I invite you to book a demo with me or my team to save time, enhance your investment research, and streamline your workflows.