Portfolio Comparison Template

Investing can seem like a daunting task. A few challenges faced by investors are information overload, limited capital, unknown risks, not getting expert help, etc.
With the unique template offered by MarketXLS, investors can gauge their investment styles and compare their portfolios with the standard portfolios made by industry experts which represent a certain risk-reward ratio. We have designed this template to help the investor in identifying their investment style by assigning them a risk-taking ability measure based on their profile analysis and a behavioural loss tolerance sheet. Based on the results, MarketXLS suggests recommended portfolios. And that’s not all. Next, the investors can choose a Model portfolio to compare it with their own portfolio on various parameters, observe the differences and help them take corrective action accordingly if required.
How It Works
The template consists of two sections:
> Investor Profile (Active File) – Based on a sample of questions we gauge the Investor’s risk-taking ability and score it.
The scoring is done from 1-4, where 1 means most risk-averse and 4 being the risk-taker.
Comparison Sheet – Based on the risk-taking ability of the investor, we suggest some default portfolios that will suit the investor. He/she can compare his/her portfolio with our suggested ones on various parameters.
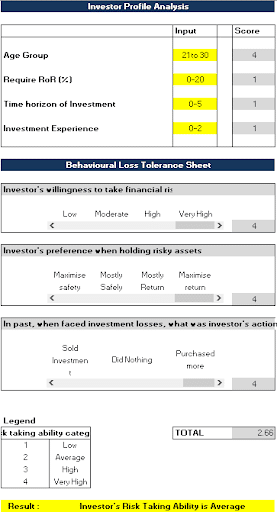
This picture is a representation of the certain factors that are taken into account in order to assess an Investor’s Risk-Taking Ability.
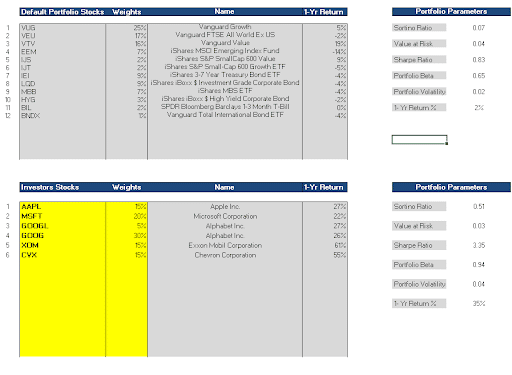
As per the investor’s risk-taking ability, above is a representation of how default stocks and portfolios are suggested. The box above shows the default stocks and portfolio parameters provided by MarketXLS and the box below the top box shows the stocks owned by the investor and an assessment of his/her portfolio’s parameters.
Portfolio Parameters Overview
- Sortino Ratio
The Sortino ratio takes an asset or portfolio’s return and subtracts the risk-free rate, and then divides that amount by the asset’s downside deviation.
The higher the sortino ratio, the better. If your portfolio’s Sortino ratio is better than the Sortino ratio provided by the default portfolio, then your portfolio may outperform the default portfolio.
- Value at risk
Value at risk is a measure of the risk of loss for investments. It estimates how much a set of investments might lose, given normal market conditions, in a set time period such as a day.
Risk managers use VaR to measure and control the level of risk exposure.
- Sharpe Ratio
The Sharpe ratio is a measure of risk-adjusted return. It describes how much excess return you receive for the volatility of holding a riskier asset. The higher the sharpe ratio, the better the portfolio.
- Portfolio Beta
Portfolio beta describes the relative volatility of an individual securities portfolio, taken as a whole, as measured by the individual stock betas of the securities making it up. The lower the portfolio beta, the better your portfolio.
- Portfolio Volatility
Portfolio volatility is a measure of portfolio risk, meaning a portfolio’s tendency to deviate from its mean return. A portfolio is made up of individual positions, each with its own volatility measures. These individual variations, when combined, create a single measure of portfolio volatility. The lower the portfolio volatility, the better.
6.1-Year return
An annual or annualized return is a measure of how much an investment has increased on average each year, during a specific time period. … An annual return can be determined for a variety of assets, including stocks, bonds, mutual funds, ETFs, commodities, and certain derivatives.
Here’s a link where you can find default portfolios:http://www.lazyportfolioetf.com/allocation/

I invite you to book a demo with me or my team to save time, enhance your investment research, and streamline your workflows.