Portfolio Efficient Frontier Chart, Split History & more (New Release 9.3.4.8)
With great excitement, we announce the release of MarketXLS Version 9.3.4.8 today (February 28th, 2023). As highlighted below, this update includes a portfolio efficient frontier chart, split history data, dividend payout functions, and many other changes.
Key Updates Summary:-
- Configure trades (including Multileg option strategies) for ThinkorSwim directly from MarketXLS.
- New Dividend payout functions signal consistent growth and profitability.
- All =StockReturn() functions have been updated to include either price or total returns.
- New Split History menu button to download stock split data.
- New ITM, OTM, and ATM arguments in Expiration & Strike functions to get all expiration dates and strikes for a stock’s option.
- =Close_Historical now can get the last available price for the weekend or holiday if you choose.
- Updated Portfolio Efficient Frontier Chart function.
- New Options Profit Calculator tool added in screener list.
- Introducing our Referrals feature! Help us share the word about our services with other investors in your network.
- MarketXLS’s new funding round.
Here are the new updates:-
1) ThinkorSwim SingleLeg and MultiLeg function
In this update, we added 2 new ThinkorSwim functions
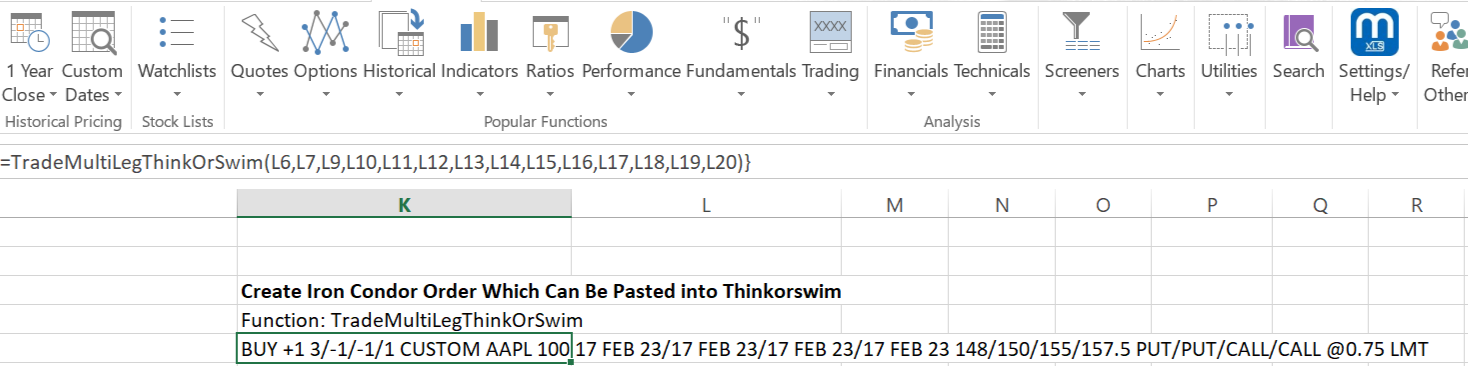
1) =TradeMultiLegThinkOrSwim()
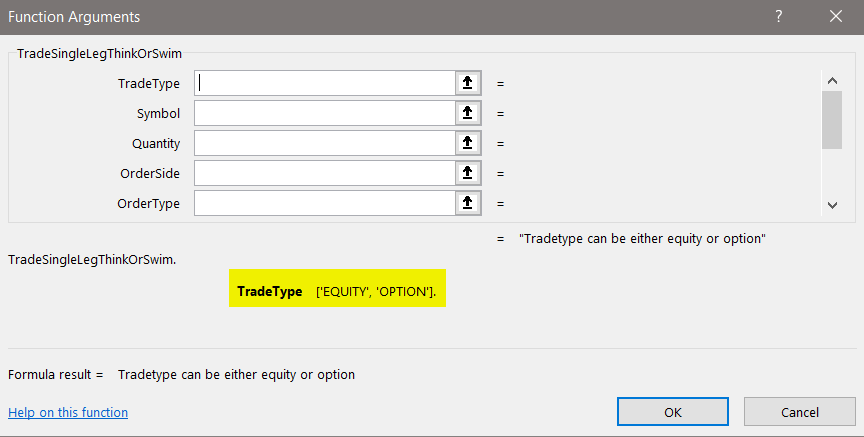
2) =TradeSingleLegThinkOrSwim()
Different strategies involving single or multiple legs can be developed using the functions demonstrated below. You can check the inputs required in the Functions argument tab. This function returns a value that you can paste into your ThinkOrSwim platform to send a trade.
 alt="Portfolio Efficient Frontier Chart, Split History & more (New Release 9.3.4.8)">
 alt="Portfolio Efficient Frontier Chart, Split History & more (New Release 9.3.4.8)">
2) Track a security’s financial stability with Consecutive Periods of Increasing and Dividend Payouts
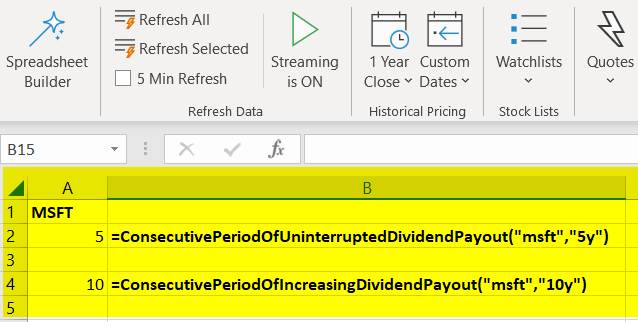
1)=ConsecutivePeriodOfIncreasingDividendPayout(“MSFT”,”5y”)
Consecutive period of increasing dividend payout means that a company has consistently increased the amount of dividends it pays out to its shareholders over a certain period of time, indicating the company’s profitability and stability.
2) =ConsecutivePeriodOfUninterruptedDividendPayout(“msft”,”5y”)
Consecutive period of uninterrupted dividend payout refers to a situation where a company has consistently paid dividends to its shareholders without interruption over a certain period. This could be over a number of years or many consecutive quarters. This indicates stability and consistency in the company’s profitability and ability to return value to shareholders.
To get data for each quarter, use “Q” instead of “Y.”
 alt="Portfolio Efficient Frontier Chart, Split History & more (New Release 9.3.4.8)">
3) StockReturn() function now includes Price and Total Return options for performance analysis
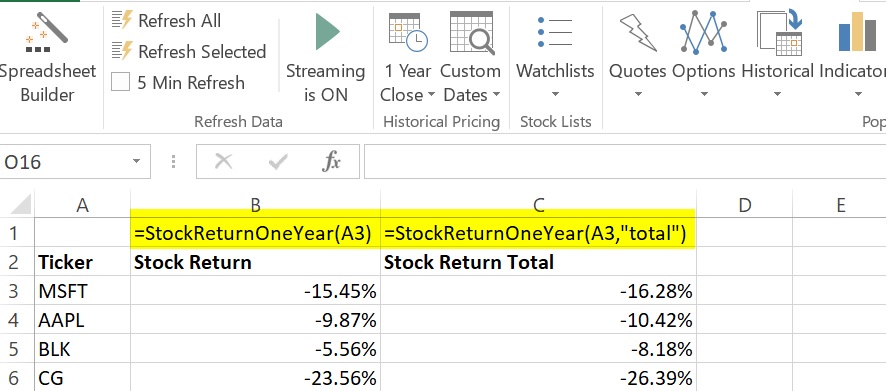
The StockReturn() function calculates the returns of a given stock over a specified period of time. It has been updated to include price returns (price appreciation over time) and total returns (price appreciation and dividends paid out). Both functions are already adjusted for splits.
Example – To calculate total returns of MSFT stock over the last year, the user would call the =StockReturnOneYear(“MSFT”,”total”) function.
 alt="Portfolio Efficient Frontier Chart, Split History & more (New Release 9.3.4.8)">
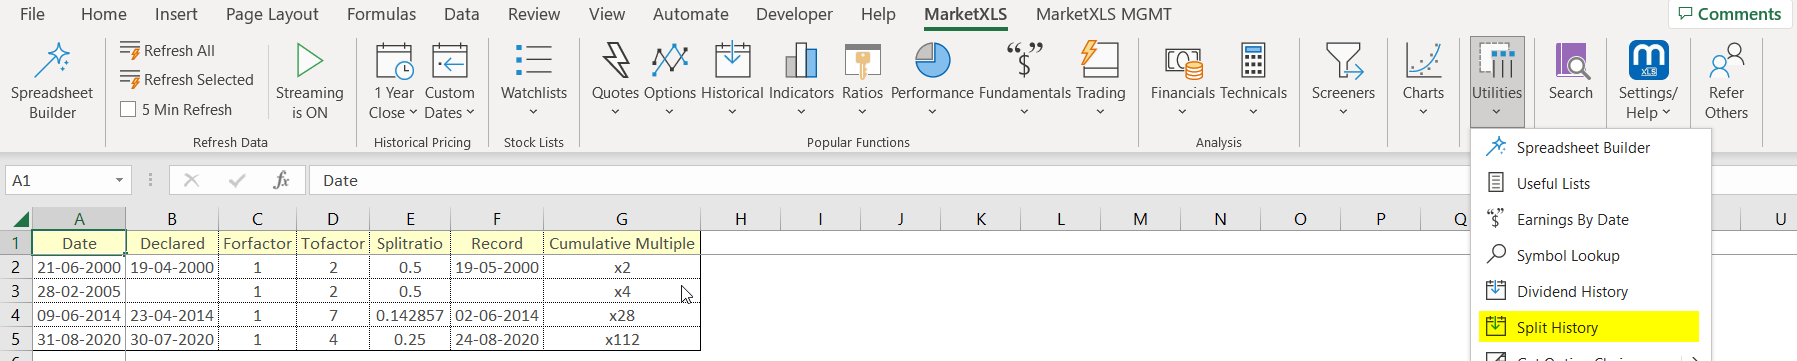
4) Brand new Split History function now on MarketXLS
To obtain split history of stocks going back 20 years or more, you can use our Split History function in the Utilities sections.
 alt="Portfolio Efficient Frontier Chart, Split History & more (New Release 9.3.4.8)">
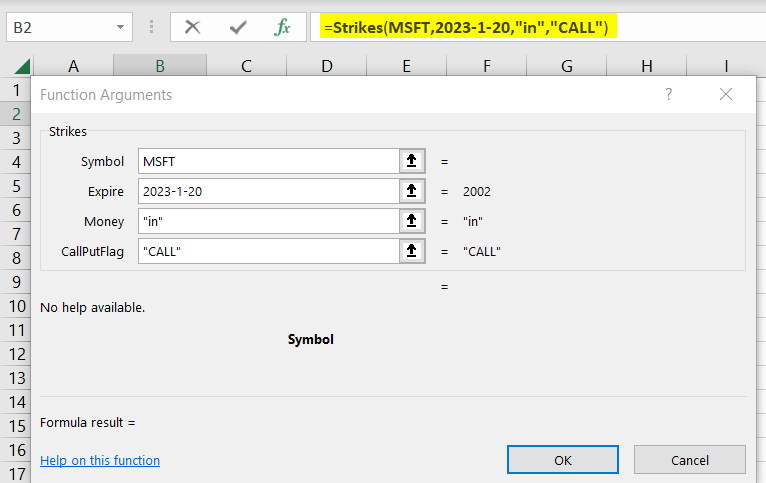
5) Expiration and Strike Functions for ITM, OTM, and ATM Options
The Expirations and Strike functions can now allow you to determine the strikes and expirations of ITM, ATM, and OTM options by providing an additional argument “in”, “at” and “out”. Example to get ITM options use =Strikes(“Stock”,” Expiration Date”,”in”,”call”).
ITM = in
ATM = at
OTM = out
 alt="Portfolio Efficient Frontier Chart, Split History & more (New Release 9.3.4.8)">
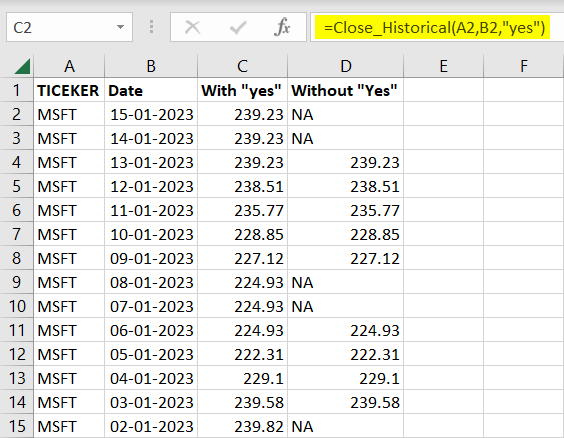
6) Get Friday’s closing prices of stocks now with our =Close_Historical function.
The “Close_Historical” function has been enhanced to include the capability to retrieve the last closing prices for a given stock, even if the date you put in as an argument is a weekend or holiday.
For example. =close_historical(“MSFT”,”Date”,”Yes”) will return the last closing price of MSFT if the Date you enter is a holiday or weekend. “No” argument will return an NA.
“Yes” will always return the price of the last day when the market was open.
 alt="Portfolio Efficient Frontier Chart, Split History & more (New Release 9.3.4.8)">
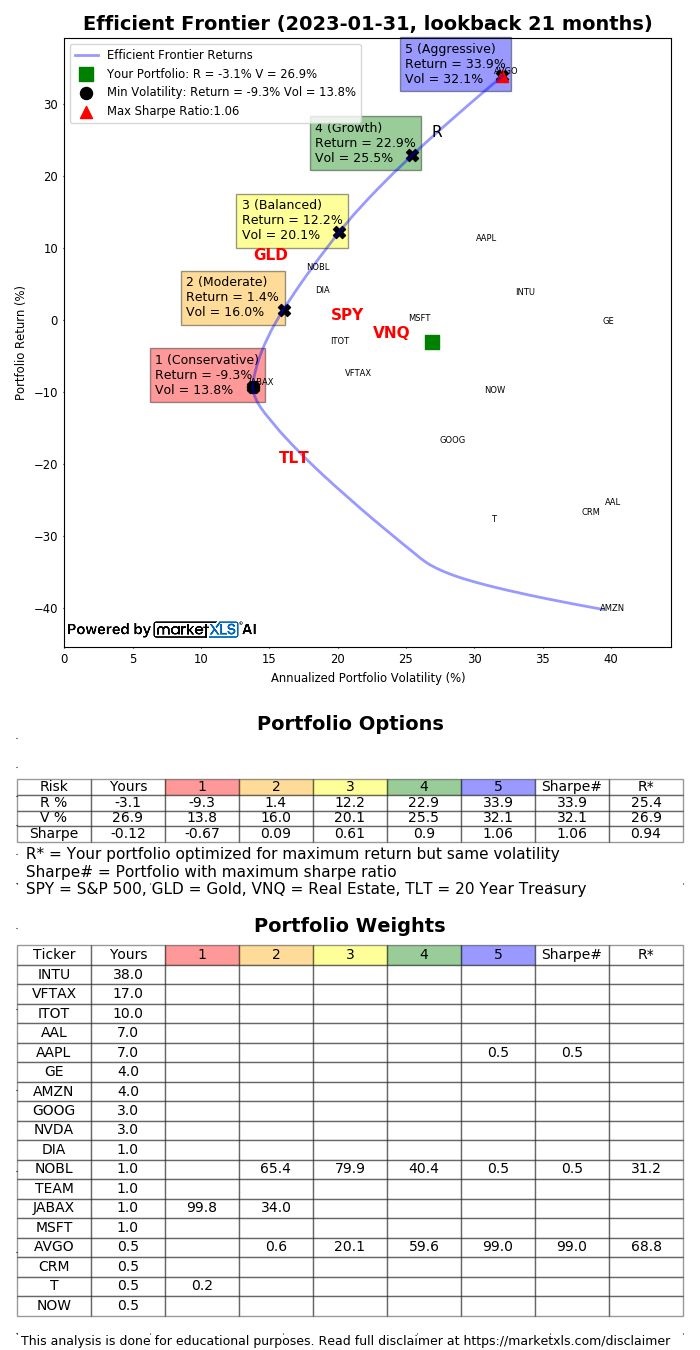
7) Updated Portfolio Efficient Frontier Chart function
Elevate your financial planning with this advanced portfolio optimization solution. The chart displays six different portfolios, including conservative, moderate, balanced, growth, and aggressive, along with the R portfolio that shows maximum return with existing volatility.
We will conduct a webinar shortly where we will go in-depth on our new portfolio optimization and analytics functions.
 alt="Portfolio Efficient Frontier Chart, Split History & more (New Release 9.3.4.8)">
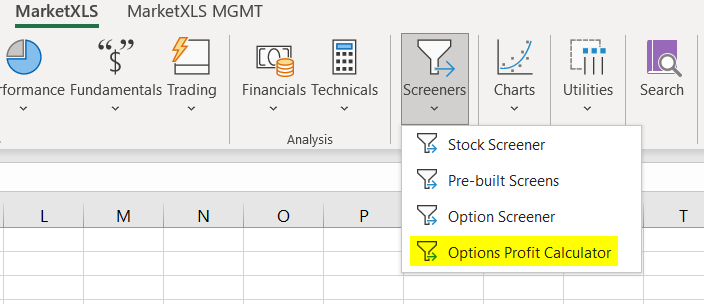
8) New Options Profit Calculator tool added to screener list.
A new tool, the “Options Profit Calculator” has been added to the screener list. Please use this tool if you have real-time access to options data. There is no additional cost if you have real-time options data in MarketXLS.
This tool calculates potential profit or loss from options trading strategies, considering the underlying stock price, strike price, expiration date, and option premium. Users can input these variables for different scenarios, and the tool will calculate the potential profit or loss.
 alt="Portfolio Efficient Frontier Chart, Split History & more (New Release 9.3.4.8)">
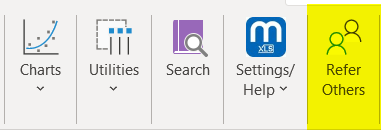
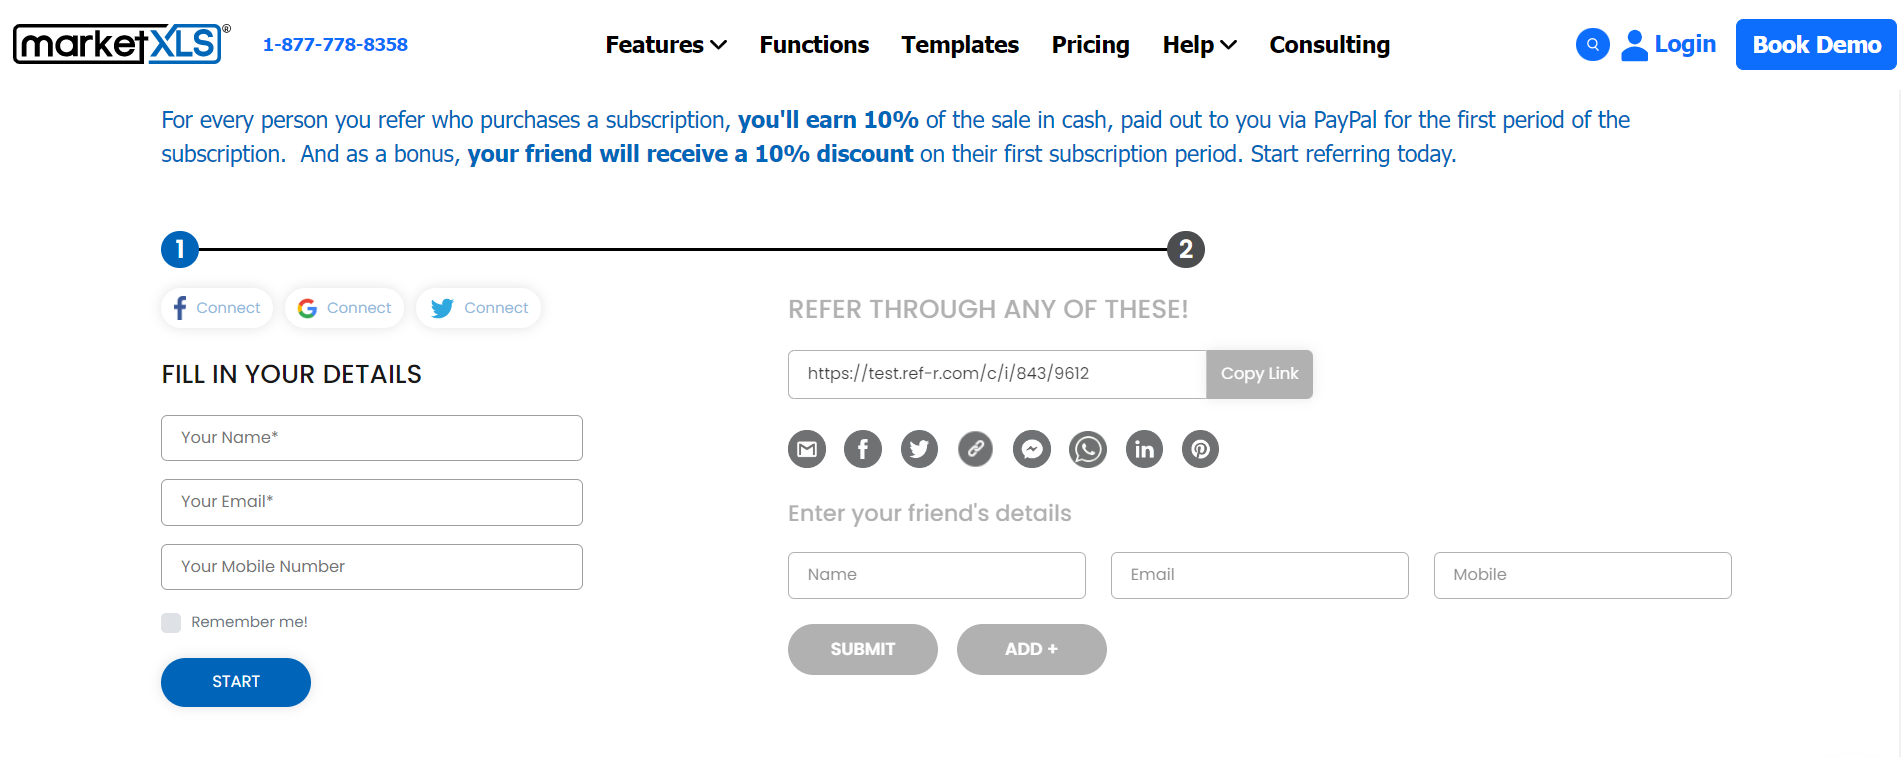
9) Share MarketXLS with others
For everyone you refer who purchases a subscription, you’ll earn 10% of the sale in cash, paid out to you via PayPal for the first subscription period. And as a bonus, your friend will receive a 10% discount on their first subscription period. Start referring today.
We have other affiliate programs, contact us at support@marketxls.com for any customs arrangement.
 alt="Portfolio Efficient Frontier Chart, Split History & more (New Release 9.3.4.8)">
 alt="Portfolio Efficient Frontier Chart, Split History & more (New Release 9.3.4.8)">
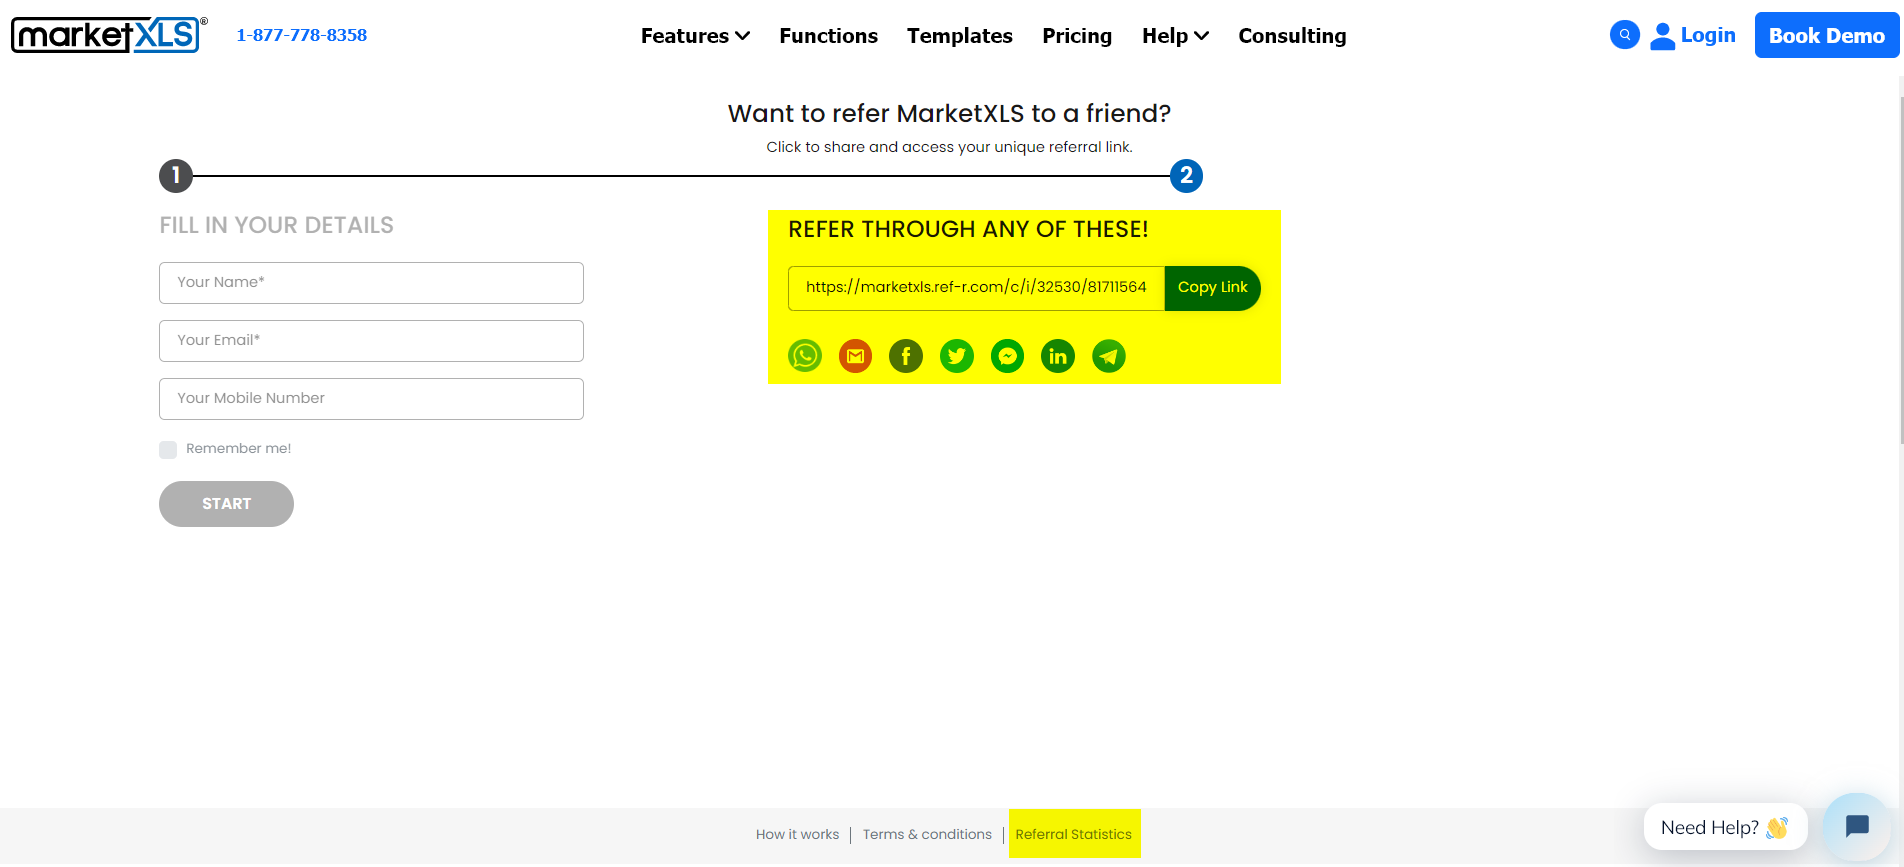
After you sign-up, you will receive a custom referral link that can be shared within your group, and you will be able to view your referral statistics by clicking on the Referral Statistics button below.
 alt="Portfolio Efficient Frontier Chart, Split History & more (New Release 9.3.4.8)">
10) MarketXLS new funding round
Note from Ankur (Founder & CEO):
We have recently opened an investment round for MarketXLS and we are inviting our customers to be a part of this journey with us. As a customer, you already know the value and potential of our platform, and we would be honored to have you as a part of our growth.
If you want to learn more about this opportunity and potentially invest in MarketXLS, please don’t hesitate to contact me at ankur@marketxls.com. I would happily provide you with more information and answer any questions.
Thank You for your continued support and trust in MarketXLS. We look forward to continuing to serve you and help you achieve your investment goals.
Thanks
Ankur Mohan
—————————————————————————————————————————
Our team has also performed minor optimizations to run MarketXLS smoothly. Please email us at support@marketxls.com with any concerns or issues you face.
Click here to join our Reddit community and engage with other MarketXLS users.
MarketXLS focuses on delivering the best Excel experience to its users; help us improve MarketXLS by sharing your feedback.

I invite you to book a demo with me or my team to save time, enhance your investment research, and streamline your workflows.