Strap Strangle Options Strategy (Using MarketXLS Template)
")
Meaning
The Strap strangle is a long strangle strategy that buys more call options than put options having a bullish inclination. As a Volatile Options Strategy, it is useful when the direction of a breakout is uncertain but more inclined towards the upside. Strap strangles can also be used to balance strangles into delta-neutral positions. Strap strangles make a higher profit when the underlying stock breaks upwards but will make a lesser profit when the underlying stock breaks downwards. Thus it will profit from a big movement in either direction.
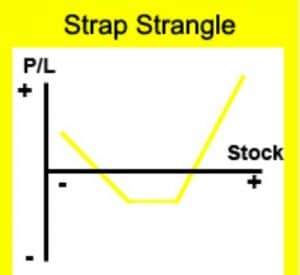 Strap Strangle Construction

Execution of the Strap Strangle strategy involves buying out of the money calls and out of the money put, just like the Long Strangle strategy. The only difference is one needs to buy a higher number of calls than puts:
- Buy 1 OTM Put
- Buy 2 OTM Calls
The main choice one needs to make is what ratio of calls to puts to use. As a starting point, a 2 to 1 ratio is suggested but one can adjust this as he finds it suitable. This ensures that the premium cost of the options purchased by the trader remains at a bare minimum.
Profit Potential
Strap strangles have unlimited profit potential as long as the stock continues moving in one direction. Large profit is achievable with this strategy when the underlying asset price makes a strong movement either upwards or downwards at expiration, with greater gains to be realized with an upward move.
The formula for calculating profit is:
- Profit = Difference between underlying stock price and OTM strike price x number of call options (if stock is higher) or Difference between OTM strike price and underlying stock price x number of put options (if stock is lower) – net debit for premium
- Maximum Profit = Unlimited
Limited Loss
Maximum loss is limited to the initial investment and occurs when “Price of Underlying Security < Strike of Leg A and > Strike of Leg B ”
The maximum loss for the strap strangle is limited and occurs when the underlying asset price on the expiration date is trading between the strike prices of the Call and Put options bought. At this level, all the options expire worthless and the trader loses the entire premium paid to enter the trade.
The formula for calculating maximum loss is given below:
- Max Loss = Net Premium Paid + Commissions Paid
- Max Loss occurs when Price of Underlying Security < Strike price of Leg 1 (Call option) and > Strike price of Leg 2 (Put option)
- Maximum Loss = Limited
Breakeven Points
There are 2 breakeven points for the Strap Strangle position:
- Upper Breakeven Point = Strike Price of Call option + (Net Premium Paid/2)
- Lower Breakeven Point = Strike Price of Put options – Net Premium Paid
Applying Strip Strangle Strategy Using MarketXLS Template With an Example:
MarketXLS software is a one-stop solution for the analysis of your entire investments. It provides a host of functions like EPS, various ratios, key fundamentals, historical data, options pricing and much more to assess the value of your investments. It provides a variety of templates for various options trading strategies and also to compare your portfolio stocks for doing a better analysis of your investments.
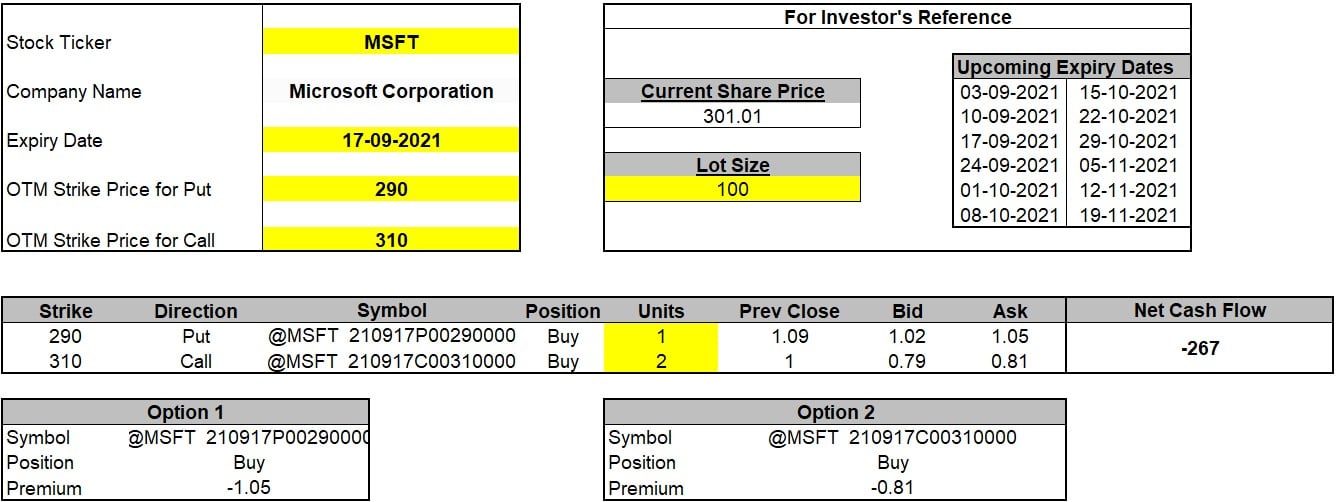
Step 1: Enter the stock ticker in cell D6 and press enter. The template will provide the upcoming expiry dates for the stock, current market price and lot size. Select any one of the expiry dates and change the lot size according to your preference. Note that the template uses DD-MM-YYYY format for expiry dates.
 Link to the template: https://marketxls.com/template/strap-strangle/
Step 2: Enter the OTM Strike Price for Put in cell D12 and OTM Strike Price for Call in cell D14 and press Enter. You can also adjust the Call to Put ratio in cells G19 and G18.
Step 3: The template might ask you to refresh. Go to the MarketXLS tab in the ribbon > Refresh All. Click on Refresh All.
The template uses the ask price for options to calculate the related premium to be paid (net cash flow) by you.
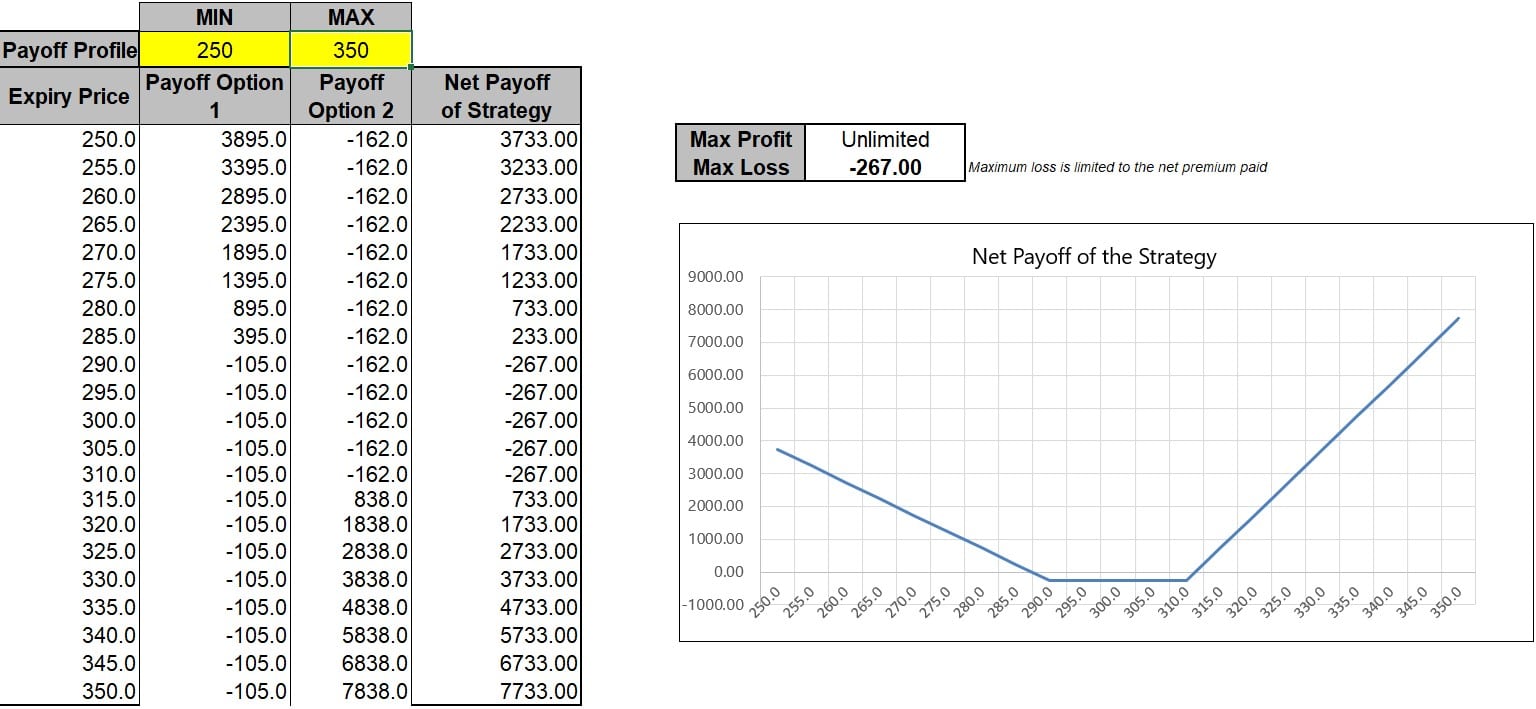 Step 4: The template also provides the Net Payoff Profile of the strategy. You need to enter the expected minimum and maximum expiry prices for the period. It will calculate the net profit or net loss for all the levels of expiry prices and present it graphically.
Microsoft Corporation (MSFT“>MSFT) as an example in the above template:
MSFT“>MSFT stock is trading at levels of $301 on 2nd September 2021. I have selected the upcoming expiry of 17th September 2021 to enter the trade. I want to execute a Strap Strangle options strategy from the current level by buying an OTM Put @$290 and also buying 2 OTM Calls @$310 as I believe that the stock may witness more bullish trends in the near future.
The template will calculate the premium amounts for all the options and thus calculate the net cash flow for entering the trade, which is $267 debit in this case.
[ -1.05*100($290 Put) – 0.81*100*2($310 Call) = -$267 ]
Suppose if the stock keeps trading between $290 and $310 on the expiration date, both the Calls and Put option expire worthless and I will suffer the maximum loss which is equal to the initial debit of $267 taken to enter the trade.
Suppose the stock crashes down to $270 at expiration, the Call options will expire worthless but the Put option will expire in the money with an intrinsic value of $2000. Subtracting the initial debit of $267, the profit comes to $1733.
Suppose the stock rallies to $330 at expiration, now the Put option will expire worthless but the Call options expire in the money and have an intrinsic value of $4000. Subtracting the initial debit of $267, the profit comes to $3733, thus giving greater profits with the same margin in expiry prices.
This profit will even be greater if the stock price rises above $330. The net profit can easily be determined by looking at the net payoff table within the template.
Here is a video explaining the Strap Strangle Strategy using MarketXLS:
Bottom Line
The design of the strategy is simple making it suitable for a beginner. As such, there is no major planning involved, except deciding the strike prices of the options. It provides a higher profit than a regular Strangle if the stock breaks out to the upside. The investor needs to use their estimate and assumption about the movement of the stock price to enter this strategy. It also requires a lower net debit than a Strap Straddle because of the OTM strike prices involved.
It’s slightly more complicated than the long strangle, but it’s an excellent alternative if your expectation is that the price of the underlying security is more likely to rise significantly than drop significantly.
If you want to learn more about different option strategies, visit https://marketxls.com/blog
Disclaimer
All trademarks referenced are the property of their respective owners. Other trademarks and trade names may be used in this document to refer to either the entity claiming the marks and names or their products. MarketXLS disclaims any proprietary interest in trademarks and trade names other than its own, or affiliation with the trademark owners.
None of the content published on marketxls.com constitutes a recommendation that any particular security, portfolio of securities, transaction, or investment strategy is suitable for any specific person. The author is not offering any professional advice of any kind. The reader should consult a professional financial advisor to determine their suitability for any strategies discussed herein. The article is written for helping users collect the required information from various sources deemed to be an authority in their content. The trademarks if any are the property of their owners and no representations are made.
Reference
http://www.optiontradingpedia.com/strap_strangle.htm
Image Source
http://www.optiontradingpedia.com/strap_strangle.htm
Get Market data in Excel easy to use formulas
- Real-time Live Streaming Option Prices & Greeks in your Excel
- Historical (intraday) Options data in your Excel
- All US Stocks and Index options are included
- Real-time prices and data on underlying stocks and indices
- Works on Windows, MAC or even online
- Implement MarketXLS formulas in your Excel sheets and make them come alive
- Save hours of time, streamline your option trading workflows
- Easy to use with formulas and pre-made templates

I invite you to book a demo with me or my team to save time, enhance your investment research, and streamline your workflows.