
Table of Contents
- Introduction
- What is Implied Volatility?
- What is Realized Volatility?
- Is implied volatility higher than realized volatility?
- What is VIX Index?
- Is the VIX realized or implied?
- How to get real-time IV with MarketXLS?
- How to get Realized Volatility with MarketXLS?
- Summary
Introduction
Understanding market volatility is key to smart trading decisions. Implied volatility (IV) and realized volatility are two critical concepts. IV looks ahead, predicting future price swings and influencing option pricing. Realized volatility, however, examines past price movements. Comparing both helps traders gauge risk and market sentiment. Let’s dive deeper into these essential volatility measures and how you can track them in real-time with MarketXLS tools.
What is Implied Volatility?
Implied volatility (IV) is a crucial concept in option trading. It reflects the market’s expectations of a stock’s future volatility. Unlike historical volatility, which looks back at past price movements, IV predicts potential price fluctuations. Traders use it to gauge market sentiment and to price options premiums. When IV is high, options are generally more expensive; when it is low, they are cheaper. A rise in IV often indicates increased market uncertainty or a looming event. Hence, traders closely monitor IV to make informed decisions. It is a fundamental part of the Black-Scholes option pricing model.
What is Realized Volatility?
Realized volatility is a measure of the actual historical volatility of an asset over a specific period. In the context of option trading, it is crucial for pricing options and managing risks. Unlike implied volatility, which is forward-looking, realized volatility is retrospective. Traders use it to gauge how much the asset’s price has fluctuated in the past. This metric helps in assessing the accuracy of volatility forecasts and the appropriateness of option premiums. Accurate realized volatility data can lead to more informed trading decisions. Factors like market events and economic releases significantly impact realized volatility. Therefore, continuous monitoring is essential for successful option trading strategies.
Comparing Implied Volatility vs Realized Volatility: Which is Higher?
Implied volatility and realized volatility are key concepts in options trading. Implied volatility reflects market expectations about future volatility, derived from options prices. Realized volatility measures past price fluctuations. Typically, implied volatility is higher than realized volatility. This difference exists because traders demand a risk premium. They require compensation for uncertainty about the future. Implied volatility can be affected by market sentiment. When fear or uncertainty rises, implied volatility also tends to increase. Conversely, realized volatility is purely historical. It’s based on actual market performance over a specified period. While the two metrics are related, they serve different purposes for investors. Implied volatility is predictive, while realized volatility is retrospective.
Understanding the VIX Index: Implied Volatility vs Realized Volatility
The VIX Index, also known as the “fear gauge,” measures market volatility expectations over the next 30 days. It is derived from the prices of S&P 500 index options. Higher VIX values indicate higher anticipated volatility, suggesting increased fear among market participants. Conversely, lower values signal calm market conditions. Option traders use the VIX to gauge market sentiment and to make informed trading decisions. A rising VIX often correlates with decreasing stock prices, signaling potential opportunities for options strategies like buying puts. It serves as a barometer for the overall health of the market and helps in risk management.
Is the VIX implied volatility vs realized volatility?
The VIX, or Volatility Index, is an implied measure of market volatility. It represents the market’s expectations for future volatility derived from option prices. Investors use the VIX to gauge the level of fear or complacency among market participants. Unlike realized volatility, which is based on historical price movements, the VIX looks forward. It helps traders make informed decisions by predicting potential future market swings.
How to get real-time IV with MarketXLS?
Function Syntax:
=QM_Stream_ImpliedVolatility(symbol)Example Usage:
For example, to get the real-time implied volatility for a Microsoft call option with an expiration date of January 14, 2022, and a strike price of 300, you would use:
=QM_Stream_ImpliedVolatility("@MSFT 220114C00300000")Here’s a breakdown of the arguments:
– symbol: This represents the option symbol for which you want to get the real-time implied volatility.
Detailed Description:
– Function Name: Stream Option Implied Volatility
– Category: Price Quotes
– Description: This function streams the real-time implied volatility for the specified ticker/options symbol.
– Status: Live
– Expression Type: Value (expressed typically in decimal form)
– Data Assets: Options
– Update Frequency: Real-time
– Available Regions: US, Canada
– Platform: Desktop
This function does not require additional calculations or transformations, making it straightforward to integrate into your Excel workflow for real-time data analysis.
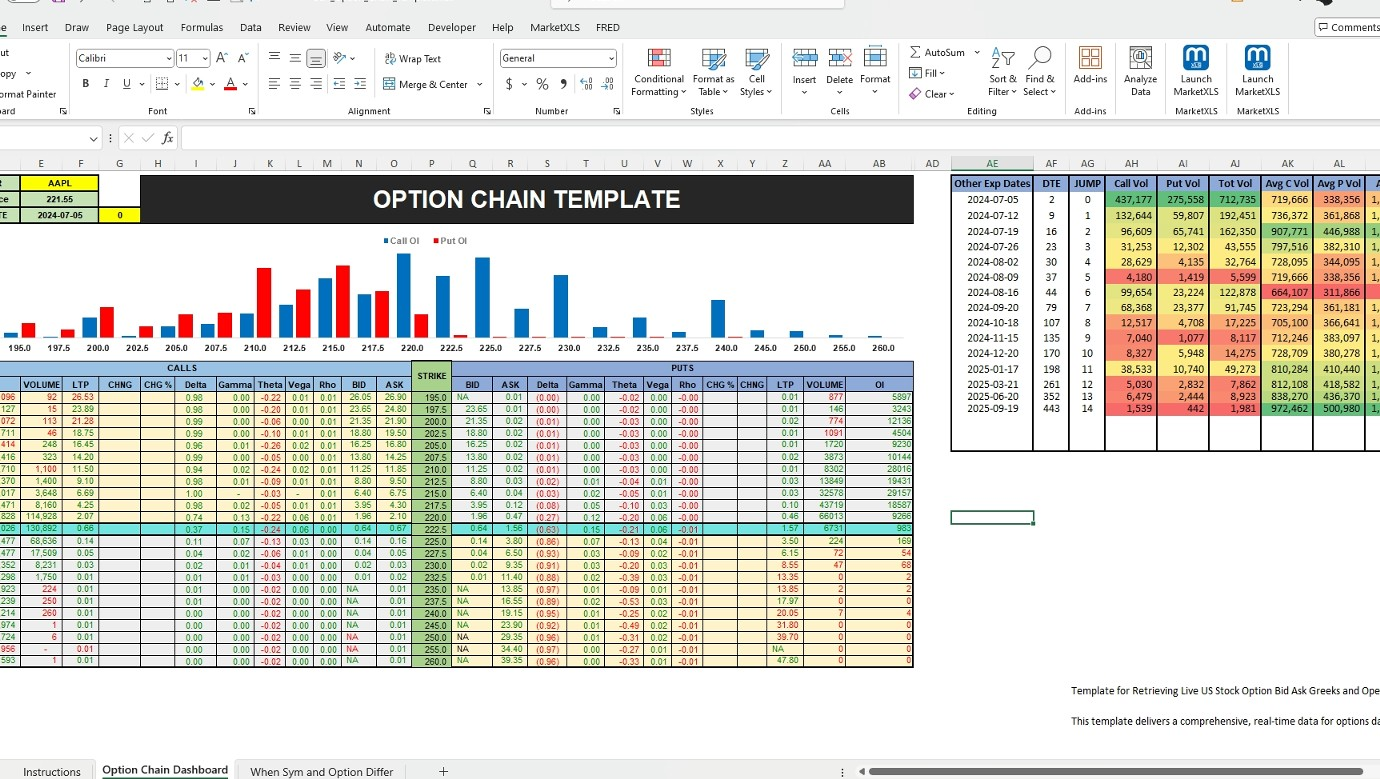
Here is the template you might want to check out MarketXLS has 100s of templates to get you started easily and save you time:
Accessing Real-Time Data on US Stock Option Bids, Greeks, Open Interest – Image
How to get Realized Volatility with MarketXLS?
Step-by-Step Guide
1. Open Excel and MarketXLS:
Ensure that MarketXLS is installed and properly integrated with your Excel application.
2. Select the Cell:
Click on the cell where you want the Realized Volatility to be displayed.
3. Enter the Function:
To get the Realized Volatility, use the StockVolatility function for the desired period (e.g., StockVolatilityFifteenDays, StockVolatilityThirtyDays, StockVolatilityOneYear, etc.).
4. Syntax:
The syntax for the function is:
=StockVolatility(Symbol)where is the number of days, months, or years for which you want to calculate the volatility, and Symbol represents the stock ticker.
For example, if you want to calculate the 15-day realized volatility for Microsoft (ticker: MSFT), you would enter:
=StockVolatilityFifteenDays("MSFT")Example:
Here is a detailed example of how to get the 15-day Realized Volatility for Microsoft:
– Formula:
=StockVolatilityFifteenDays("MSFT")– Expected Output:
This formula will provide the fifteen-day volatility of Microsoft’s stock, expressed as a percentage.
Available Functions:
MarketXLS provides several functions to calculate volatility over different periods:
– 7 Days:
=StockVolatilitySevenDays("MSFT")– 15 Days:
=StockVolatilityFifteenDays("MSFT")– 30 Days:
=StockVolatilityThirtyDays("MSFT")– 3 Months:
=StockVolatilityThreeMonths("MSFT")– 6 Months:
=StockVolatilitySixMonths("MSFT")– 1 Year:
=StockVolatilityOneYear("MSFT")– 2 Years:
=StockVolatilityTwoYears("MSFT")– 3 Years:
=StockVolatilityThreeYears("MSFT")– 5 Years:
=StockVolatilityFiveYears("MSFT")These functions calculate the stock’s price volatility for the defined period based on the closing prices and represent the daily volatility of the stock, expressed in percentage .
Here is the template you might want to checkout, it will assist you in calculating Realized Volatility:
• [Volatility Calculator – MarketXLS](https://marketxls.com/marketxls-templates/434/volatility-calculator)**
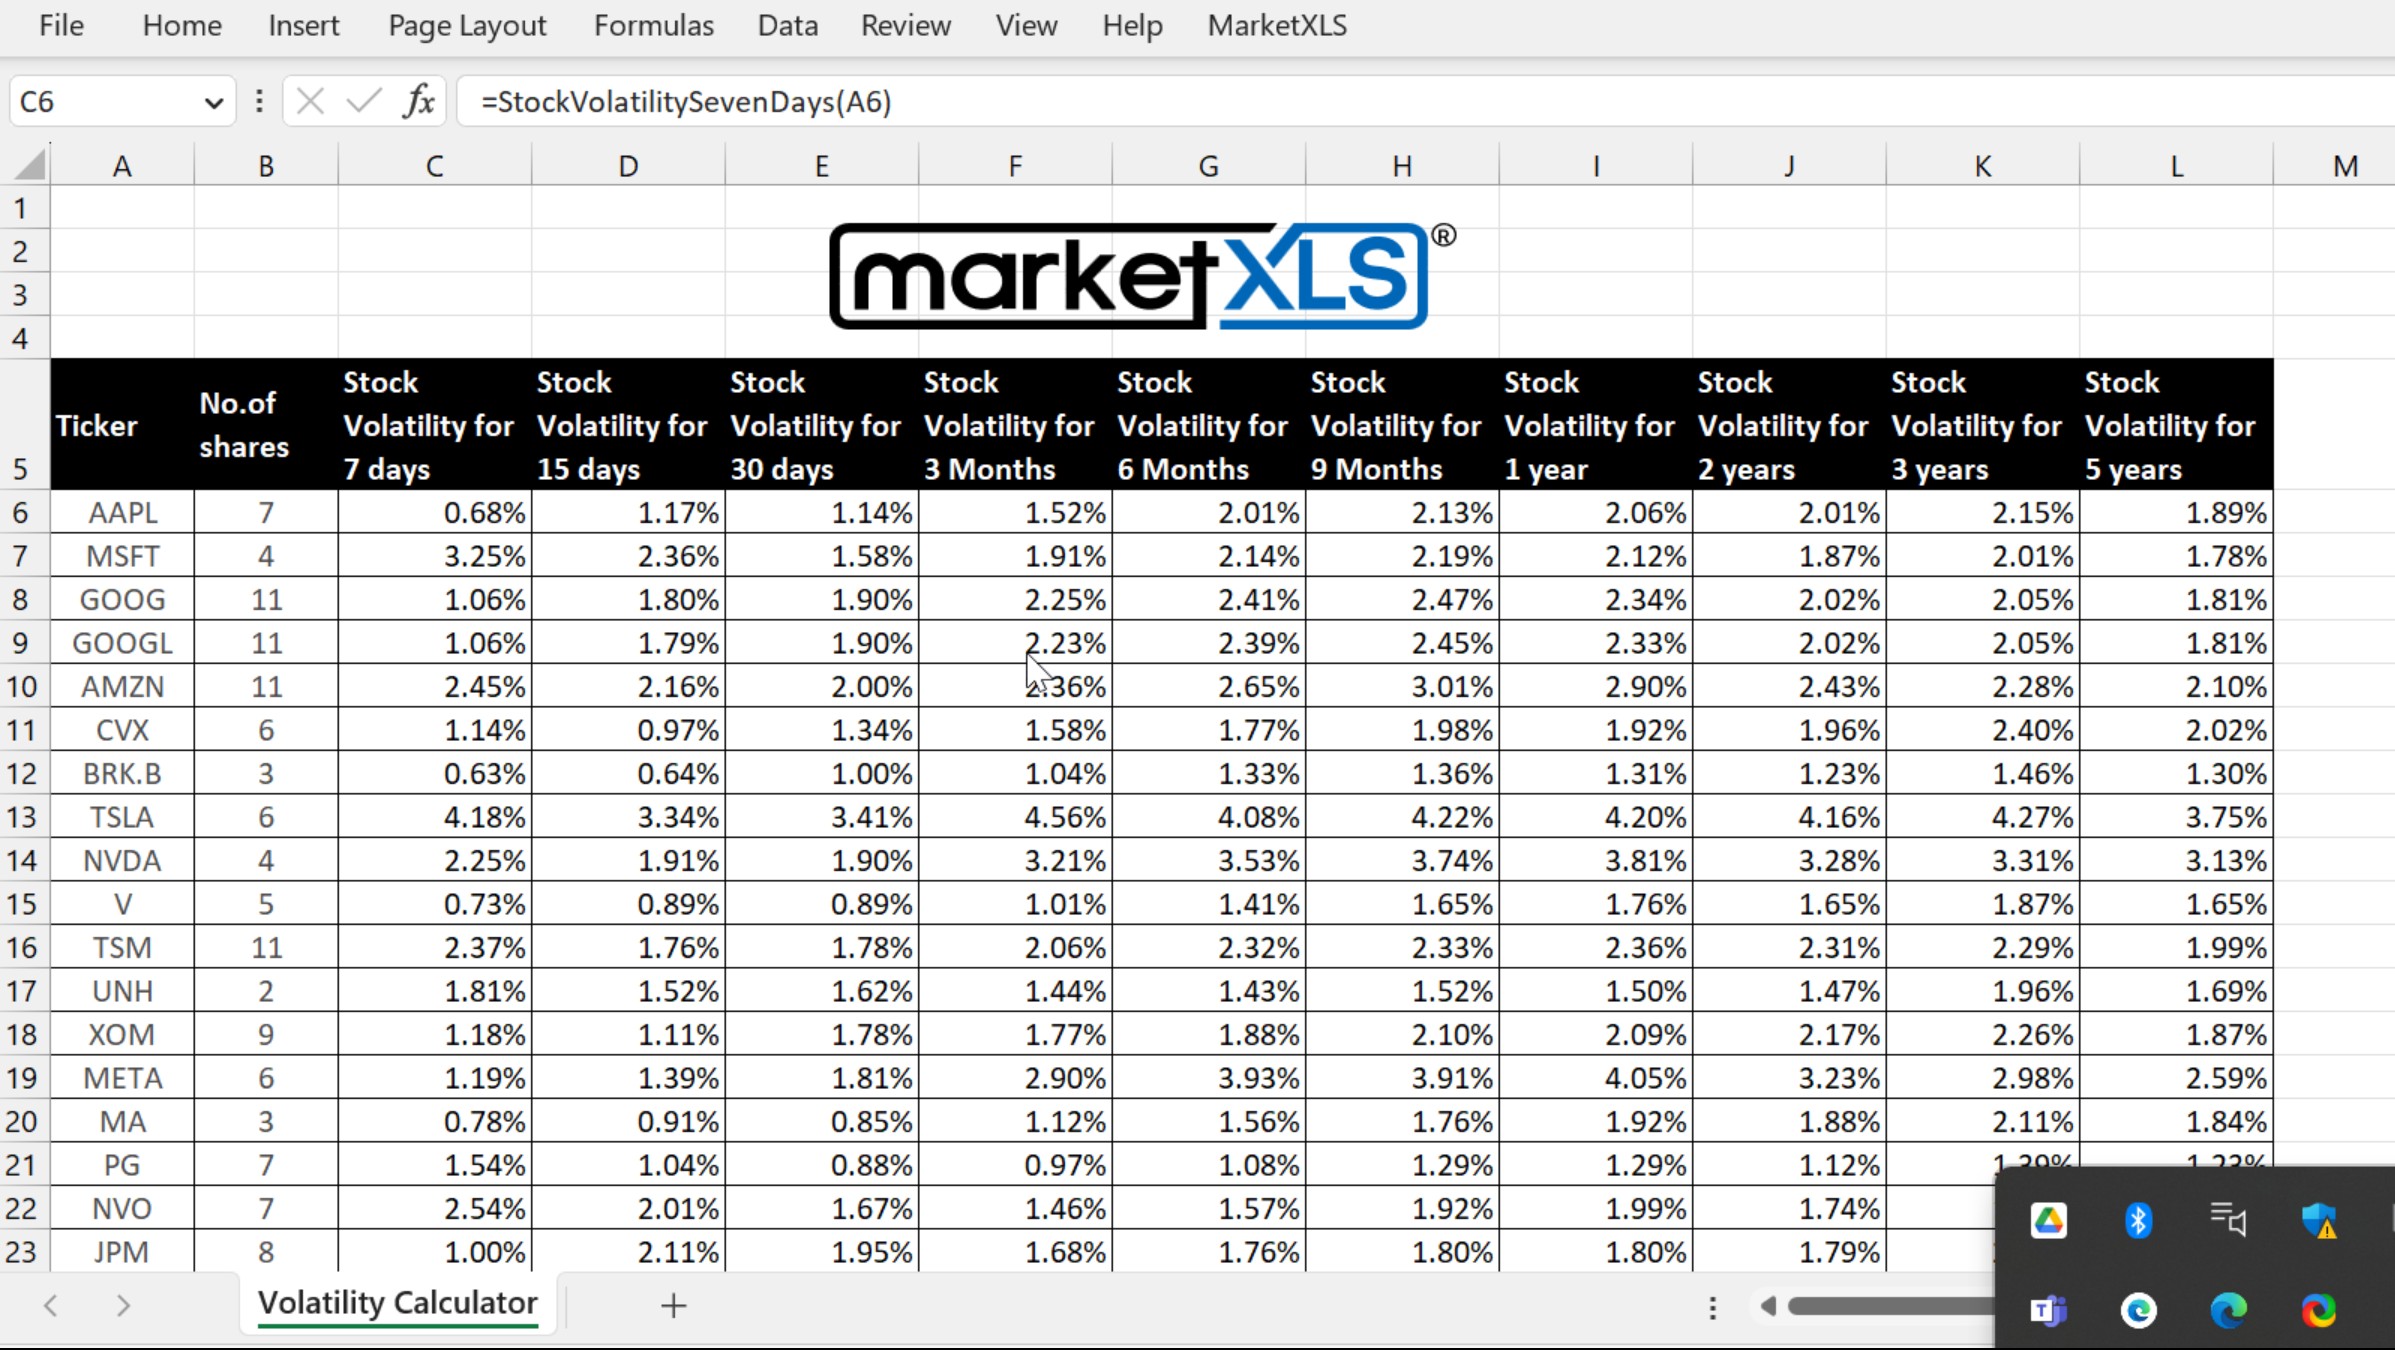
MarketXLS has 100s of templates to get you started easily and save you time.
Summary
Understanding implied volatility (IV) and realized volatility is crucial for trading decisions. IV predicts future price swings, while realized volatility analyzes past movements. IV is often higher due to market sentiment and risk premiums. The VIX index measures market expectations of future volatility. MarketXLS offers tools to track both IV and realized volatility in real-time via Excel functions, aiding traders in making informed decisions.
