

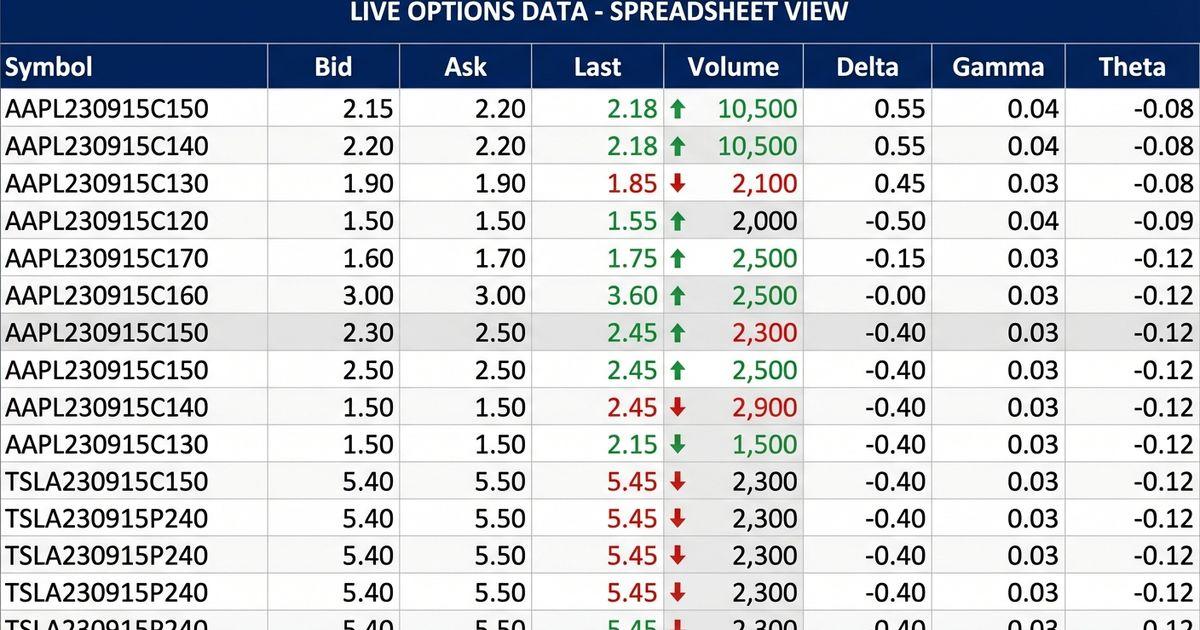
To get an option price in Excel with MarketXLS, build the contract symbol with =OptionSymbol("AAPL", "2026-06-19", "C", 200) and pass it to =QM_Last(...), =QM_Bid(...), or =QM_Ask(...). For a whole chain, use =QM_GetOptionChain("AAPL"); for theoretical value, use =BlackScholesOptionValue(...). Options data is end-of-day on the Standard plan and real-time streaming on the Advanced and Business plans. This guide covers single contracts, full chains, pricing models, strategy layouts, and common pitfalls.
Why Get Option Prices in Excel?
Options traders face a constant problem: the data is in one place (your broker's platform) and your analysis is in another (your spreadsheet). Copying option prices manually from Thinkorswim, IBKR, or Schwab into Excel is tedious, error-prone, and outdated by the time you paste it.
Getting option prices directly in Excel solves this:
- Current prices: Bid, ask, last, and mid prices update when the workbook refreshes (real-time streaming on Advanced and Business plans)
- Full option chains — Every strike and expiration in one pull
- Greeks included — Delta, gamma, theta, vega, and rho alongside prices
- Historical data — Track how option prices changed over time
- Custom analysis — Build payoff diagrams, probability models, and strategy comparisons
- No platform switching — Stay in Excel for everything
Method 1: Pull a Single Option Price in Excel
The simplest way to get an option price in Excel is to use the option symbol with a price function.
Step 1: Generate the Option Symbol
Every option contract has a standardized symbol. Use the OptionSymbol function to generate it:
=OptionSymbol("AAPL", "2026-06-19", "C", 200)
Formula documentation: OptionSymbol
This returns: @AAPL 260619C00200000
The format is: @TICKER YYMMDD[C/P]SSSSSSSSS where S is the strike price in thousandths.
Parameters:
- Symbol: Stock ticker (e.g., "AAPL")
- Expiration: Date in "YYYY-MM-DD" format
- Type: "C" for Call or "P" for Put
- Strike: Strike price (e.g., 200)
Step 2: Get the Current Option Price
Once you have the option symbol, pull the current price:
=QM_Last("@AAPL 260619C00200000")
Formula documentation: QM_Last
This returns the last traded price of that specific option contract.
Additional Price Data
=QM_Bid("@AAPL 260619C00200000")     → Current bid price
=QM_Ask("@AAPL 260619C00200000")     → Current ask price
=QM_Open("@AAPL 260619C00200000")    → Today's opening price
=QM_High("@AAPL 260619C00200000")    → Today's high
=QM_Low("@AAPL 260619C00200000")     → Today's low
=QM_Volume("@AAPL 260619C00200000")  → Today's volume
Formula documentation: QM_Bid, QM_Ask, QM_Open, QM_High, QM_Low, QM_Volume
Streaming Real-Time Option Prices
For continuously updating prices during market hours:
=QM_Stream_Last("@AAPL 260619C00200000")
Formula documentation: QM_Stream_Last
QM_Stream_Last updates automatically while streaming is on. Real-time options streaming requires the Advanced or Business plan, each streamed contract uses one live symbol subscription, and options tracking is limited to 300 symbols.
Method 2: Pull the Entire Option Chain
Instead of looking up individual contracts, pull the complete option chain for any stock:
Full Option Chain
=QM_GetOptionChain("AAPL")
Formula documentation: QM_GetOptionChain
This returns every available strike and expiration for AAPL, including calls and puts, with bid, ask, last price, volume, and open interest.
Filtered Option Chains
MarketXLS provides specialized functions to pull exactly the options you need:
=QM_GetOptionChainActive("AAPL")              → Most actively traded options
=QM_GetOptionChainAtTheMoney("AAPL")          → ATM strikes only
=QM_GetOptionChainInTheMoney("AAPL")          → ITM options only
=QM_GetOptionChainOutOfTheMoney("AAPL")       → OTM options only
=QM_GetOptionChainWeeklies("AAPL")            → Weekly expirations
=QM_GetOptionChainMonthlies("AAPL")           → Monthly expirations
=QM_GetOptionChainQuarterlies("AAPL")         → Quarterly expirations
=QM_GetOptionChainNearTerm("AAPL")            → Nearest expiration
Formula documentation: QM_GetOptionChainActive, QM_GetOptionChainAtTheMoney, QM_GetOptionChainInTheMoney, QM_GetOptionChainOutOfTheMoney, QM_GetOptionChainWeeklies, QM_GetOptionChainMonthlies, QM_GetOptionChainQuarterlies, QM_GetOptionChainNearTerm
Option Chain with Greeks
For the complete picture — prices plus all Greeks in one pull:
=QM_GetOptionQuotesAndGreeks("AAPL")
Formula documentation: QM_GetOptionQuotesAndGreeks
This returns the full option chain with delta, gamma, theta, vega, implied volatility, bid, ask, last, volume, and open interest for every contract. This single function replaces what would take dozens of manual lookups.
Dynamic Option Chains
For auto-expanding data that updates as new strikes become available:
=QM_GetOptionChainDynamic("AAPL")
=QM_GetOptionChainActiveDynamic("AAPL")
=QM_GetOptionQuotesAndGreeksDynamic("AAPL")
Formula documentation: QM_GetOptionChainDynamic, QM_GetOptionChainActiveDynamic, QM_GetOptionQuotesAndGreeksDynamic
Dynamic functions automatically resize their output range when the data changes — useful for monitoring chains where new strikes get listed.
Method 3: Black-Scholes Option Pricing in Excel
If you want to calculate theoretical option prices rather than pull market prices, MarketXLS includes built-in pricing models:
Black-Scholes Model
=BlackScholesOptionValue("AAPL", "2026-06-19", "C", 200)
Formula documentation: BlackScholesOptionValue
This calculates the theoretical fair value of an AAPL $200 call expiring June 19, 2026 using the Black-Scholes model. The function automatically pulls the current stock price, risk-free rate, and implied volatility.
Black-Scholes with Custom Inputs
For full control over every input parameter:
=BlackScholesOptionValueWithUserInputs(StockPrice, Strike, TimeToExpiry, RiskFreeRate, Volatility, "C")
Formula documentation: BlackScholesOptionValueWithUserInputs
This lets you set your own assumptions for each variable — useful for scenario analysis and sensitivity testing.
Other Pricing Models
MarketXLS supports multiple option pricing models:
=AmericanOptionValue("AAPL", "2026-06-19", "C", 200)    → American-style pricing (early exercise)
=Black76OptionValue(FuturesPrice, Strike, Time, Rate, Vol, "C")  → Futures options (Black-76)
=BachelierOptionValue(Price, Strike, Time, Rate, Vol, "C")       → Bachelier model (normal distribution)
=HestonOptionValue(...)                                          → Stochastic volatility model
Formula documentation: AmericanOptionValue, Black76OptionValue, BachelierOptionValue, HestonOptionValue
Model Comparison Table
| Model | Best For | Handles Early Exercise? | Complexity |
|---|---|---|---|
| Black-Scholes | European options, quick estimates | No | Low |
| American Option Value | US equity options | Yes | Medium |
| Black-76 | Futures options, interest rate options | No | Low |
| Bachelier | Low-priced options, negative rates | No | Low |
| Heston | Volatility smile modeling | Optional | High |
Building an Options Pricing Spreadsheet
Here is how to build a complete options analysis spreadsheet from scratch:
Holdings Table
| Column | Formula | Purpose |
|---|---|---|
| A: Ticker | AAPL | Stock symbol |
| B: Strike | 200 | Strike price |
| C: Expiry | 2026-06-19 | Expiration date |
| D: Type | C | Call or Put |
| E: Symbol | =OptionSymbol(A2, C2, D2, B2) | Option symbol |
| F: Last | =QM_Last(E2) | Current price |
| G: Bid | =QM_Bid(E2) | Bid price |
| H: Ask | =QM_Ask(E2) | Ask price |
| I: Volume | =QM_Volume(E2) | Today's volume |
| J: Stock Price | =Last(A2) | Underlying price |
| K: Fair Value | =BlackScholesOptionValue(A2, C2, D2, B2) | Theoretical price |
| L: Mispricing | =F2 - K2 | Market vs model |
Greeks Dashboard
Add Greek columns to assess risk:
=QM_GetOptionQuotesAndGreeks("AAPL")
Formula documentation: QM_GetOptionQuotesAndGreeks
This single function populates an entire table with delta, gamma, theta, vega, and implied volatility for every contract in the chain.
Implied Volatility Analysis
Compare market-implied volatility against your forecast:
| Strike | Market IV | Your Forecast | Overpriced? |
|---|---|---|---|
| $190 | From chain | Your estimate | =IF(MarketIV > Forecast, "YES", "NO") |
| $200 | From chain | Your estimate | Formula |
| $210 | From chain | Your estimate | Formula |
Unusual Options Activity Scanner
Use MarketXLS's built-in scanners to find unusual options activity:
=OPT_UnusualOptionVolScanEOD()          → Unusual volume scan (end of day)
=OPT_UnusualOptionVolOIScanEOD()        → Unusual volume + OI scan
=OPT_UnusualStockOptionsActivity()      → Unusual stock options activity
=OPT_OptionsVolumeLeaders()                → Options volume leaders
=OPT_OptionsOILeaders()                 → Open interest leaders
=OPT_OptionsChangeInOILeaders()         → Biggest OI changes
=OPT_OptionsChangeInVolumeLeaders()     → Biggest volume changes
Formula documentation: OPT_UnusualOptionVolScanEOD, OPT_UnusualOptionVolOIScanEOD, OPT_UnusualStockOptionsActivity, OPT_OptionsVolumeLeaders, OPT_OptionsOILeaders, OPT_OptionsChangeInOILeaders, OPT_OptionsChangeInVolumeLeaders
The EOD scanners use end-of-day data. They flag contracts with volume or open interest well above normal, which you can then research further.
Options Strategy Analysis in Excel
Covered Call Analysis
Stock Price:      =Last("AAPL")
Call Premium:     =QM_Last("@AAPL 260619C00200000")
Cost Basis:       Your purchase price
Max Profit:       =(Strike - CostBasis) + CallPremium
Downside Buffer:  =CallPremium / Last("AAPL")
Formula documentation: Last, QM_Last
Spread Analysis
For vertical spreads, pull both legs:
Long Leg:    =QM_Last("@AAPL 260619C00190000")
Short Leg:   =QM_Last("@AAPL 260619C00200000")
Net Debit:   =LongLeg - ShortLeg
Max Profit:  =(200 - 190) - NetDebit
Max Loss:    =NetDebit
Risk/Reward: =MaxProfit / MaxLoss
Formula documentation: QM_Last
Iron Condor Setup
| Leg | Strike | Type | Price | Action |
|---|---|---|---|---|
| Put Buy | $180 | P | =QM_Last("@AAPL 260619P00180000") | Buy |
| Put Sell | $185 | P | =QM_Last("@AAPL 260619P00185000") | Sell |
| Call Sell | $210 | C | =QM_Last("@AAPL 260619C00210000") | Sell |
| Call Buy | $215 | C | =QM_Last("@AAPL 260619C00215000") | Buy |
| Net Credit | Formula |
SPX and Index Options in Excel
Index options like SPX are popular for their tax advantages (60/40 treatment) and cash settlement. Pull SPX option data the same way:
=QM_GetOptionChain("^SPX")
=QM_GetOptionQuotesAndGreeks("^SPX")
Formula documentation: QM_GetOptionChain, QM_GetOptionQuotesAndGreeks
Use ^SPX as the symbol for S&P 500 index options.
SPX vs SPY Option Price Comparison
| Feature | SPX Options | SPY Options |
|---|---|---|
| Settlement | Cash | Physical delivery |
| Size | 10x SPY | Standard |
| Exercise | European | American |
| Tax treatment | 60/40 | Short/long term |
| Chain function | =QM_GetOptionChain("^SPX") | =QM_GetOptionChain("SPY") |
Historical Option Price Data
Track how option prices have changed over time:
=GetHistory("@AAPL 260619C00200000", "2026-01-01", "2026-03-12", "daily")
Formula documentation: GetHistory
This returns a full daily price history for a specific option contract — essential for backtesting strategies and analyzing how options respond to market events.
Option Price in Excel vs. Other Methods
| Method | Real-Time? | Greeks? | Pricing Models? | Full Chain? | Cost |
|---|---|---|---|---|---|
| Excel + MarketXLS | Advanced and Business plans (Standard: end-of-day options) | Yes | 5 models | Yes | From $70/month billed annually |
| Copy from broker | No (manual) | Partial | No | No | Free |
| GOOGLEFINANCE | No | No | No | No | Free |
| Bloomberg Terminal | Yes | Yes | Yes | Yes | $24,000/year |
| Thinkorswim export | Delayed | Partial | No | Yes | Free with account |
| Python scripts | Depends | DIY | DIY | DIY | Free + time |
Building a Real-Time Options Monitor
Combine the functions above into a complete real-time options monitoring dashboard:
Position Monitor Layout
Create a spreadsheet with your active options positions:
| Position | Symbol | Entry Price | Current | P&L | P&L % | Delta | Theta | DTE |
|---|---|---|---|---|---|---|---|---|
| AAPL 200C Jun | =OptionSymbol("AAPL","2026-06-19","C",200) | $8.50 | =QM_Last(B2) | =D2-C2 | =(D2-C2)/C2 | From Greeks | From Greeks | ="2026-06-19"-TODAY() |
| MSFT 420P Jul | =OptionSymbol("MSFT","2026-07-17","P",420) | $12.30 | =QM_Last(B3) | =D3-C3 | =(D3-C3)/C3 | From Greeks | From Greeks | ="2026-07-17"-TODAY() |
Portfolio Greeks Summary
Track your aggregate Greek exposure across all positions:
Total Delta:  Sum of (Position Delta × Contracts × 100)
Total Theta:  Sum of (Position Theta × Contracts × 100)
Total Vega:   Sum of (Position Vega × Contracts × 100)
This tells you at a glance how your entire options portfolio responds to market movements (delta), time decay (theta), and volatility changes (vega).
Alert System
Set up conditional formatting rules to flag positions that need attention:
- Red highlight — Position down more than 50% (potential total loss)
- Yellow highlight — Less than 7 DTE (expiration approaching)
- Green highlight — Position up more than 100% (consider taking profits)
- Bold — Unusual volume on your positions (smart money moving)
Watchlist for New Trades
Use the unusual activity scanners to populate a watchlist:
=OPT_UnusualOptionVolScanEOD()
Formula documentation: OPT_UnusualOptionVolScanEOD
Review this daily to see which contracts had unusual volume. Combine with =IsOptionable("AAPL") to verify a stock has listed options before building strategies around it.
Common Pitfalls When Getting Option Prices in Excel
1. Wrong Symbol Format
Option symbols follow a strict format: @TICKER YYMMDD[C/P]SSSSSSSSS
Use =OptionSymbol() to avoid formatting errors. Do not try to type option symbols manually — the strike price needs to be in thousandths (e.g., a $200 strike is 00200000).
2. Expired Options Return No Data
If you request a price for an expired option, you will get no data. Always check that your expiration date is in the future for live price queries. For historical prices of expired contracts, use =GetHistory().
3. Low Liquidity Options Have Wide Spreads
Options with low volume may show a last price that is far from the current market. Always check both bid and ask:
Mid Price = (QM_Bid + QM_Ask) / 2
Formula documentation: QM_Bid, QM_Ask
The mid price is a better estimate of fair value for illiquid options.
4. After-Hours Data
Option prices do not update outside of market hours (9:30 AM – 4:00 PM ET). Prices shown after hours reflect the last traded price from the regular session.
5. Index Options Use Different Symbols
Index options like SPX use a caret prefix: ^SPX. Do not use SPX without the caret — that will return no data or incorrect data. Always use =QM_GetOptionChain("^SPX") for index option chains.
6. Checking If a Stock Has Options
Not every stock has listed options. Before building a strategy, verify the stock is optionable:
=IsOptionable("AAPL")
Formula documentation: IsOptionable
This returns TRUE or FALSE, saving you from generating option symbols for stocks that do not have any listed options contracts available for trading.
Frequently Asked Questions
How do I get live option prices in Excel without VBA?
Install MarketXLS and use =QM_Last("@AAPL 260619C00200000") to pull an option's price. No VBA or API coding is required. For streaming updates, use =QM_Stream_Last() (real-time options streaming requires the Advanced or Business plan; Standard provides end-of-day options data). On Mac or Excel for the web, the Microsoft 365 add-in uses the mxls. prefix, and some functions differ by platform (check /formulas).
Can I pull an entire option chain into Excel with one formula?
Yes. Use =QM_GetOptionChain("AAPL") to pull the complete option chain for any stock. This returns every strike, expiration, bid, ask, last price, volume, and open interest. For chains with Greeks included, use =QM_GetOptionQuotesAndGreeks("AAPL").
How do I calculate Black-Scholes option price in Excel?
Use =BlackScholesOptionValue("AAPL", "2026-06-19", "C", 200) for automatic calculation using live market data. For manual inputs, use =BlackScholesOptionValueWithUserInputs(StockPrice, Strike, TimeToExpiry, RiskFreeRate, Volatility, "C"). MarketXLS also supports American, Black-76, Bachelier, and Heston pricing models.
What is the option symbol format for Excel?
The standardized format is @TICKER YYMMDD[C/P]SSSSSSSSS. For example, an AAPL $200 call expiring June 19, 2026 is @AAPL 260619C00200000. Use =OptionSymbol("AAPL", "2026-06-19", "C", 200) to generate symbols automatically instead of formatting them manually.
Can I get option prices for SPX index options in Excel?
Yes. Use ^SPX as the ticker symbol: =QM_GetOptionChain("^SPX") for the full chain or =QM_Last("@SPX ...") for individual contracts. MarketXLS supports all major index options including SPX, NDX, RUT, and VIX.
How do I find unusual options activity in Excel?
Use the built-in scanners: =OPT_UnusualOptionVolScanEOD() for unusual volume, =OPT_UnusualStockOptionsActivity() for unusual activity, and =OPT_OptionsVolumeLeaders() for volume leaders. The EOD scanners reflect end-of-day data.
Start Getting Option Prices in Excel Today
MarketXLS puts option prices, chains, Greeks, and pricing models into spreadsheet cells with typed formulas, from a single quote with =QM_Last() to a full chain with =QM_GetOptionChain(). US plans start at $70/month billed annually (Standard, end-of-day options); real-time options streaming is included on Advanced ($125/month annually) and Business ($200/month annually). See pricing, the options data setup guide, or book a demo.
