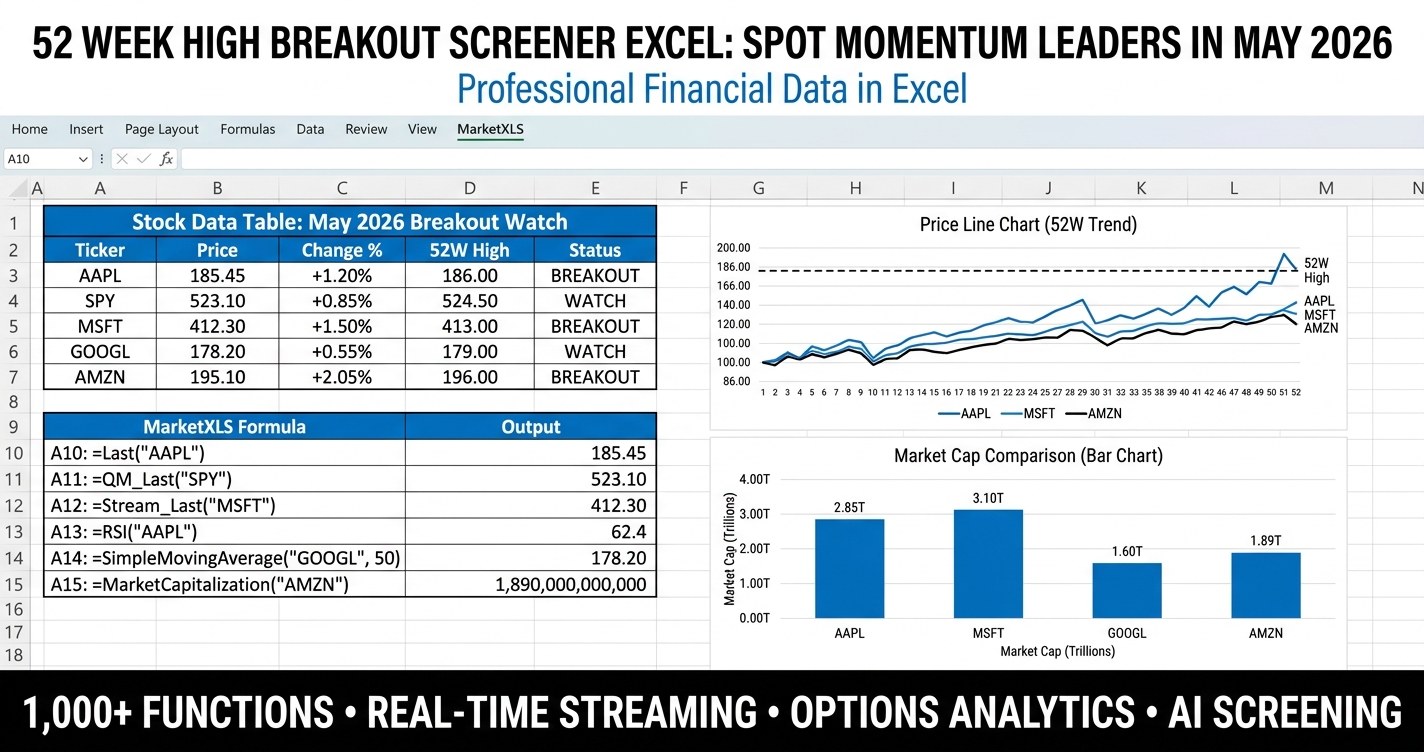
52 week high breakout screener excel - build a rules-based momentum watchlist that surfaces stocks pressing their 52-week highs with volume, RSI, and trend confirmation, powered by live MarketXLS formulas.
Technical Analysis
Expert insights on stock market analysis, investment strategies, and Excel techniques for smarter investing.
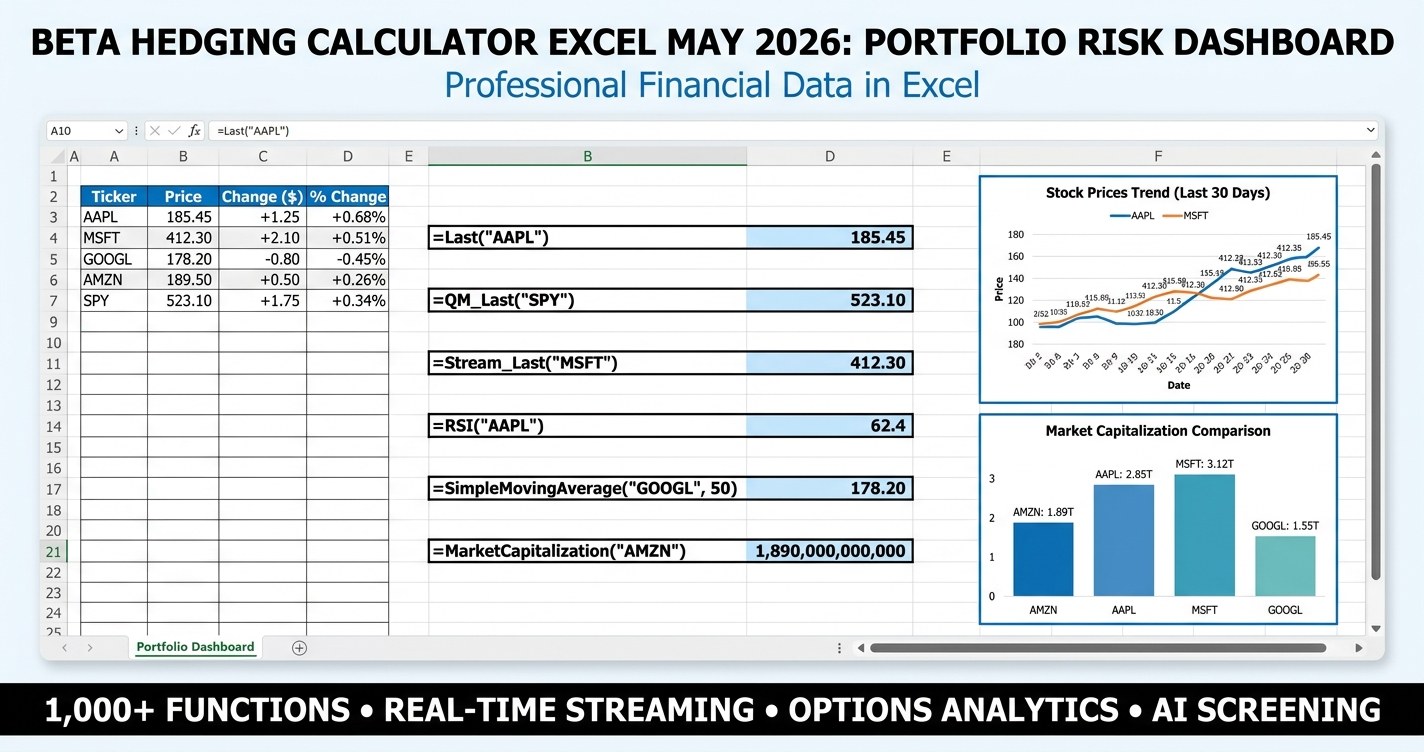
Beta hedging calculator excel - download a premium May 2026 portfolio risk dashboard that computes weighted portfolio beta, sizes the SPY/QQQ/IWM hedge in shares or put contracts, and runs scenario P&L unhedged vs hedged with live MarketXLS formulas.
52 week high breakout screener excel - build a rules-based momentum watchlist that surfaces stocks pressing their 52-week highs with volume, RSI, and trend confirmation, powered by live MarketXLS formulas.
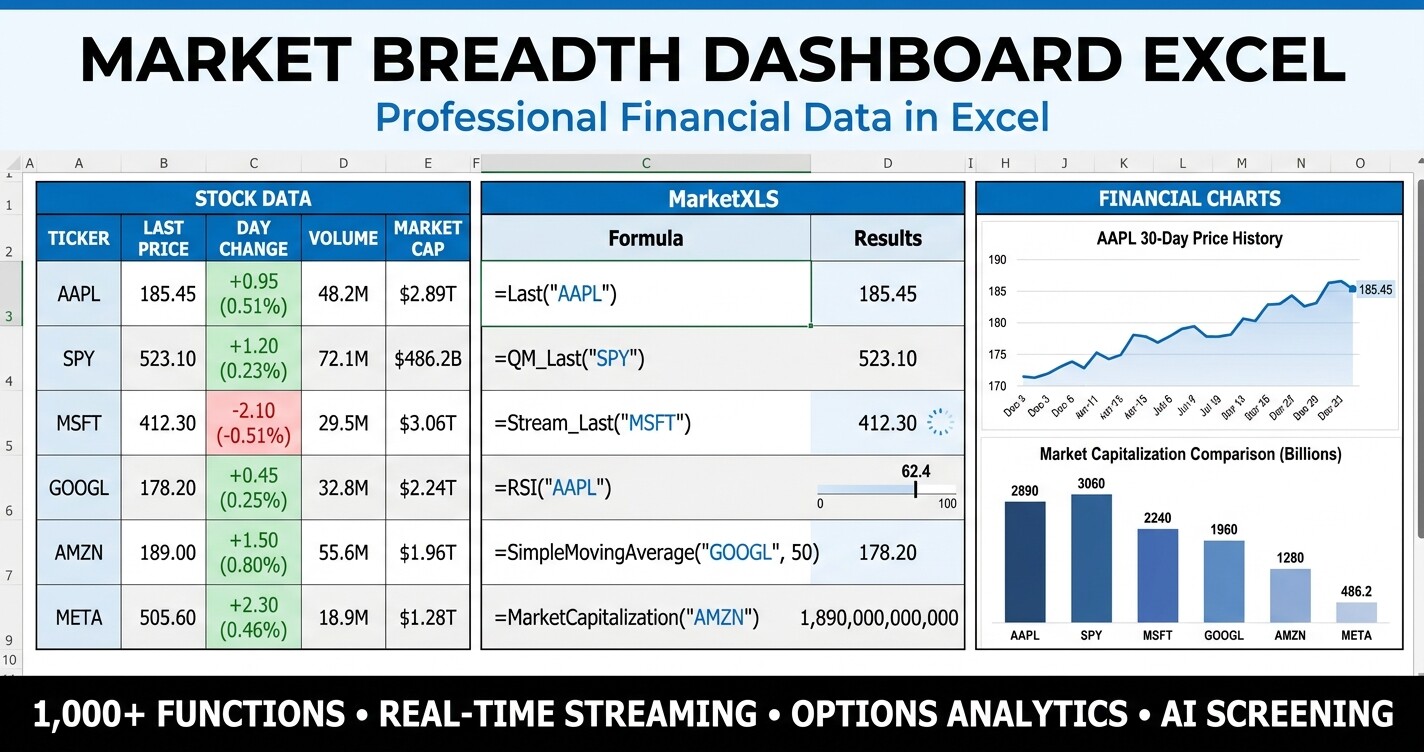
Market breadth dashboard Excel - track percent of stocks above the 50/200-day moving average, advance-decline counts, 52-week highs and lows, RSI distribution, and sector breadth in one premium workbook.
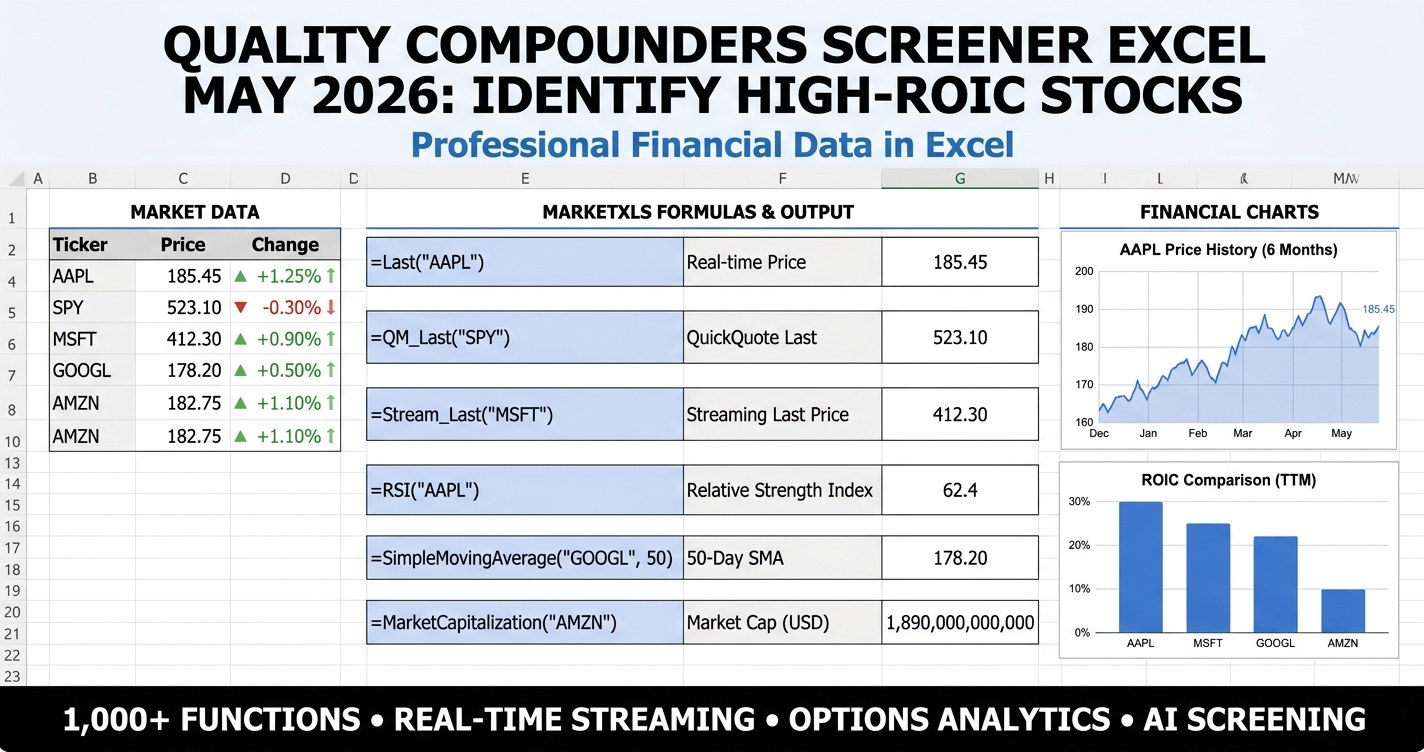
Quality compounders screener excel - download a May 2026 template that ranks 20 large-cap candidates on six compounder pillars (ROIC, ROE, operating margin, debt-to-equity, revenue growth, free cash flow) and surfaces high-conviction picks via a live MarketXLS scoring engine.
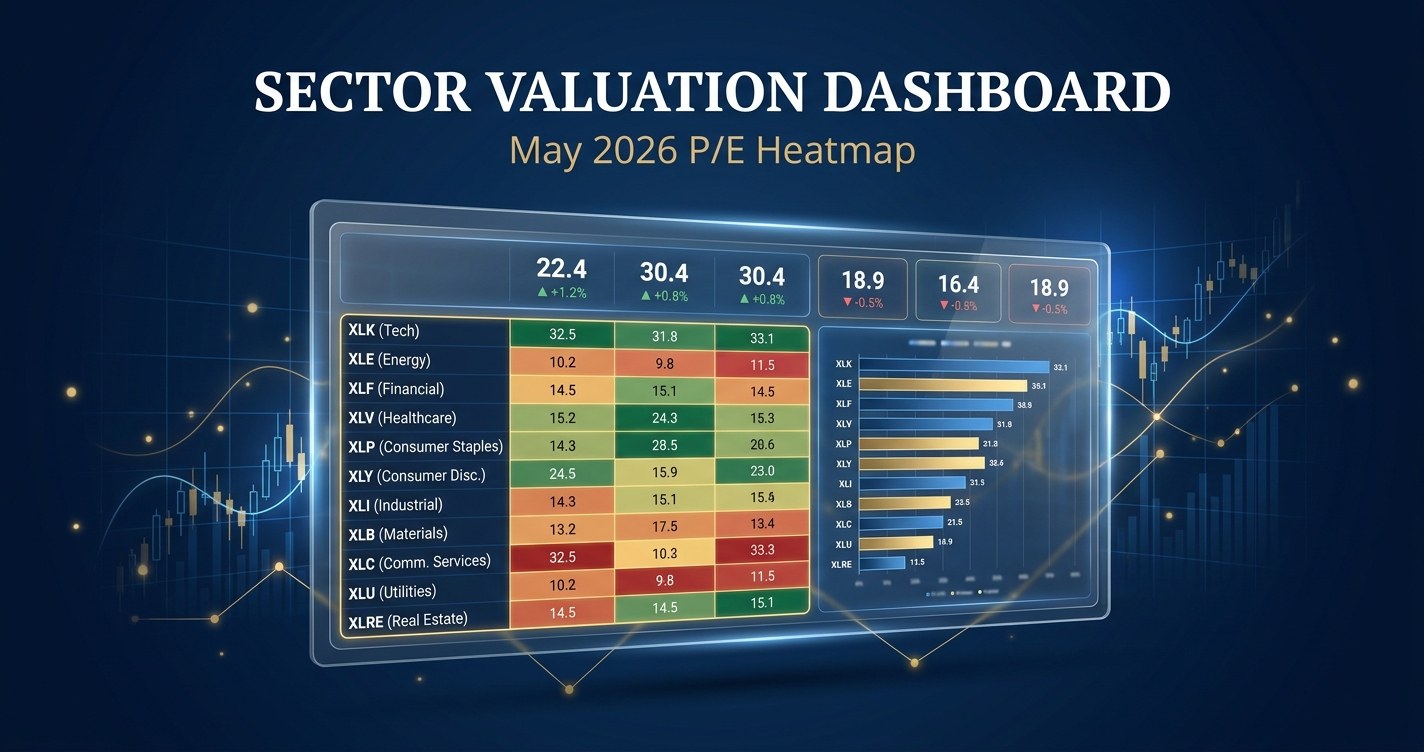
Sector valuation dashboard Excel template for May 2026 - dashboard-style heatmap of S&P 500 sector P/E ratios, premium-discount vs 5-year averages, KPI tiles, scenario analysis, and live MarketXLS formulas across all 11 GICS sectors.
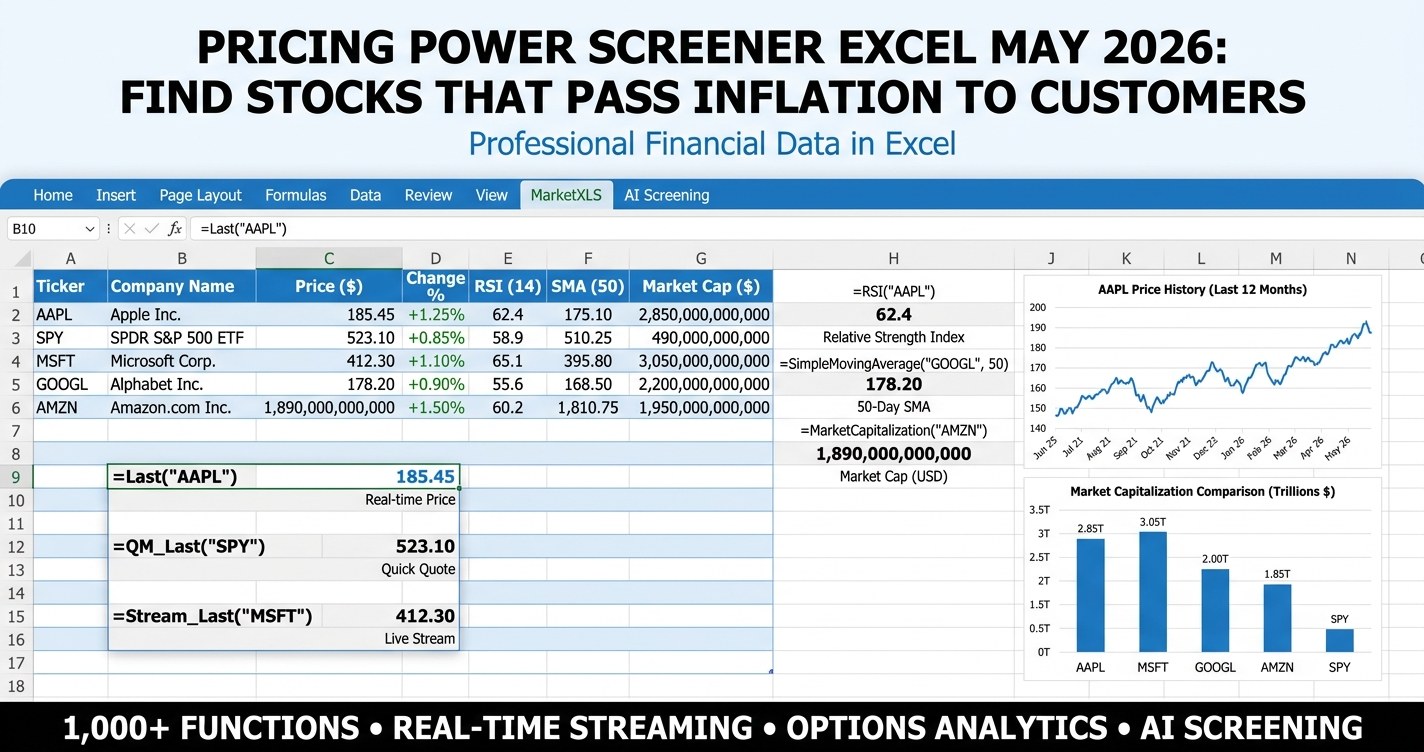
Pricing power screener Excel template that ranks 28 large-cap candidates on gross margin, operating margin, revenue growth, and ROE, with a composite Pricing Power Score for May 2026.
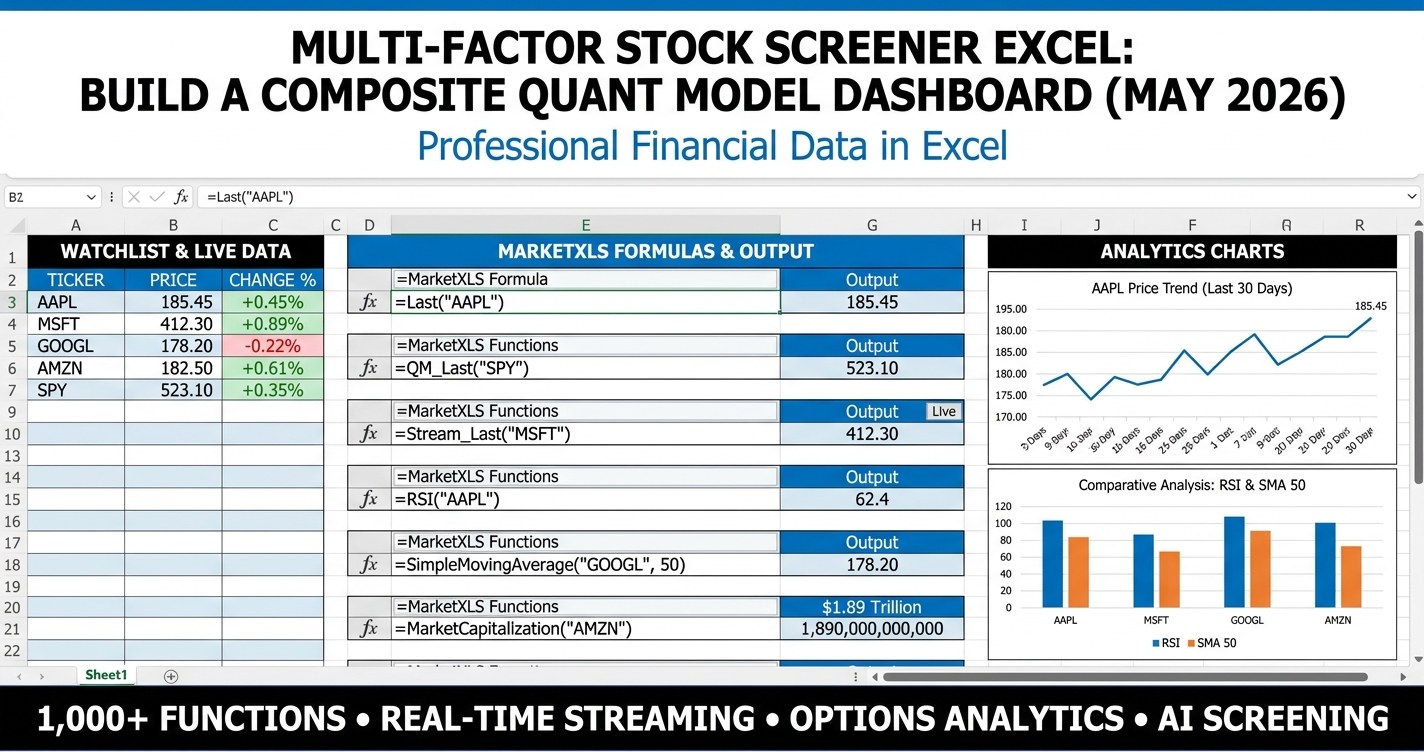
Multi-factor stock screener Excel template with composite scoring across value, quality, momentum, low volatility, and growth - dashboard-style with KPI tiles, charts, and live MarketXLS formulas.
Retail earnings tracker excel - download a Q1 2026 watchlist for Walmart, Home Depot, Lowe's, Target, Costco, TJX, Best Buy, and Dollar General with live MarketXLS formulas, scenario analysis, and a position-sizing model that updates automatically.
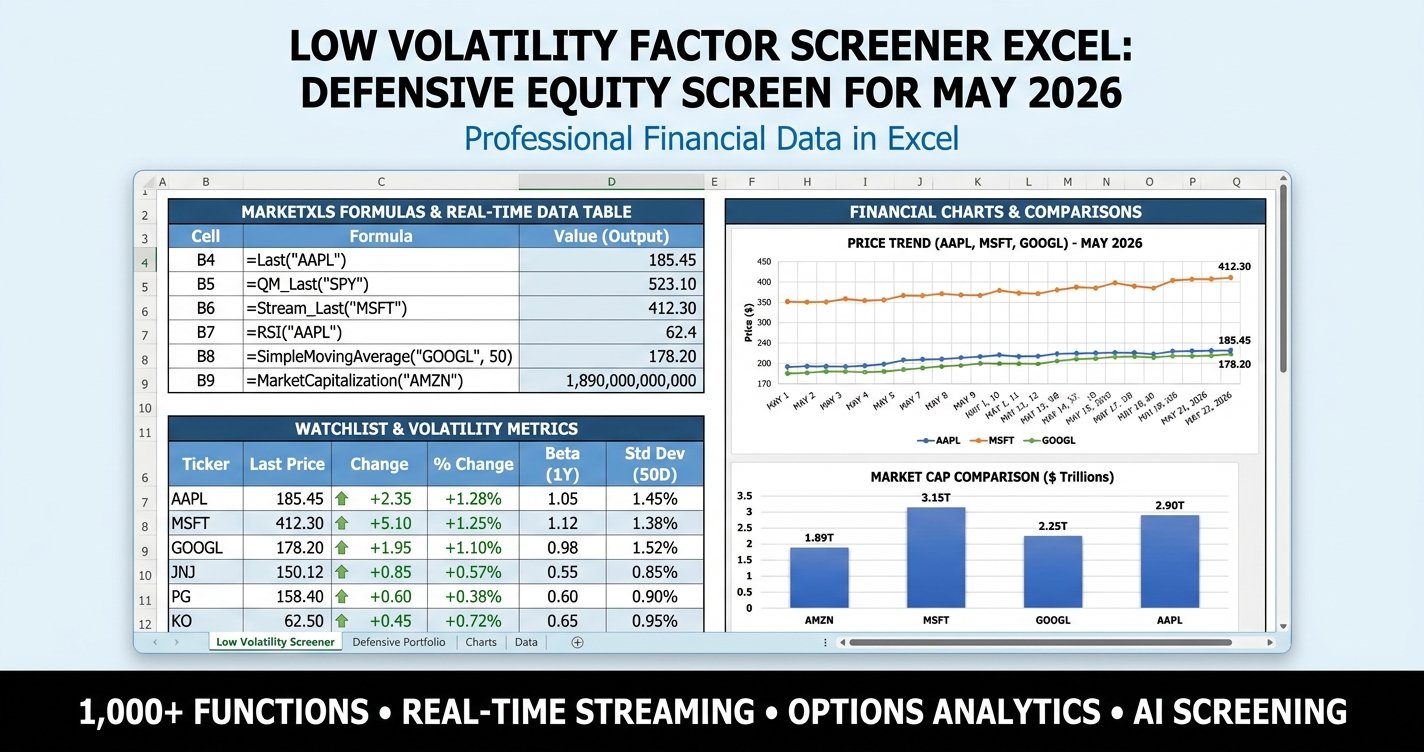
Low volatility factor screener Excel template that ranks 28 defensive large caps on beta, implied volatility, realized volatility, drawdowns, and a composite Defensive Score for May 2026.
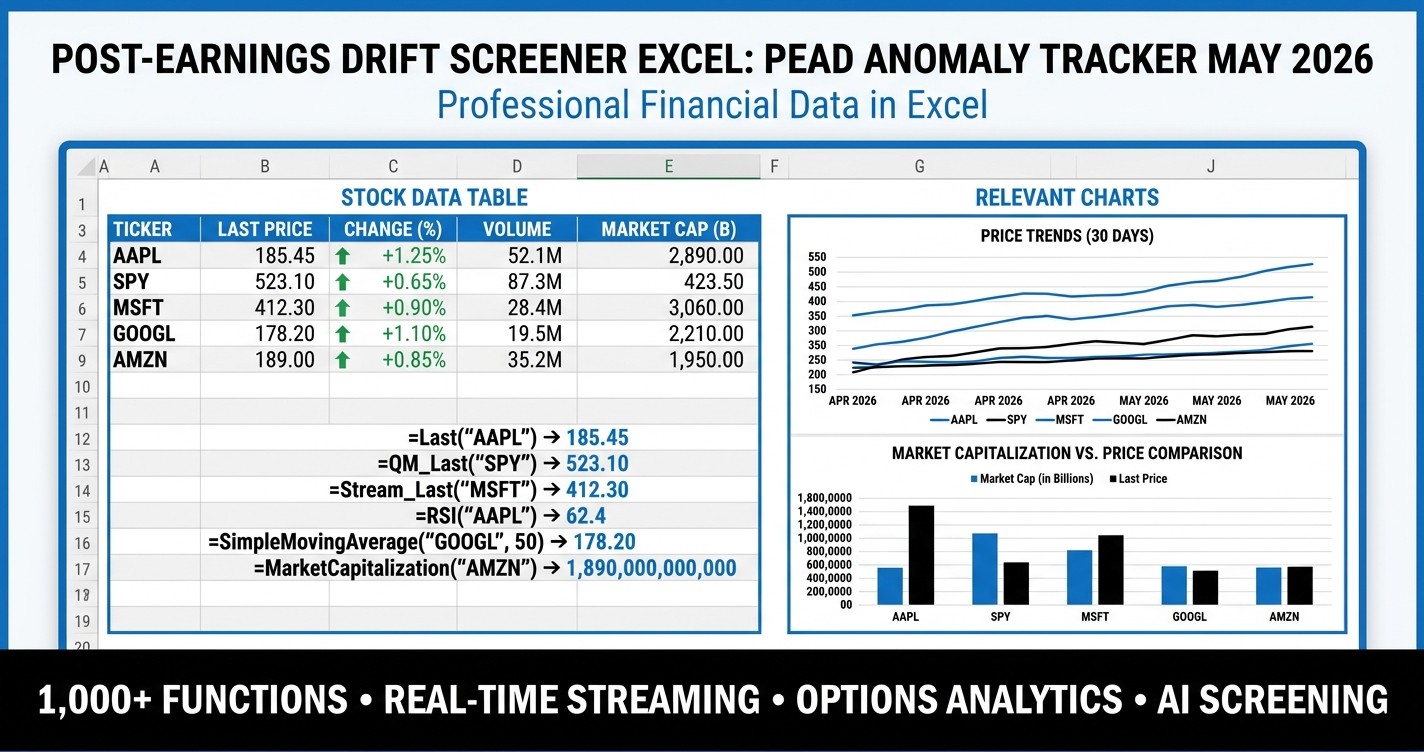
Post-earnings drift screener Excel template for the Q1 2026 reporting season. Rank S&P 500 names by EPS surprise size, confirm the drift with month-to-date returns and momentum filters, and size positions inside one MarketXLS workbook.
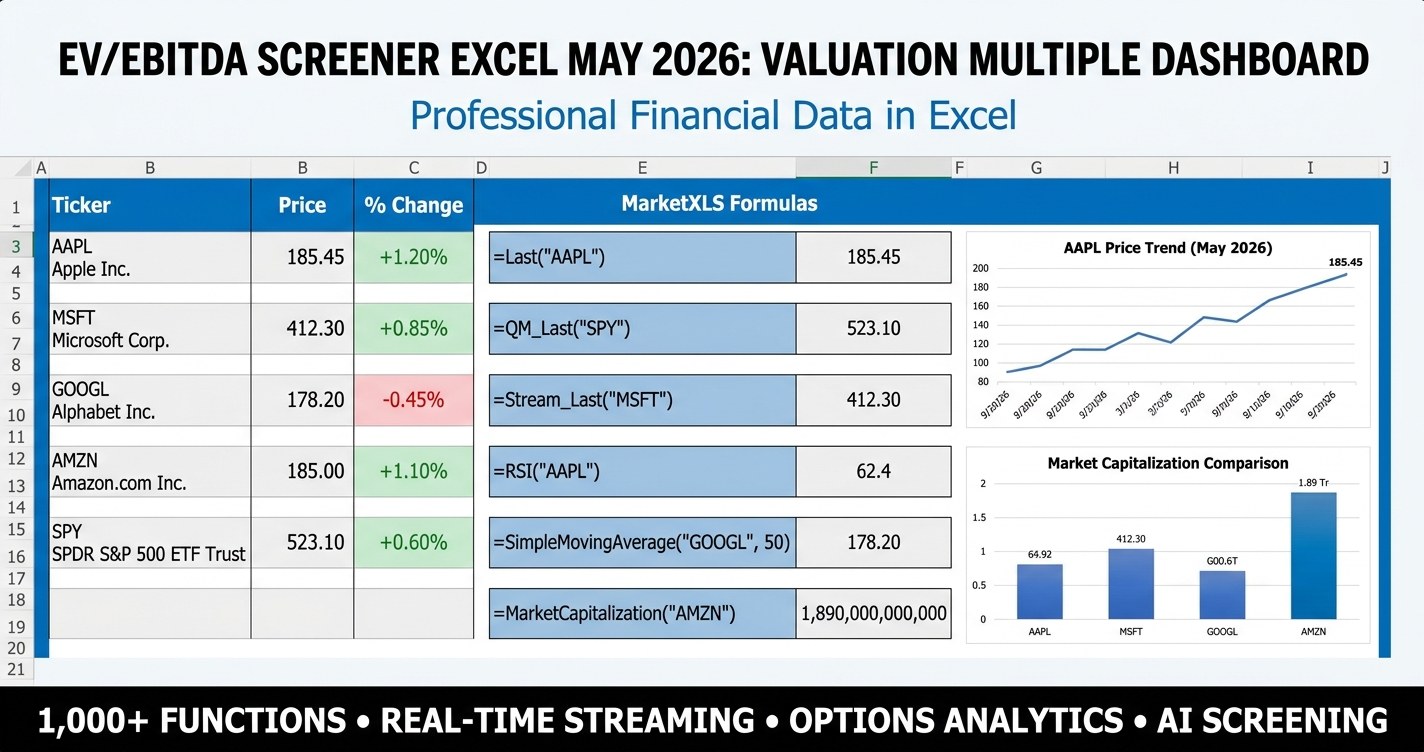
EV/EBITDA screener Excel for May 2026 - a premium dashboard that ranks 28 large caps by enterprise multiple, sector fair-value bands, and quality tilt with live MarketXLS formulas.
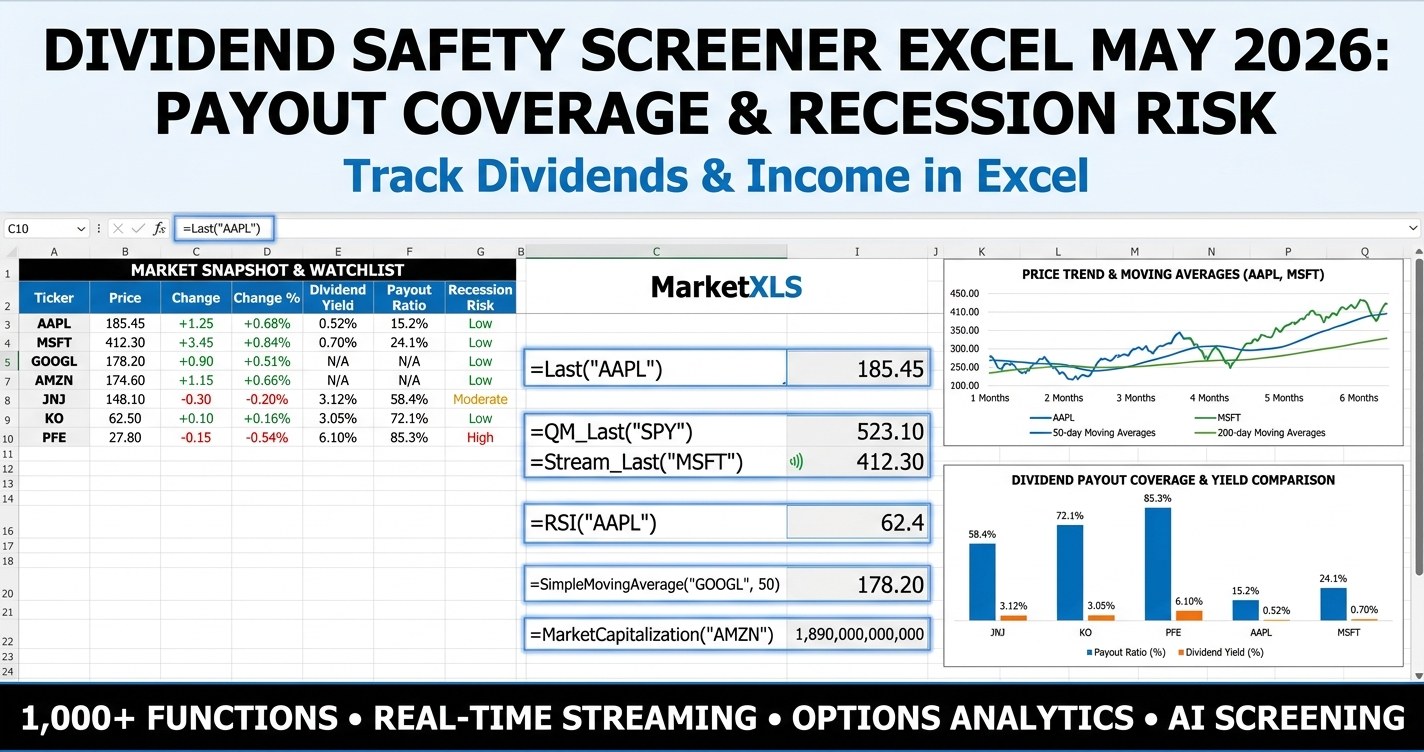
Dividend safety screener Excel template that ranks 24 dividend payers on payout ratio, free cash flow coverage, debt, and a composite Safety Score for May 2026.
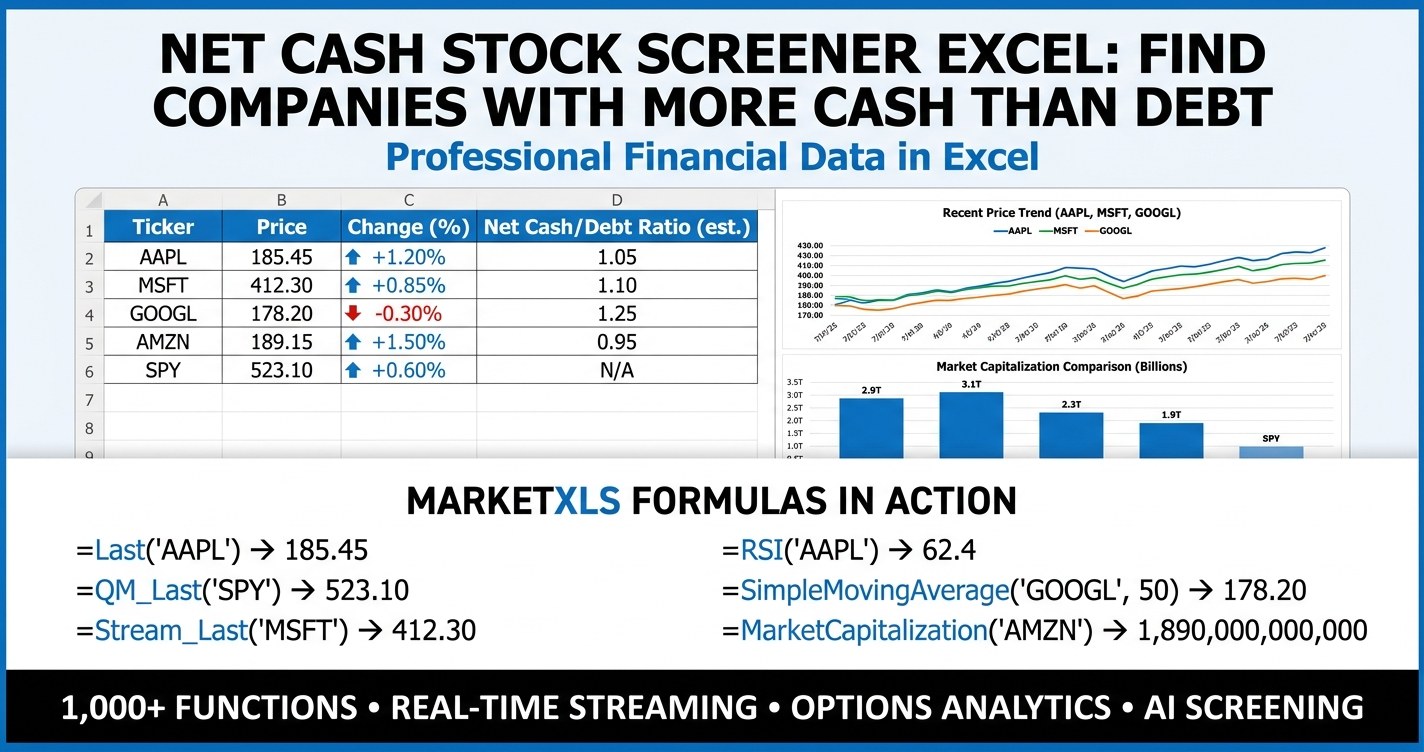
Net cash stock screener excel - download a May 2026 MarketXLS template that ranks U.S. companies by total cash minus total debt, builds a quality score from ROE and free cash flow, sizes positions, and flags pass or review on a single dashboard.
Equity risk premium dashboard Excel - measure how much extra return stocks offer over the 10-year Treasury, run scenarios on rates and earnings, and translate the spread into a stock vs bond allocation.
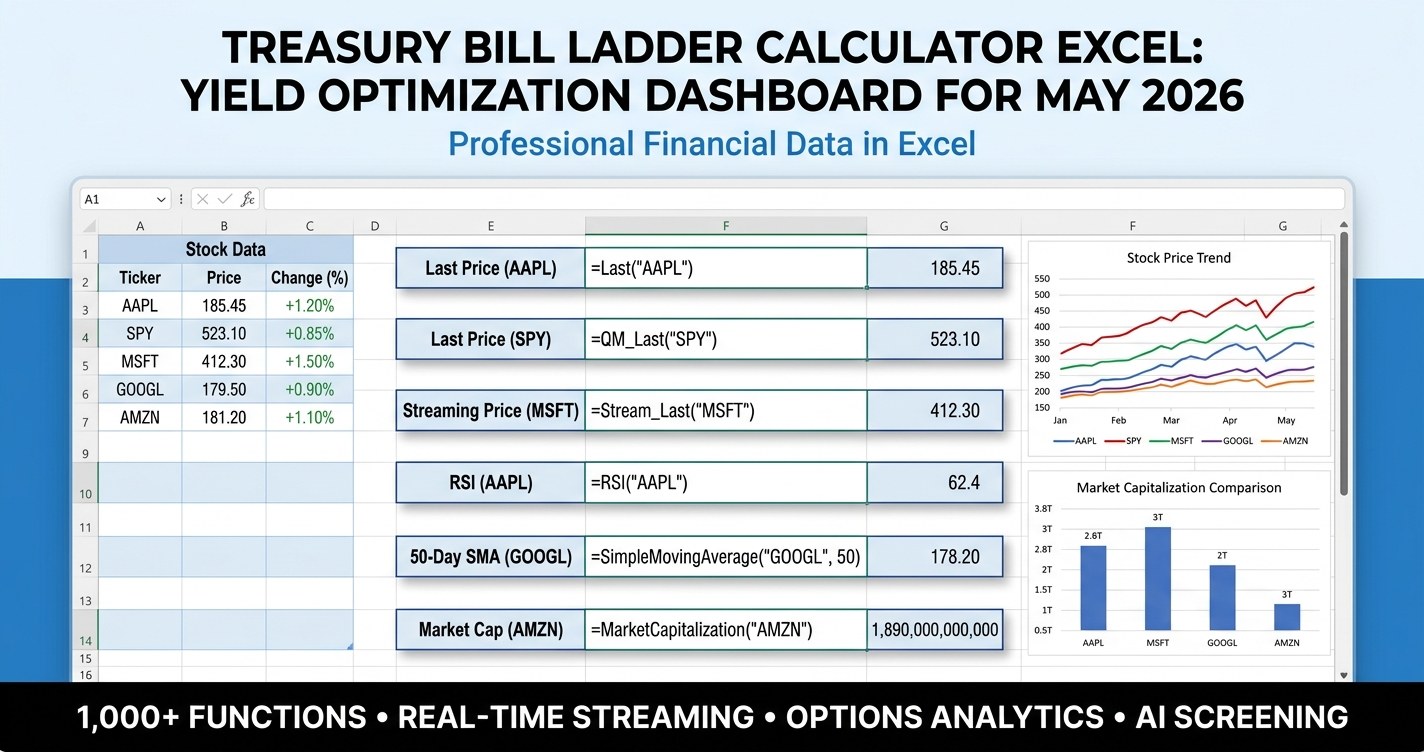
Treasury bill ladder calculator excel - a premium dashboard-style template that prices 12 monthly rungs against the live U.S. Treasury curve, shows scenario yields under Fed cuts and hikes, and compares the ladder to CDs, money market funds, savings, I-bonds, and corporate bonds.
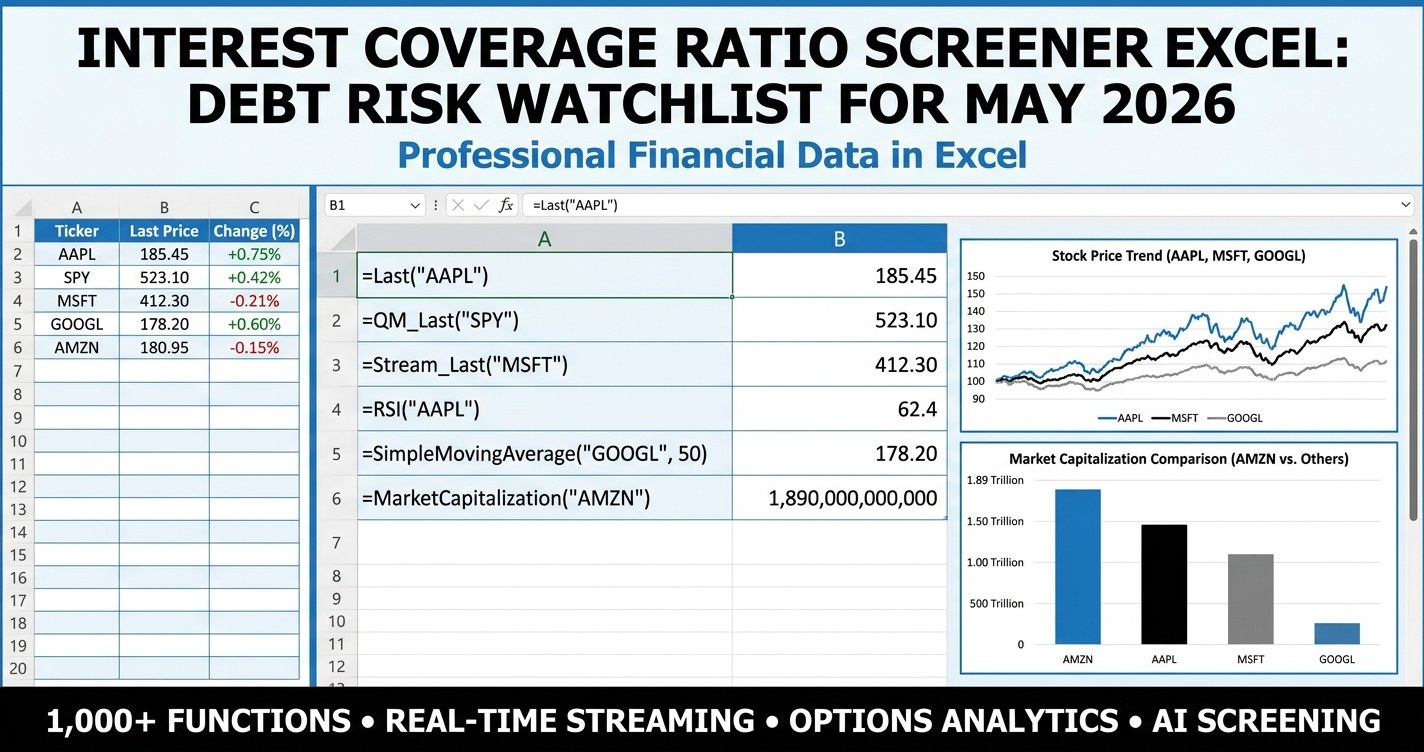
Interest coverage ratio screener excel - identify which S&P 500 names face refinancing risk in a higher-for-longer rate regime, with an Excel template that flags weak ICRs and stress-tests EBIT shocks.
Discover how 2,500+ serious investors are saving 15+ hours every week with real-time market data directly in Excel.
✓ No credit card required • ✓ 14-day money-back guarantee • ✓ Cancel anytime