
Options Flow Summary – MarketXLS New Release 9.3.5
We’re excited to share the newest addition to **MarketXLS – our Advanced Options Flow Summary **functions in Version 9.3.5, released on September 21st, 2023.
##** Key Updates Summary:--Options Order Flow Summary Functions- Market Scan to identify Tickers with unusual activities.- Market Scan to identify Individual options with unusual activities.-Backtest Accurately with Historical Option Chains## Here are the new updates:-**###1) A Closer Look: Options Order Flow Summary Functions - Total Volume & Open Interest Functions: Understand the complete volume of options traded for an underlying with functionalities tailored to retrieve total volume based on specific criteria like option type (call/put) and specific expiry.Example: *=opt_TotalVolumeOptions(“Symbol”,”P”,ExpirationNext(“Symbol”))*will return the total volume of options traded for the underlying with a specific expiry and option type.
-
Put/Call Ratios: Get market sentiment with precise ratios, whether you’re looking for volume-based ratios or open interest ones. These functions also offer insights into historical ratios, helping in trend analysis. Example: *=opt_PutCallVolRatioHistorical(“Symbol”,”2023-09-01″)*provides the put-call volume ratio for an underlying on a historical date.
-
Historical Option Data: Analyze expired historical options. Example: *=opt_ImpliedVolatilityHistorical(“Symbol”,”2023-09-01″)*fetches the implied volatility for an option on the mentioned historical date.
-
Option Utility Functions: Make your own real-time option chain with strikes and expirations you need with our new option utility functions like use StrikeNext to retrieve strike prices for specific expirations.Example: *=opt_StrikeNext(“Symbol”,2,ExpirationNext(“Symbol”))*provides the strike for a particular expiration.
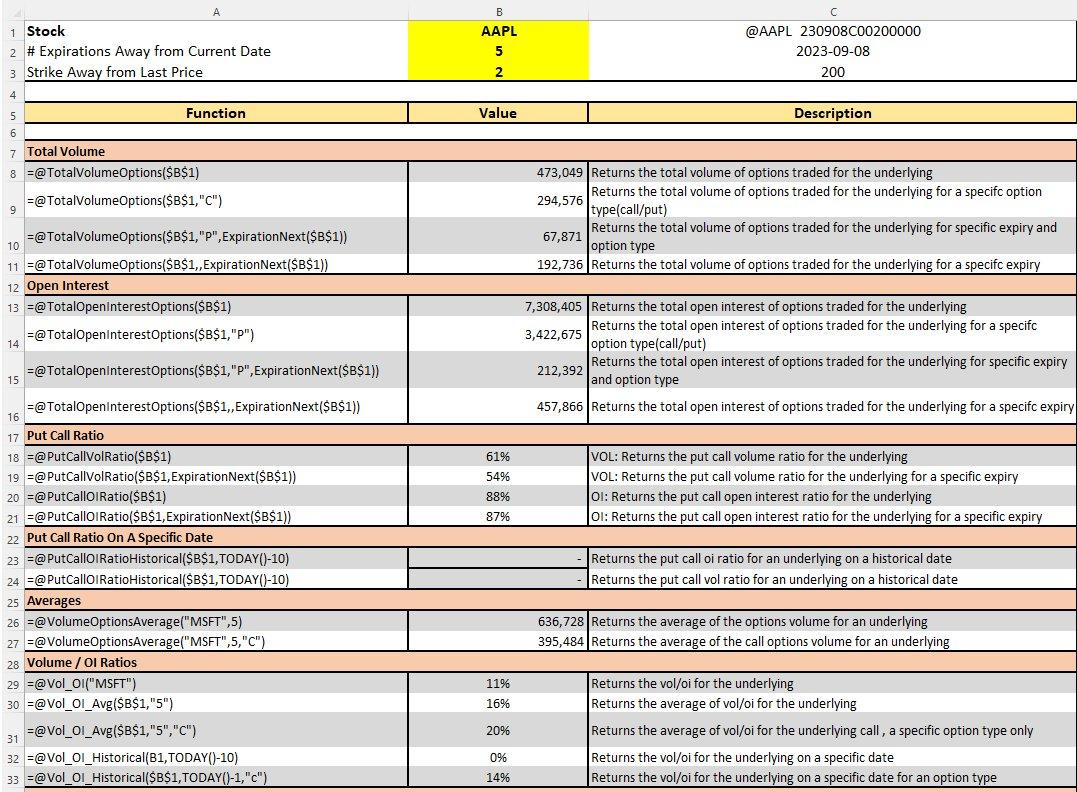
Options Order Flow Summary Functions
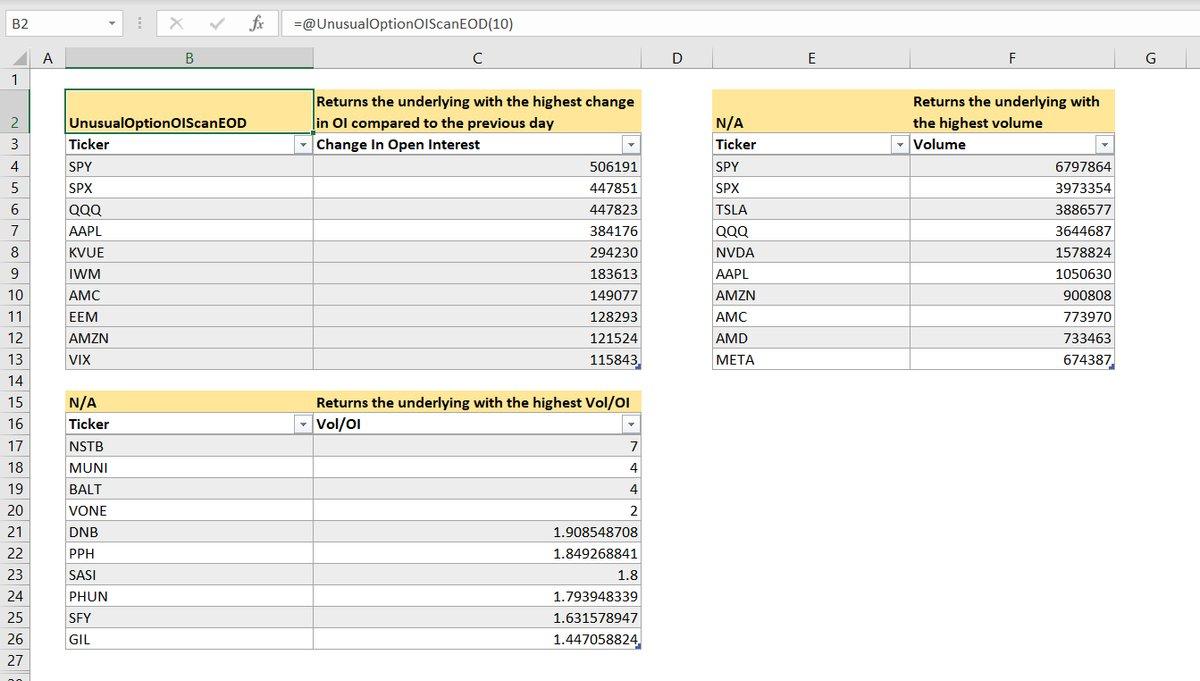
###2) MARKET SCAN TO IDENTIFY UNDERLYING “TICKER”-** Unusual Option Open Interest (OI) Scan**: Pinpoint underlyings that show significant deviations in their open interest with the *=opt_UnusualOptionOIScanEOD(10)*function. This scan filters out the underlying assets with the highest change in OI compared to the previous trading day, giving you a potential lead on market sentiment.
-
High Volume Underlying Scan: Stay ahead by identifying underlying assets that are attracting substantial trading volumes. Utilize the *=opt_UnusualOptionVolScanEOD(10)*function to zero in on those underlyings with the highest trading volumes.
-
Combined Volume and OI Scan: Sometimes, both volume and open interest give a clearer picture. Use the *=opt_UnusualOptionVolOIScanEOD(10)*function to identify underlyings that are not just attracting higher trading volumes, but also showing notable shifts in open interest.
MARKET SCAN TO IDENTIFY UNDERLYING "TICKER"
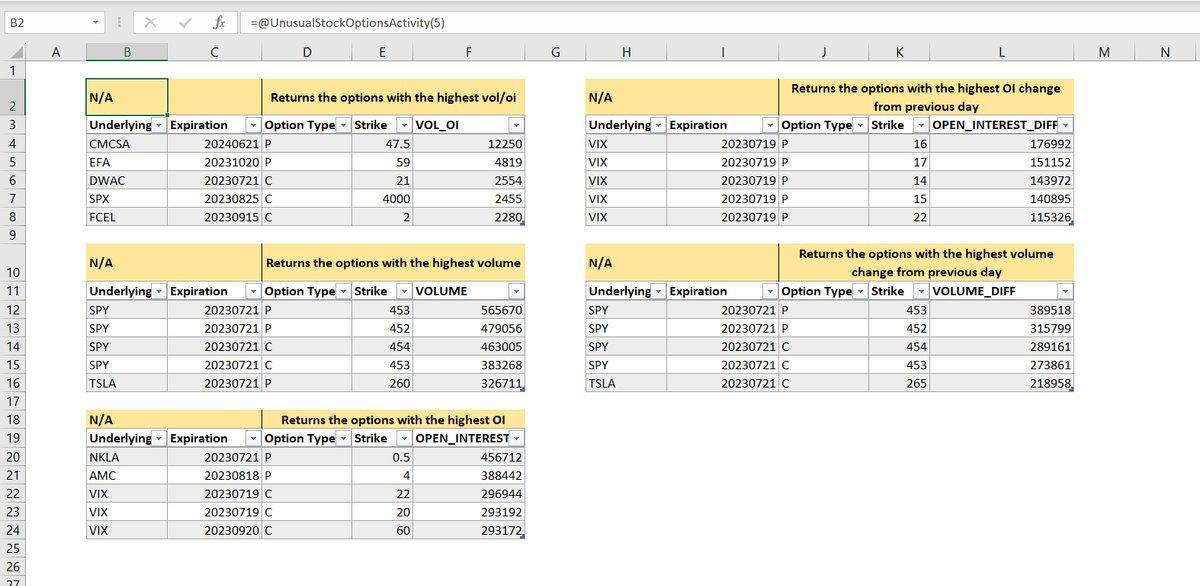
###3) ** THESE ARE “OPTION LEVEL” SCANS OF ENTIRE MARKET**-** Unusual Stock Options Activity**: Track anomalies in the options market effortlessly. With the *=opt_UnusualStockOptionsActivity(5)*function, you can quickly identify options that demonstrate the highest vol/oi, potentially highlighting unusual market activity.
-
Leaders in Open Interest Change: find options with significant shifts in open interest. The *=opt_OptionsChangeInOILeaders(5)*function lays out the options with the most substantial OI change from the previous trading day.
-
Volume Leaders Scan: Use the *=opt_OptionsVolumeLeaders(5)*function to spotlight options that are experiencing the highest trading volumes, thereby capturing market attention.
-
Large Volume Change in options: Get momentum shifts on options with the *=opt_OptionsChangeInVolumeLeaders(5)*function. This tool pinpoints options with the most considerable change in trading volumes from the previous day.
-
Open Interest Leaders: An essential metric for derivatives traders, open interest can offer insights into market sentiment. Leverage the *=opt_OptionsOILeaders(5)*function to identify options with the highest open interest in the market.
Market Scan to identify Individual options with unusual activities.
###**4) Retrieve Full Option Chain Data: Never miss a historical data point.With=opt_HistoricalOptionChain(“Ticker”,”Date”), retrieve complete option chains from past dates, giving you a powerful tool for precise backtesting. Analyze historical market dynamics, assess past volatilities, and refine your trading strategies by understanding how options behaved on specific days.
*** CHECKOUT THE VIDEO’s BELOW ****
- Options Trading | How to do Options Treading with MarketXLS | New Advanced Option Analytics Function – **Link **"
- Get Future Strike prices and expiration dates in Excel – Link---
Our team has performedminor optimizationsto run MarketXLS smoothly. Please email us atsupport@marketxls.comwith any concerns or issues you face.
Click here to join ourDiscord ** community** and engage with other MarketXLS users.
MarketXLS focuses on delivering the best Excel experience to its users; help us improve MarketXLS by sharing your feedback.
