
SPX options historical data is one of the most valuable resources for options traders, analysts, and researchers who want to backtest strategies, study volatility trends, and understand how S&P 500 Index options have behaved across different market conditions. Whether you are a professional trader or a self-directed investor, having access to reliable historical SPX options data can be the difference between a well-tested strategy and guesswork. With tools like MarketXLS, obtaining and analyzing historical SPX options data becomes simple and accessible directly in Excel. This article guides you through everything about SPX options — from their unique benefits to utilizing historical data for informed trading decisions.
Introduction
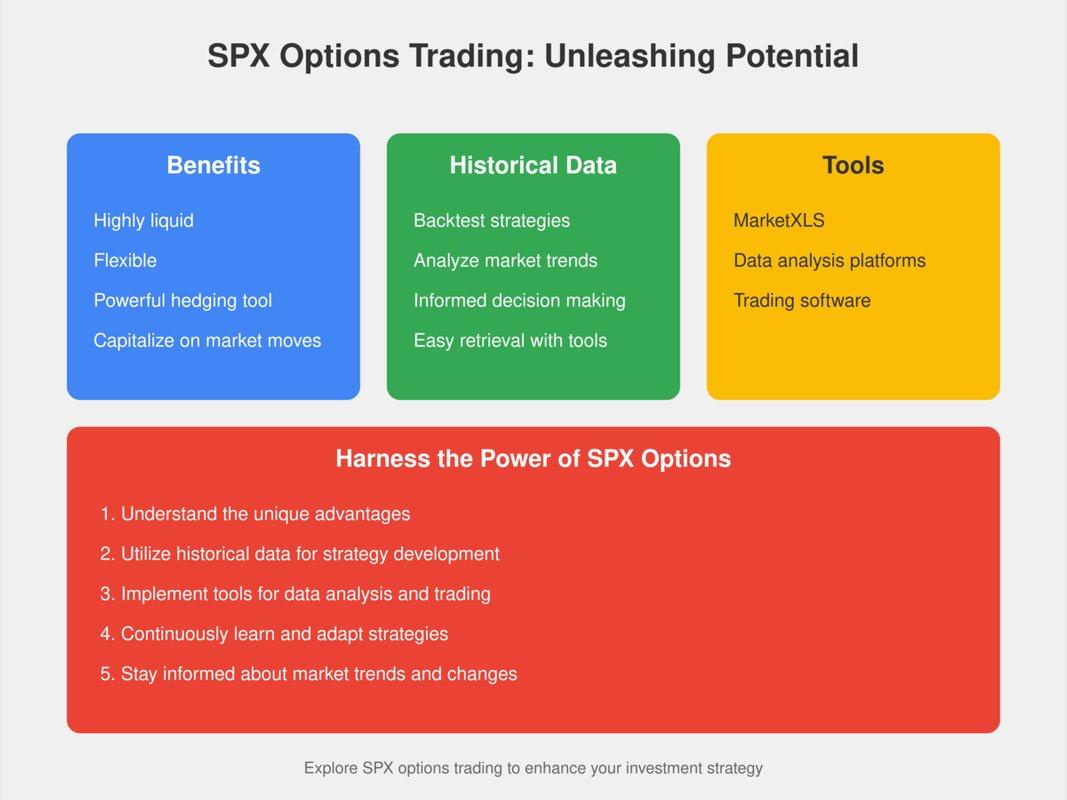
If you've ever wondered about the possibilities of trading options on the S&P 500 Index (SPX), and are particularly interested in SPX options historical data, you're in the right place. Not only can you trade SPX options, but their unique advantages make them a popular choice for many traders. Highly liquid and flexible, SPX options offer powerful tools to hedge investments or capitalize on market movements. When it comes to strategic planning and analysis, having access to historical SPX options data can be a game-changer. Imagine easily retrieving past prices to backtest strategies or see market trends. With tools like MarketXLS, obtaining historical options data becomes simple. This article will guide you through the ins and outs of SPX options, from their inherent benefits to utilizing historical data for informed trading decisions. So, let's dive in and see how you can harness the power of SPX options in your trading toolkit.
Can You Do Options on SPX?
Absolutely, you can trade options on the S&P 500 Index (SPX). SPX options are widely regarded for their liquidity and flexibility, making them a popular choice among traders looking to hedge their investments or capitalize on market movements. Imagine you have a strong belief that the S&P 500 will rise over the next month; purchasing a call option on SPX could be an effective strategy. It gives you the right, but not the obligation, to buy the index at a specified price before a specific date. Conversely, if you anticipate a market downturn, purchasing a put option allows you to sell the index under similar conditions, offering a safety net against losses in your portfolio.
Moreover, SPX options come with distinct advantages like European-style exercise, which means they can only be exercised at expiration. This reduces the risk of being assigned at an inconvenient time. These options also settle in cash rather than requiring physical delivery of shares, simplifying the process for investors. One noteworthy aspect is the availability of Weeklys and Monthlys, allowing for strategic planning around specific market events or earnings announcements. If you're thinking "Can you do options on SPX?"—the answer is a resounding yes, and with the right knowledge, they can serve as powerful tools in your trading arsenal.
How to Retrieve SPX Options Historical Data with MarketXLS
To get historical options price data using MarketXLS, you can use various functions specially designed for options trading and analysis. Below are some detailed steps and functions to retrieve historical SPX options data:
Getting the SPX Option Chain
The most powerful way to access SPX options data is through the option chain function:
=QM_GetOptionChain("^SPX")
This returns the complete option chain for SPX, including all available strikes, expirations, bid/ask prices, volume, open interest, and implied volatility. This is your starting point for any SPX options analysis.
Getting SPX Historical Price Data
=QM_GetHistory("^SPX")
This retrieves historical price data for the S&P 500 Index, which you can use to correlate with historical options pricing patterns and backtest strategies.
Getting Options Quotes with Greeks
=QM_GetOptionQuotesAndGreeks("^SPX")
This function provides the complete option chain with all Greeks (Delta, Gamma, Theta, Vega, Rho), giving you the data needed for sophisticated analysis of SPX options pricing dynamics.
Historical Bid and Ask Prices
1. Historical Bid Price (Options):
– Function: Bid_Historical
– Syntax: =Bid_Historical("Option Symbol", Date)
– Example: =Bid_Historical("AAPL210917C00145000", TODAY()-20)
– Description: Returns the bid price for an option on a specific historical date.
2. Historical Ask Price (Options):
– Function: Ask_Historical
– Syntax: =Ask_Historical("Option Symbol", Date)
– Example: =Ask_Historical("AAPL210917C00145000", TODAY()-10)
– Description: Returns the ask price for an option on a specific historical date.
3. Options Volume and Open Interest Ratio on a Historical Date:
– Function: opt_Vol_OI_Historical
– Syntax: =opt_Vol_OI_Historical("Option Symbol", Date)
– Example: =opt_Vol_OI_Historical("AAPL210917C00145000", TODAY()-10)
– Description: Returns the volume to open interest ratio for a specific historical date.
4. Historical Option Chain Data:
– Function: opt_HistoricalOptionChain
– Syntax: =opt_HistoricalOptionChain("Ticker", "Date")
– Example: =opt_HistoricalOptionChain("AAPL", "2021-09-17")
– Description: This function provides the entire option chain for a specified expiration date, allowing for in-depth historical data analysis and backtesting strategies.
5. Historical Greeks (Delta, Gamma, Vega, Theta, Rho) for Options:
– Delta: =opt_DeltaHistorical("Option Symbol", Date)
– Gamma: =opt_GammaHistorical("Option Symbol", Date)
– Vega: =opt_VegaHistorical("Option Symbol", Date)
– Theta: =opt_ThetaHistorical("Option Symbol", Date)
– Rho: =opt_RhoHistorical("Option Symbol", Date)
– Example: =opt_DeltaHistorical("AAPL210917C00145000", TODAY()-1)
– Description: Returns the delta, gamma, vega, theta, or rho for an option on a specific date. These functions are useful for historical analysis of the option's sensitivity metrics.
Using these functions, you can efficiently retrieve and analyze historical options price data for a variety of analytical and backtesting purposes. These functions provide detailed insights into past option prices, enabling comprehensive analysis and aiding in informed trading decisions.
Here is the template you might want to check out and MarketXLS has 100s of templates to get you started easily and save you time:
Option Chain Excel Sheet (Download Template)
–

Option Chain Excel Sheet
Benefits of Trading SPX Options
Trading SPX options offers a unique blend of flexibility and leverage that caters to a wide range of trading strategies. One of the primary benefits is the high liquidity of the SPX options market. With numerous contracts traded daily, traders can easily enter and exit positions without significant price impacts. This liquidity ensures competitive bid-ask spreads, making trading more cost-effective. Have you ever found yourself frustrated by not being able to execute a trade at your desired price? SPX options might be the remedy for that, offering almost instantaneous transactions.
Another significant advantage is the variety of strategies that SPX options enable. From basic strategies like covered calls and protective puts to more advanced techniques such as iron condors and butterflies, traders have the flexibility to tailor their trades to their specific market outlook and risk tolerance. An added layer of attraction is the tax efficiency associated with SPX options. Under the IRS Section 1256 rule, these options benefit from a blended tax rate of 60% long-term and 40% short-term capital gains, which can lead to substantial tax savings compared to regular stock trades. When you combine these factors with the inherent leverage that options trading offers, it's clear why SPX options are a go-to for many experienced traders seeking enhanced returns.
Lastly, SPX options can serve as an excellent tool for hedging against market volatility. Imagine you're holding a portfolio heavily weighted in large-cap stocks; a sudden market downturn could erode your gains swiftly. By employing strategies like bearish put spreads or collars, you can mitigate potential losses while still maintaining upside potential. This risk management feature is not only crucial for individual investors but also for institutional traders who need to protect large portfolios. In essence, the benefits of trading SPX options extend far beyond simple speculation, offering robust tools for liquidity, strategy diversity, tax efficiency, and risk management.
SPX Options Historical Data: Key Data Points and Sources
Understanding what data points are available and where to source them is crucial for effective SPX options analysis. Here is a comprehensive overview:
| Data Point | Description | MarketXLS Function | Source |
|---|---|---|---|
| Option Chain (Current) | All strikes, expirations, prices | =QM_GetOptionChain("^SPX") | MarketXLS / QuoteMedia |
| Historical Prices | Past SPX index values | =QM_GetHistory("^SPX") | MarketXLS / QuoteMedia |
| Greeks | Delta, Gamma, Theta, Vega, Rho | =QM_GetOptionQuotesAndGreeks("^SPX") | MarketXLS |
| Implied Volatility | IV for specific options | =opt_ImpliedVolatilityHistorical() | MarketXLS |
| Historical Volatility | Realized price volatility | =StockVolatilityOneYear("^SPX") | MarketXLS |
| Volume & Open Interest | Trading activity metrics | Included in option chain | MarketXLS |
| CBOE Data | Official exchange data | Manual download | CBOE website |
| VIX | Implied volatility index | =Last("VIX") | MarketXLS |
Differences Between SPX Options and SPY Options
When discussing the differences between SPX options and SPY options, it's vital to understand their fundamental distinctions. SPX options are based on the S&P 500 index, a broad measure of the U.S. stock market, and are settled in cash. In contrast, SPY options correspond to the SPDR S&P 500 ETF, an exchange-traded fund that tracks the same index but is settled by delivering the shares of the ETF. This means that when trading SPX options, you're effectively dealing with a more abstract financial instrument, whereas SPY options involve a direct investment in a tangible asset.
Additionally, SPX options enjoy tax advantages thanks to Section 1256 contracts, which are taxed 60% at long-term capital gains rates and 40% at short-term rates. Conversely, SPY options are taxed like regular stock options, typically leading to a higher effective tax rate for most investors. Moreover, SPX options are European-style contracts, meaning they can only be exercised at expiration. On the other hand, SPY options are American-style, allowing for exercise at any time before expiration. This difference can significantly impact trading strategies, especially for those relying on the flexibility of exercising options at will. Understanding these nuances can be crucial for investors looking to optimize their portfolios and leverage the specific advantages each type provides.
SPX vs SPY Options Comparison Table
| Feature | SPX Options | SPY Options |
|---|---|---|
| Underlying | S&P 500 Index | SPDR S&P 500 ETF |
| Settlement | Cash-settled | Physical delivery (ETF shares) |
| Exercise Style | European (at expiration only) | American (anytime before expiration) |
| Tax Treatment | Section 1256 (60/40) | Standard capital gains |
| Notional Value | ~10x larger than SPY | ~1/10 of SPX |
| Liquidity | Very high | Very high |
| Mini Version | XSP (1/10 of SPX) | N/A |
| Best For | Tax efficiency, large accounts | Smaller accounts, flexibility |
| Historical Data | =QM_GetHistory("^SPX") | =QM_GetHistory("SPY") |
Impact of Market Volatility on SPX Options Prices
Market volatility has a profound impact on SPX options prices, often driving them to fluctuate dramatically. When volatility rises, it typically increases the premiums across both calls and puts, as higher volatility indicates greater uncertainty about future price movements. Imagine you're planning a road trip and suddenly, a storm is predicted along your route; you'd likely prepare for a wider range of possible outcomes, just like investors do when market conditions become unpredictable. This surge in premiums is due to the heightened demand for options as hedging tools—investors seek protection against sharp market swings, pushing prices up.
On the flip side, decreasing volatility tends to suppress SPX options prices. Lower volatility suggests a more stable market, where fewer unexpected swings are anticipated. This stability diminishes the demand for options as a form of insurance, leading to cheaper premiums. Think of it as booking a vacation during a calm season versus hurricane season; during stable periods, fewer people seek added security, and hence, the costs are lower. Additionally, implied volatility, a key component of options pricing models like Black-Scholes, adjusts accordingly. As implied volatility decreases, the estimated future price variability is lower, thereby reducing overall premiums.
To see this in action, take the aftermath of significant market events like earnings reports or geopolitical developments which lead to increased volatility. For instance, options prices often spike ahead of quarterly earnings announcements for major companies in the S&P 500. Investors anticipate big moves due to the upcoming news, thus driving up the cost of options. Yet once the announcement passes and the uncertainty resolves, volatility tends to drop, bringing options prices down with it.
Overall, understanding how market volatility affects SPX options prices is crucial for both hedgers and speculators in navigating their strategies efficiently. By monitoring volatility trends, one can better anticipate the cost of risk protection and make more informed decisions in the dynamic landscape of the market.
Comparison of SPX Options with Other Index Options
When comparing SPX options with other index options, several nuanced distinctions become apparent. For one, SPX options are European-style, meaning they can only be exercised at expiration. This contrasts sharply with index options like those based on the Nasdaq-100 (NDX), which are also European-style, but others like the S&P 500 ETF (SPY) options are American-style and can be exercised anytime before expiration. This difference can significantly impact hedging strategies and flexibility. Professional traders often prefer SPX options for their tax advantages. Because SPX options are considered section 1256 contracts, they benefit from a favorable 60/40 tax treatment—60% of gains treated as long-term and 40% as short-term. This tax treatment can be a game-changer for traders looking to optimize their net returns.
Moreover, the sheer volume and liquidity of SPX options set them apart. The SPX is among the most actively traded options in the world, resulting in tighter bid-ask spreads. This liquidity reduces slippage, making SPX options more cost-efficient for large transactions. Conversely, options on lesser-known indices or ETFs might suffer from wider spreads and lower liquidity, increasing the cost and risk of execution. SPX options also offer a broad range of expirations, from weekly to long-term, enabling greater flexibility in strategy implementation. For example, deploying a time decay strategy like a calendar spread would be much more efficient with SPX options than with index options lacking such granularity in expiration dates.
Tax Implications of Trading SPX Options
When trading SPX options, understanding the tax implications is crucial for maximizing returns. SPX options, being cash-settled and European-styled, fall under Section 1256 contracts in U.S. tax code. This classification means that profits and losses are treated as 60% long-term and 40% short-term capital gains, regardless of the holding period. Imagine the advantage here: even if you hold an SPX option for just a day, part of your earnings benefit from the lower long-term capital gains rate. Isn't that a nice perk?
However, it's essential to keep detailed records. The IRS requires you to mark your SPX options to market at year-end, treating any unrealized gains or losses as though they were actual. This means more paperwork, but potentially less tax. Consider, too, how your trades impact your overall tax strategy. Pairing these options with other investments might allow for strategic tax loss harvesting. Have you thought about how this could reduce your tax burden?
Navigating these waters can be complex, but with proper planning, you can sail smoothly. For instance, automated trading platforms increasingly offer tax reporting features to simplify this process. Accurate and timely filing stops the tax man from knocking on your door. In summary, while SPX options provide enticing opportunities, they also demand an informed approach to tax handling. So why not take a closer look at your portfolio and see where you can benefit?
Effect of Dividends on SPX Options
When dividends are paid out by companies in the S&P 500, the effect on SPX options can be quite notable. Dividends generally reduce the price of the underlying index, causing an impact on both call and put options. For example, when dividends are distributed, the S&P 500 index might see a drop equivalent to the dividend amount. This decrease lowers call option values because the drop in the index price moves the strike price closer to being out-of-the-money. Conversely, put options tend to become more valuable under these conditions since the drop moves the strike price towards being in-the-money.
But what does this mean for traders? Well, anyone holding long SPX call options might find themselves at a disadvantage, as the anticipated dividend payout can undermine their positions. Meanwhile, those holding SPX put options might benefit from the increased value resulting from the index's decline. Another important consideration is the impact on implied volatility. Dividend payouts can alter market expectations and lead to adjustments in implied volatility, affecting option premiums. Therefore, understanding the schedule and the potential amount of dividends can be a strategic advantage. For a trader, anticipating these payouts can mean the difference between a profitable trade and a loss. Keeping an eye on scheduled dividend announcements and the resultant shifts in the S&P 500 index helps in making more informed decisions. Have you noticed how dividends have influenced your trading strategies? Balancing this impact often distinguishes the amateurs from the seasoned traders in the options market.
Hedging Portfolio Risks with SPX Options
When it comes to hedging portfolio risks with SPX options, investors often find these financial instruments invaluable. SPX options, which are tied to the S&P 500 Index, offer a flexible and efficient way to protect against downside risks. For instance, purchasing put options acts as a form of insurance; if the market plunges, the puts gain value and offset potential losses in your underlying portfolio. This is much like having airbags in a car—there for protection when you really need them, but hopefully not used frequently.
To illustrate, imagine you hold a diversified portfolio worth $1 million. Concerned about market volatility over the next three months, you could buy SPX put options at a strike price reflecting a 2% decline from the current index level. If the market drops more than 2%, these put options will gain value, cushioning your portfolio from greater losses. In this manner, puts serve as a guardrail, ensuring that a severe market dip doesn't crater your investments.
Moreover, sophisticated strategies such as constructing a "protective collar" can provide cost-effective risk management. This involves buying put options to guard against severe declines while simultaneously selling call options to generate premium income, offsetting the cost of the puts. Think of it as not just having airbags, but also optimizing your car insurance to ensure you're covered without breaking the bank. Strategies like these make SPX options versatile tools for risk management, balancing potential losses with strategic gains.
Market Sentiment Analysis Through SPX Options Trading
Market sentiment analysis through SPX options trading offers an intriguing lens into investor psychology. Imagine SPX options as mood rings for the financial world, reflecting the unspoken sentiment of traders. When the market experiences a surge in put option purchases, it often signals rising anxiety or a bearish outlook. On the flip side, a higher volume of call options suggests optimism or bullish sentiment. These buying patterns are not just random; they can be quantified through metrics like the Put/Call ratio, providing a snapshot of collective investor mood.
Consider the VIX, commonly known as the "fear gauge." This index measures market volatility based on SPX option prices and acts as a barometer for investor sentiment. When the VIX spikes, it usually means traders expect turbulent times ahead. Conversely, a low VIX indicates calm waters and a general sense of stability. This dynamic interplay between SPX options trading and market sentiment can guide investors in making more informed choices, like navigating a ship with the help of a reliable compass. So, the next time you scrutinize SPX options data, remember, you're not just reading numbers—you're deciphering the emotional undercurrents that drive the market.
Influence of Interest Rates on SPX Options
The influence of interest rates on SPX options is a multifaceted dynamic that traders need to grasp for effective strategies. Higher interest rates generally lead to an increase in the cost of carrying assets, which in turn affects the pricing of SPX options. Specifically, the value of call options usually rises, while the value of put options tends to decline. This happens because a higher interest rate reduces the present value of the strike price, making calls more advantageous and puts less attractive. For instance, when the Federal Reserve signals an uptick in the interest rates, those holding call options on the S&P 500 index could see their options gain value even if the underlying index remains stable.
Moreover, the time value of money plays a crucial role here. Essentially, interest rates reflect the opportunity cost of money. A rise in rates implies higher opportunity costs, prompting investors to re-evaluate their option positions. For example, imagine a trader holding an SPX call option with several months until expiry. If interest rates climb, the rent for freezing capital drops the implied volatility, often leading traders to reassess their 'time premium' on such options. By keeping an ear to the ground on interest rate movements, traders can better anticipate shifts in SPX options prices and recalibrate their hedging or speculative strategies. This foresight can turn simple observations into real profits.
Such nuanced implications make understanding interest rates essential for anyone involved in the SPX options market. Think of interest rates as the hidden current in a vast trading ocean, often making subtle adjustments to the path you chart with your investments. How do you navigate these changing tides effectively? By remaining vigilant on the economic front and translating macroeconomic cues into actionable options strategies. This knowledge empowers you to catch the wave at the right moment, leveraging your SPX options to their full potential.
How to Get Historical Volatility Trends in SPX Options Markets with MarketXLS
To get historical volatility trends in SPX (S&P 500 Index) options markets using MarketXLS, you can utilize several MarketXLS functions aimed at analyzing historical options data, particularly implied volatility (IV) which is a key component for understanding volatility trends.
Steps to Get Historical Volatility Trends
1. Implied Volatility (IV) for Historical Dates: The function opt_ImpliedVolatilityHistorical can be employed to retrieve the implied volatility for a specific option on a specific date. This allows you to track how IV has changed over time.
• Syntax:
=opt_ImpliedVolatilityHistorical("Option Symbol", "Date")
• Example Usage:
=opt_ImpliedVolatilityHistorical("SPX", TODAY()-30)
This will return the implied volatility for the SPX option 30 days ago.
2. Standard Deviation as a Proxy for Historical Volatility: MarketXLS also provides functions to calculate the standard deviation over various time frames which can be used as a statistical measure of the volatility for SPX options.
– 1 Year Volatility: =StockVolatilityOneYear("SPX") returns the stock's price volatility over the past year.
– 30 Days Volatility: =StockVolatilityThirtyDays("SPX") returns the thirty-day volatility of SPX.
3. Aggregated Implied Volatility Over Different Periods: There are functions available to get interpolated implied volatility for different periods:
– =ImpliedVolatility1y("SPX") for 1-year implied volatility.
– =ImpliedVolatility30d("SPX") for 30-day implied volatility.
4. Historical Option Data Retrieval: For a more comprehensive analysis, you can pull historical option chain data which includes implied volatility for all strikes and expirations using:
=opt_HistoricalOptionChain("SPX", "Date")
This will provide the entire option chain for SPX as of the specified date, allowing you to build a more detailed view of historical volatility trends.
Additional Tips:
– Combine these functions in a spreadsheet to create a time series visualization of SPX option volatility.
– Use conditional formatting in Excel to highlight significant changes or trends in the volatility data.
By using these MarketXLS functions, you can effectively analyze the historical volatility trends in SPX options markets, which is crucial for options pricing, risk management, and strategic decision-making in trading.
Here is the template you might want to checkout and MarketXLS has 100s of templates to get you started easily and save you time:
• Historical IV Calculator – MarketXLS
Building an SPX Options Historical Data Analysis Spreadsheet
Here is a step-by-step guide to building a comprehensive SPX options analysis workbook in Excel with MarketXLS:
Step 1: Set Up the SPX Data Sheet
Create a new worksheet and pull the current SPX index data:
=QM_Last("^SPX")
This gives you the current S&P 500 level as your reference point.
Step 2: Pull the Full Option Chain
In a dedicated worksheet:
=QM_GetOptionChain("^SPX")
This populates the sheet with all available SPX options, including calls and puts at every strike and expiration.
Step 3: Get Historical Context
Pull historical SPX price data for backtesting:
=QM_GetHistory("^SPX")
This provides historical daily prices that you can use to study how the index has behaved during various market conditions.
Step 4: Add Greeks Analysis
=QM_GetOptionQuotesAndGreeks("^SPX")
With Greeks data alongside pricing, you can analyze:
- Delta exposure across your portfolio
- Theta decay rates for income strategies
- Vega sensitivity for volatility trades
- Gamma risk for dynamic hedging
Step 5: Create a VIX Overlay
Track the VIX alongside your SPX options data:
=Last("VIX")
The VIX provides context for whether current implied volatility levels are historically high or low, helping you decide whether to buy or sell options premium.
SPX Options Historical Data for Backtesting Strategies
Using historical data to test strategies before risking real capital is one of the most valuable applications of SPX options data. Here are key strategies to backtest:
Iron Condor Backtesting
Iron condors sell both a put spread and a call spread around the current index level, profiting when the market stays in a range. Historical data lets you test:
- What width of strikes has been most profitable historically
- How often the S&P 500 has stayed within specific ranges over 30/45/60-day periods
- What the average profit and maximum loss have been
Put Selling (Cash-Secured or Spread) Backtesting
Selling SPX puts is a popular income strategy. Historical data helps you analyze:
- Win rates for different delta levels (e.g., selling 10-delta puts vs 20-delta)
- Maximum drawdowns during market crashes (2008, 2020, 2022)
- Cumulative returns over multi-year periods
Calendar Spread Analysis
Calendar spreads exploit the difference in time decay between near-term and far-term options. Historical volatility data helps you identify optimal entry points when the term structure is favorable.
Frequently Asked Questions (FAQ)
Q: What is SPX options historical data?
SPX options historical data includes past pricing, volume, open interest, implied volatility, and Greeks for options contracts on the S&P 500 Index. This data is essential for backtesting strategies, studying volatility patterns, and understanding how SPX options have performed across different market environments.
Q: Where can I get SPX options historical data?
You can retrieve SPX options historical data through MarketXLS using functions like =QM_GetOptionChain("^SPX") for current data and =QM_GetHistory("^SPX") for historical index prices. The CBOE also provides historical data downloads. MarketXLS integrates this data directly into Excel for easy analysis.
Q: How far back does SPX options historical data go?
SPX options have been traded since 1983, making over 40 years of data available. The depth of data available through any specific provider varies. MarketXLS provides comprehensive recent data, while the CBOE and academic databases may offer longer historical records.
Q: What is the difference between SPX and SPXW options?
SPX options are standard monthly contracts that expire on the third Friday of each month. SPXW (SPX Weeklys) expire on other days throughout the week. Both are cash-settled European-style options on the S&P 500 Index. In MarketXLS, you can see all available expirations using =QM_GetOptionChain("^SPX").
Q: Can I use SPX options historical data for backtesting?
Yes, historical data is essential for backtesting. You can test strategies like iron condors, put spreads, straddles, and calendars by applying them to historical price and volatility data. MarketXLS provides the tools to pull this data into Excel where you can build backtesting models.
Q: How does the VIX relate to SPX options historical data?
The VIX is calculated from SPX option prices and represents the market's expectation of 30-day volatility. Historical VIX data provides context for SPX options pricing — when VIX is high, SPX options premiums are elevated, and vice versa. Track the VIX with =Last("VIX") in MarketXLS.
Q: What are the tax advantages of trading SPX options?
SPX options qualify as Section 1256 contracts, receiving a 60/40 tax treatment — 60% of gains are taxed at long-term capital gains rates and 40% at short-term rates, regardless of how long you held the position. This can result in significant tax savings compared to trading SPY options or individual stock options.
Q: How do I analyze SPX options Greeks historically?
MarketXLS provides functions like =QM_GetOptionQuotesAndGreeks("^SPX") for current Greeks and =opt_DeltaHistorical(), =opt_ThetaHistorical(), =opt_VegaHistorical() for historical Greeks. These allow you to study how options sensitivities have changed over time.
Q: Is MarketXLS good for SPX options analysis?
Yes, MarketXLS provides comprehensive SPX options tools including real-time and historical data, full option chains, Greeks analysis, and integration with Excel for custom modeling. Explore MarketXLS to see all available options analysis features.
Summary
SPX options are liquid, flexible tools to hedge investments or capitalize on market movements. Accessing historical data, like prices and Greeks, helps backtest strategies and analyze trends. MarketXLS simplifies retrieving this data with functions like =QM_GetOptionChain("^SPX"), =QM_GetHistory("^SPX"), and =QM_GetOptionQuotesAndGreeks("^SPX"). SPX options are known for European-style exercise and cash settlement, reducing risk. They're also tax-efficient under IRS Section 1256, offering favorable blended tax rates. Understanding market volatility impacts options prices, with high volatility increasing premiums. SPX options can hedge portfolio risks effectively, offering strategies like protective collars. Tracking interest rates and dividends is crucial for informed SPX options trading. Get started with MarketXLS for comprehensive SPX options analysis in Excel.
spx options historical data
spx options historical data
