

Exploring Fibonacci Trading Strategies Fibonacci trading is a strategy backed by mathematics used in technical analysis for making informed trading decisions.
Stock Analysis
Expert insights on stock market analysis, investment strategies, and Excel techniques for smarter investing.
Exploring Fibonacci Trading Strategies Fibonacci trading is a strategy backed by mathematics used in technical analysis for making informed trading decisions.
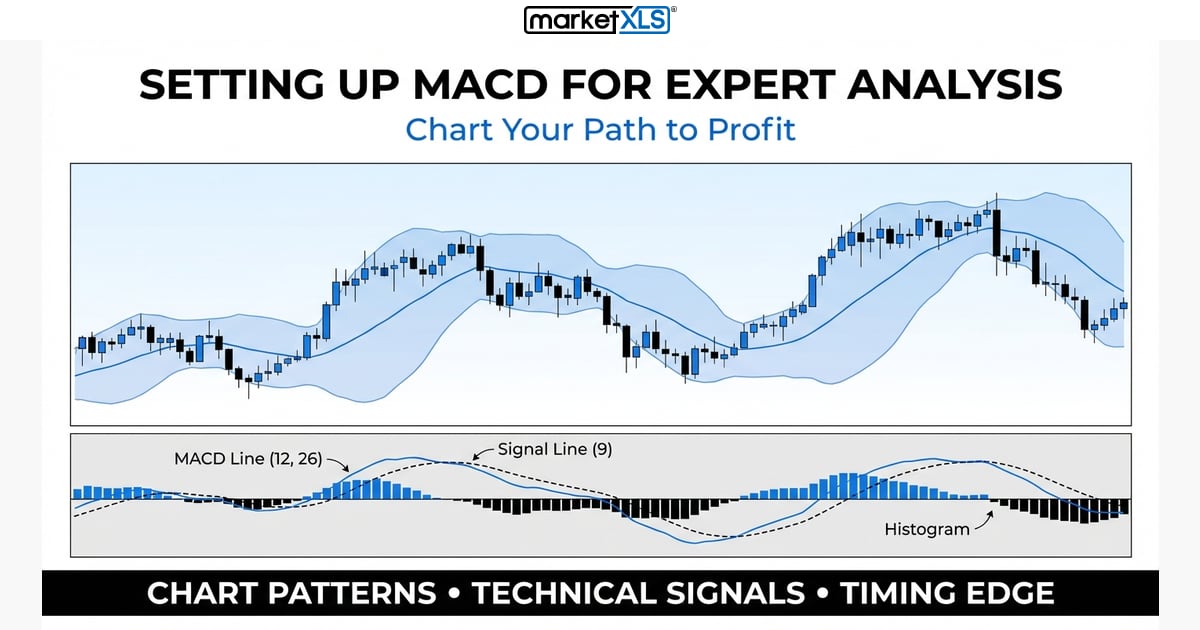
Setting Up Moving Average Convergence Divergence (MACD) for Expert Analysis What is Moving Average Convergence Divergence (MACD)?

What is The MACD Indicator And How Can It Help You Trade? The Moving Average Convergence Divergence Indicator (MACD) is one of the most widely used tools within technical analysis, providing traders...

MarketXLS has evolved, with your feedback, into a cross-platform investment research tool. We received many requests to include the implied volatility functions in MarketXLS since users had to access...

We hope you are doing well. We are very excited to announce the new MarketXLS Menu and new functions data in MarketXLS available today, May 6th, 2022, for you to start using.

We take pride in announcing that marketXLS isn’t limiting itself to just excel sheets. Our focus lies on providing the best value for your money and hence we are constantly innovating.

What Is Fibonacci Retracement? Leonardo Piscano was an Italian mathematician from Pisa. He was nicknamed Fibonacci and he found an interesting pattern in a certain set of numbers.

Buy stocks from Excel showing trade execution workflow and spreadsheet interface

AI in stock markets infographic showing sentiment analysis, algo trading, pattern recognition, and risk management

Machine learning is the usage of Artificial Intelligence for predicting future results or trends by feeding it historical human data. The ai gradually learns to adapt to the past trends and improves over time in extrapolating those trends to future scenarios. Machine learning has been in the limelight for the past decade, and it is */ -->

The term small-cap usually refers to firms with small market capitalization, ranging from $300million to $2 billion.

Introduction The industrial goods sector is a category of companies that make or sell machinery, supplies, or equipment used in manufacturing and construction.

Overvalued stocks trade above their intrinsic value and can expose investors to significant downside risk. Learn how to identify overvalued stocks using valuation metrics, screening methods, and MarketXLS Excel formulas.
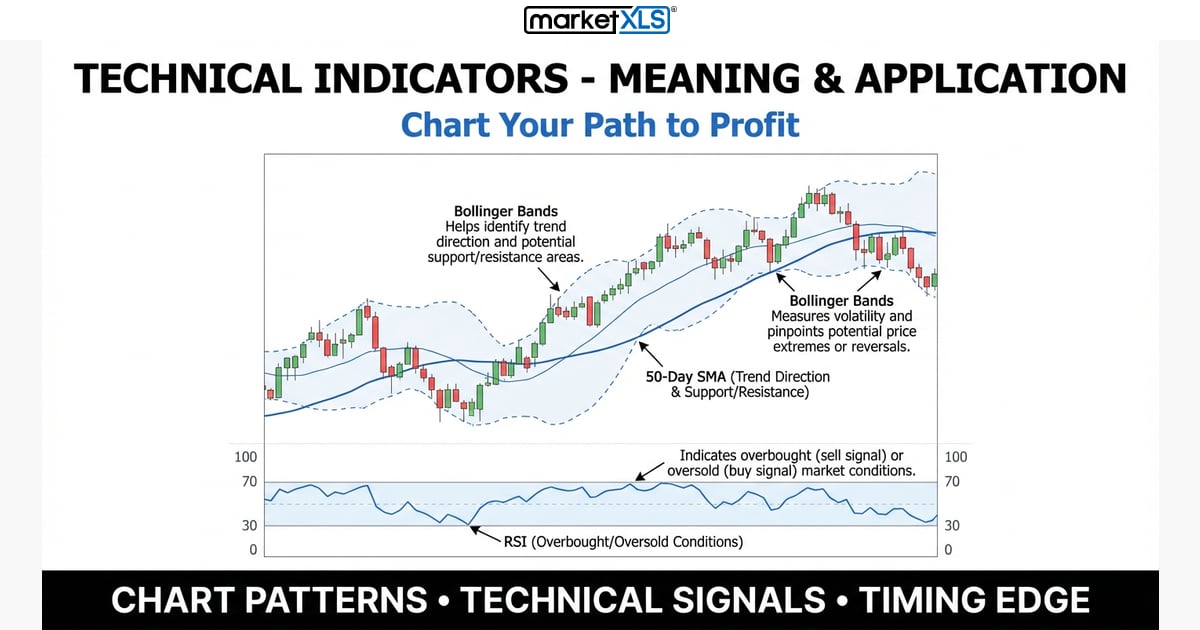
Technical Indicators’ analysis is the study of historical data to estimate futuristic trends and fluctuations in the prices of stocks. It is used to determine the entry and exit points in the market.
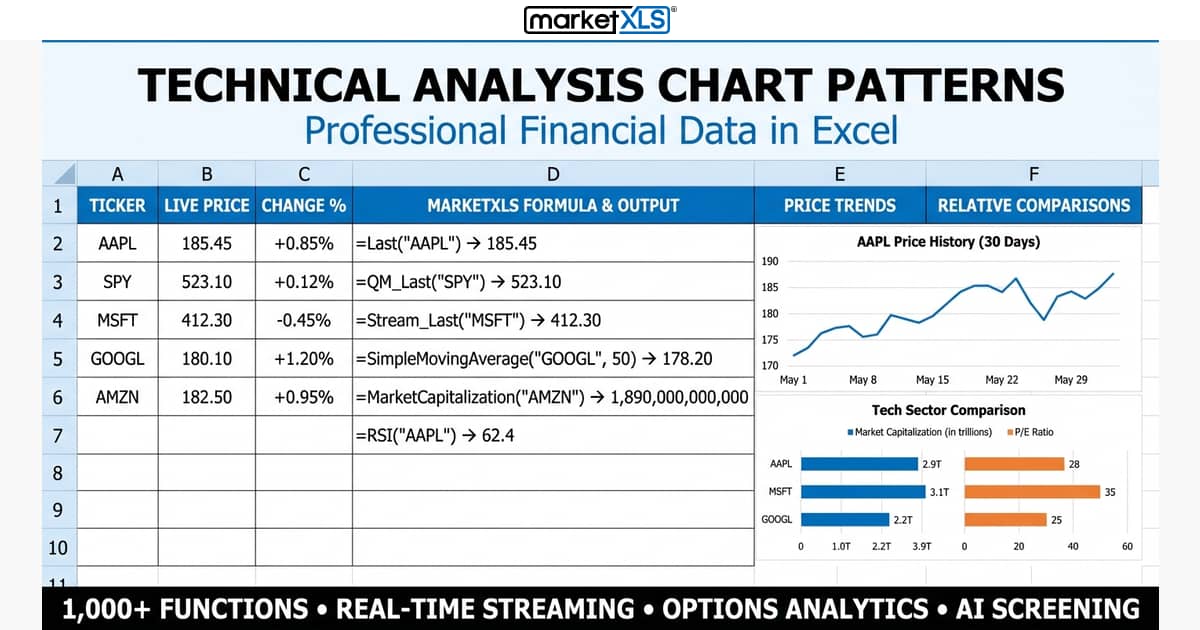
Technical Analysis Chart Patterns provide visual signals of potential price movements — and Excel gives you the tools to identify, validate, and backtest these patterns using real market data.

Introduction Consumer discretionary is an expression for services and goods that are non-essential items.
Discover how 2,500+ serious investors are saving 15+ hours every week with real-time market data directly in Excel.
✓ No credit card required • ✓ 14-day money-back guarantee • ✓ Cancel anytime