
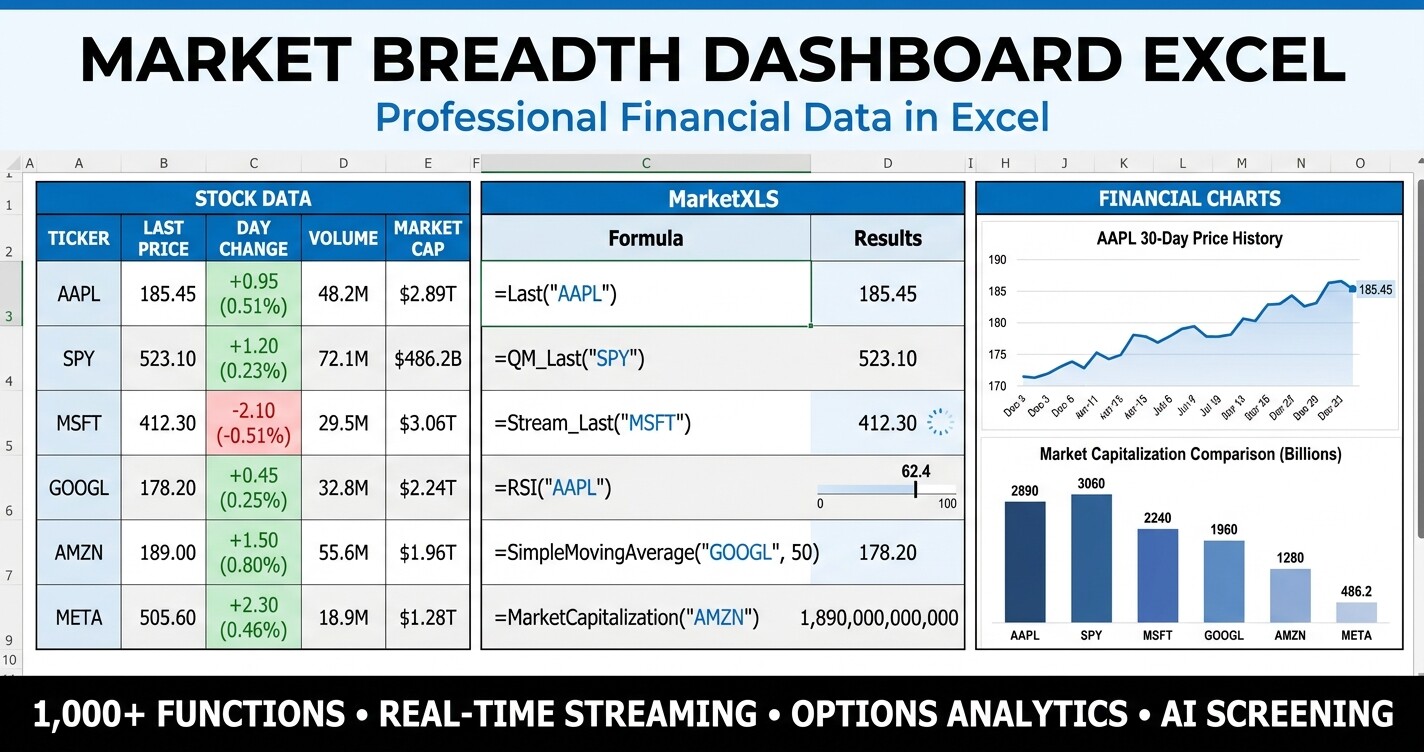
Market breadth dashboard Excel - track percent of stocks above the 50/200-day moving average, advance-decline counts, 52-week highs and lows, RSI distribution, and sector breadth in one premium workbook.
Technical Analysis
Expert insights on stock market analysis, investment strategies, and Excel techniques for smarter investing.
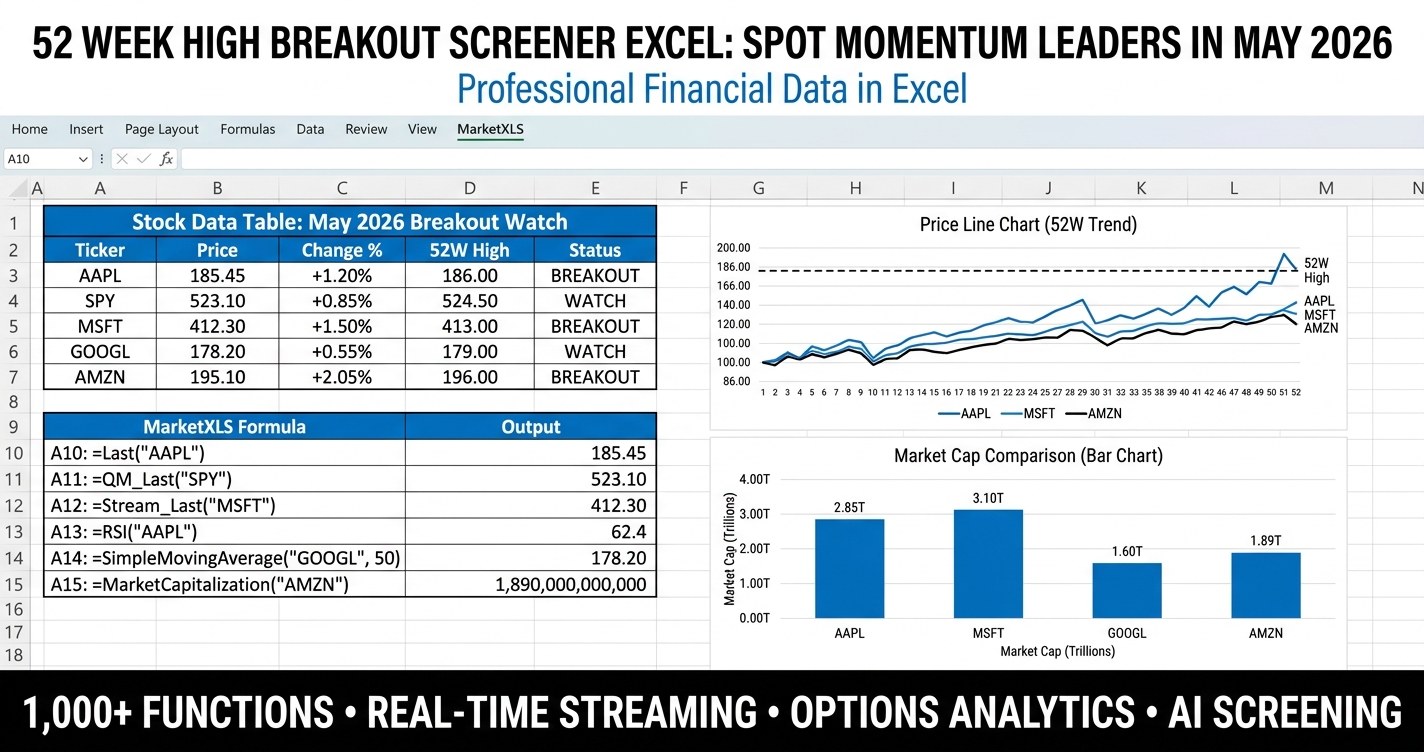
52 week high breakout screener excel - build a rules-based momentum watchlist that surfaces stocks pressing their 52-week highs with volume, RSI, and trend confirmation, powered by live MarketXLS formulas.
Market breadth dashboard Excel - track percent of stocks above the 50/200-day moving average, advance-decline counts, 52-week highs and lows, RSI distribution, and sector breadth in one premium workbook.

RTI Functions bring live streaming technical indicators directly into Excel. RSI, MACD, Bollinger Bands, VWAP, Stochastic, ATR, ADX, and more — all updating in real time. Build professional trading dashboards without writing a single line of code.
Discover how 2,500+ serious investors are saving 15+ hours every week with real-time market data directly in Excel.
✓ No credit card required • ✓ 14-day money-back guarantee • ✓ Cancel anytime