
Technical Analysis

moving average excel work usually dies in the data step. Here is how to pull live SMA and EMA values into a spreadsheet with a single formula, read golden and death crosses honestly, and download a ready-built dashboard.
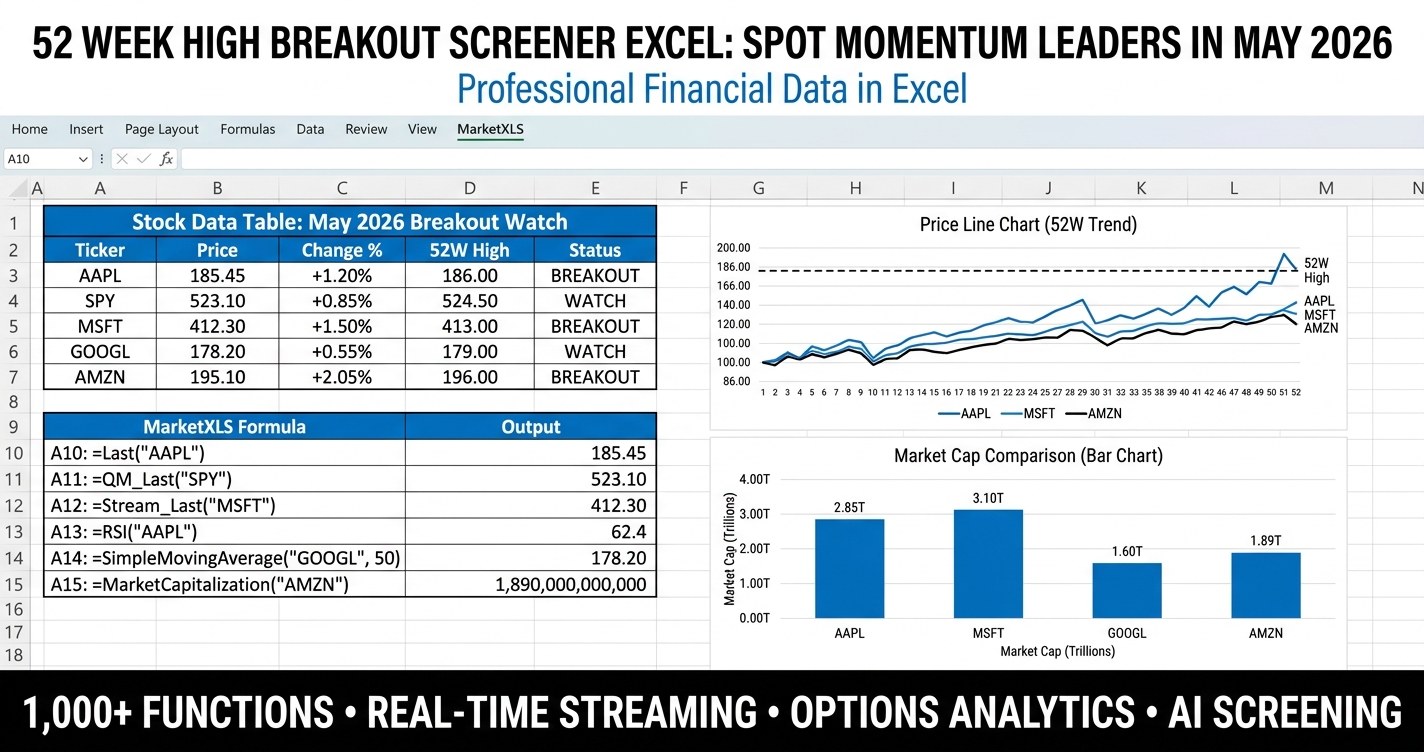
52 week high breakout screener excel - build a rules-based momentum watchlist that surfaces stocks pressing their 52-week highs with volume, RSI, and trend confirmation, powered by live MarketXLS formulas.
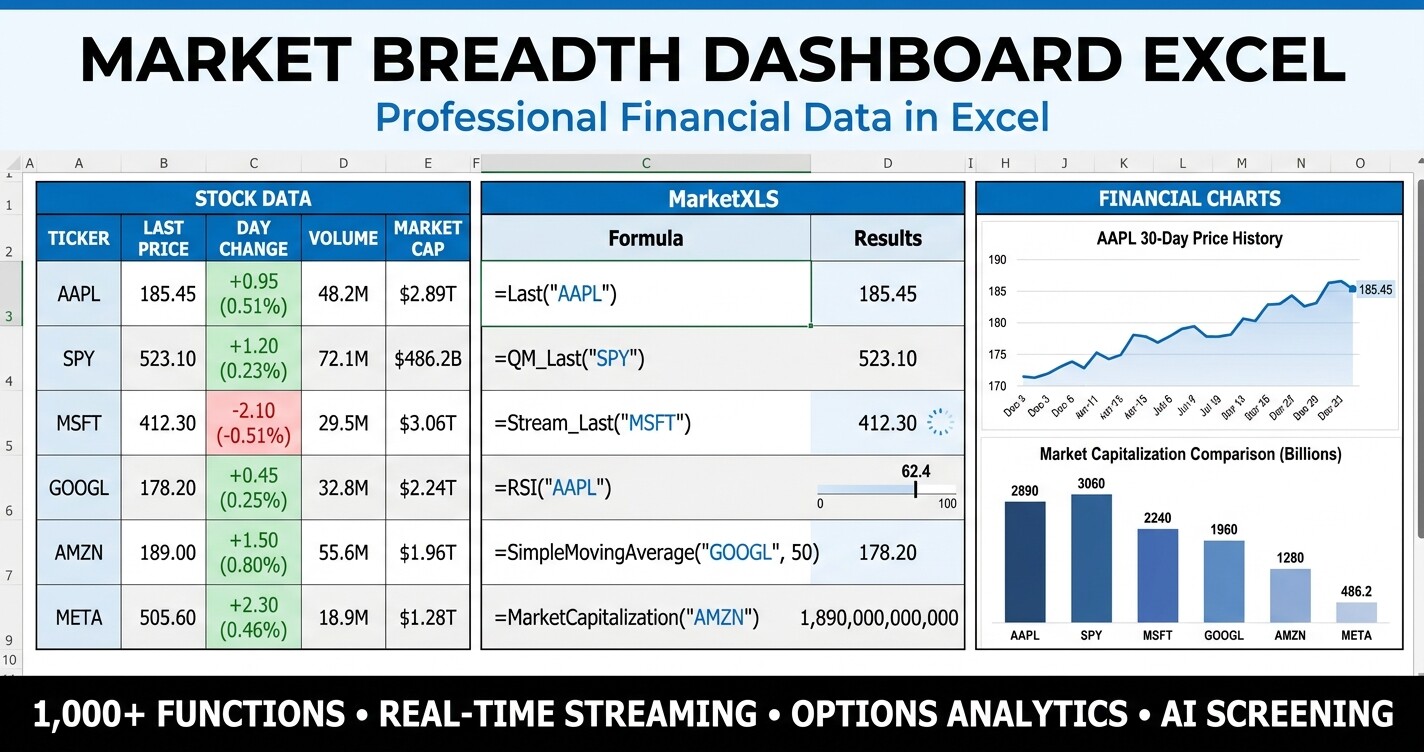
Market breadth dashboard Excel - track percent of stocks above the 50/200-day moving average, advance-decline counts, 52-week highs and lows, RSI distribution, and sector breadth in one premium workbook.

RTI Functions bring live streaming technical indicators directly into Excel. RSI, MACD, Bollinger Bands, VWAP, Stochastic, ATR, ADX, and more — all updating in real time. Build professional trading dashboards without writing a single line of code.