Historically speaking, small-capitalization companies have often outperformed larger companies even after considering the additional risks that smaller companies carry. This is why they have attracted investors’ attention for a long time. The attraction in small caps is due to their potential to become large companies, with their share price appreciating in the process. With numerous small-cap companies to choose from, the process of finding the most promising small firms is a strenuous task.
Stock screening allows you to filter out the group of companies down to a more manageable group to analyze and assess more watchfully. A Guru strategy for screening of small stocks was developed by Tom and David Gardner, founders of the Motley Fool™. Their strategy is called the Foolish 8 because it uses eight criteria to look for rapidly growing and profitable small companies with strong price momentum.
Small-cap companies generally do not get the attention of the analysts or financial media like more prominent firms. The Foolish Small-Cap 8 screen is partly based upon the principle that the lack of interest and coverage in small-cap companies presents a better chance to identify unexplored, attractive investment companies.
The Foolish 8 Parameters
The Foolish Small-Cap 8 screen is created to identify potential growth companies. It is based upon a combination of business and market-related factors. The parameters which are used to identify potentially good businesses are:
- Revenue of less than $500 Million.
- Revenue and EPS growth of at least 25% over the past 12 months.
- A Net profit margin of at least 7%.
- Insiders holding of at least 10%.
- Average daily dollar trading volume is at least $1 Million but not more than $25 Million.
- Share Price of at least $7.
- Relative Price Strength rank (52W) in top 10 percentile in standard stock market
- Operating cash flow > 0
Small Companies
The most generic method of analyzing companies is market capitalization— number of outstanding shares of the company multiplied by its stock’s current market price. However, for the Foolish Small-Cap 8 screen, small companies are those that have annual revenue of $500 million or less. This screen is also designed to orient the investor’s mind towards buying a company and not just a stock. However, since sales are an industry-specific element, this screen will tend to eliminate industries that traditionally have high sales and low margins, such as grocery stores. The Foolish 8 Small-Cap screen filters companies that have shown growth in sales over the last four quarters (trailing 12 months).
Revenue and EPS Growth
One merit of considering the smaller companies is that they tend to have a greater potential for high growth. It is relatively easier for smaller companies to grow earnings and sales. The Foolish Small-Cap 8 screen looks for a minimum level of Y-O-Y growth in both revenue and earnings of at least 25%. Factoring such a high growth requirement is one way of finding quality small companies—provided the growth is sustainable. The Foolish 8 screen looks for a minimum 25% growth in revenue and earnings from continuing operations that do not include extraordinary items and discontinued operations.
Net Profit Margin
Net Profit Margin is the bottom line profit margin indicating how well management has been able to convert sales into earnings available for stakeholders. It is calculated by dividing net income by sales for the same period. Here, the screen looks for companies with a net margin of 7% or more for the last 12 months. Since profit margins are somewhat affected by the industry in which a company operates, it is common to compare the margins of a company to those of its related sector or industry.
Insider Holdings
The Foolish 8 Small-Cap screen looks for firms where insiders own at least 10% of their company’s shares. This criterion allows investors to find whether the interests of “outsider” shareholders are aligned with those of “insider” shareholders. It is generally better for a company to have some level of insider ownership than not. Who else is in a better position to know the future growth prospects of the company? Insiders have the information regarding new products, competition, and operating environment, long before the companies become large.
The Securities Exchange Act of 1934 defines an insider as a director or officer of a public company, or an individual or an entity owning 10% or more of any class of a company’s shares. Thus, the term refers to a wide-ranging group including officers, directors and large shareholders.
Although large shareholders are insiders in a legal sense, they are not aware of the same kind of information that top-level employees of the firm have access to. Directors are members of the board of directors of a company. Officers are those occupying the highest positions like CEO, CFO, vice president, president, and others.
Trading Volume
One demerit of investing in smaller companies is that their shares tend to be illiquid. The trading volume of the shares is low, and the spread between the stock’s ask and bid prices is high. If you own an illiquid stock and wish to sell it, you may have to discount the price to attract a buyer. Common screening strategies require a minimum level of trading volume or a minimum level of outstanding shares to avoid dealing in illiquid shares.
The Foolish Small-Cap 8 Screen, on the other hand, actively seeks companies that the Motley Fool considers to be relatively illiquid. In doing so, it forces the investors to take extra time to analyze small companies. Lastly, since it may be difficult to sell an illiquid stock, an individual must have a longer-term investment approach.
As a proxy for liquidity, the Foolish 8 screen makes use of average daily dollar trading volume. Volume is the total number of shares transacted. The daily average can be calculated using various time periods, but a daily average based on three months’ trading is common. Average daily dollar volume reflects the current price of a stock multiplied by its average daily volume. In order for a company to pass the Foolish 8 screen, its average daily dollar volume must be between $1 million and $25 million.
Price
While the Foolish Small-Cap 8 screen seeks attractive small companies, it does not want these companies to have a price that is too low. As a rule, it stays away from so-called penny stocks, which trade under $5 per share because these companies, historically, have been prone to manipulation and also lack financial data.
Also, the Foolish method of investing avoids the stocks that trade on Over-the-Counter Bulletin Board (OTCBB). For this reason, the MarketXLS Foolish 8 screen eliminates companies that are traded over-the-counter.
In looking at the stock price, the Foolish 8 screen raises the price requirement to $7 per share or greater. The strategy believes that prices reflect fundamental aspects of a company. If, after implementing all of the filters of the Foolish 8 screen, a company does not have a share price of $7 or more, it may be a sign of some underlying fundamental problem with the company.
Performance
Just like price, relative price strength also reflects certain fundamental aspects of a company. High price performance relative to the stock market shows that the market is recognizing the company’s value and is driving up the price of the stock at a rate better than that of a majority of other stocks. In this case, the Foolish 8 screen looks for firms whose stock price has outperformed 90% of the stock universe.
The most common time frame in examining relative strength is 52 weeks. In other words, over the last 52 weeks, the stock should perform in the top 10% of the entire stock market database.
Cash Flow
The final parameter of the Foolish Small-Cap 8 screen deals with cash flow, specifically cash flow from operations, and requires that a company’s figure be positive.
Cash flow from operations is found on the cash flow statement, and includes adjustments to net income, such as adding non-cash expenses (amortization, depreciation, etc.) and changes in working capital accounts (accounts receivable, accounts payable, inventory). The rapidly growing small companies have the ability to control their working capital accounts which often determines whether they can sustain in the market. In order for small companies to continue rising, they need to target ways to fund inventories (a cash outflow that lowers operating cash flows) and collect on accounts receivable (increasing accounts receivable also lowers operating cash flows).
Using The Foolish Small-Cap 8 Screen Template With MarketXLS Screener:
MarketXLS software is a one-stop solution for the analysis of your entire investments. It provides a host of functions like eps, various ratios, key fundamentals, historical data, options pricing and much more to assess the value of your investments. It provides a variety of templates for various options trading strategies and Guru screen strategies to compare your portfolio stocks for doing a better analysis of your investments.
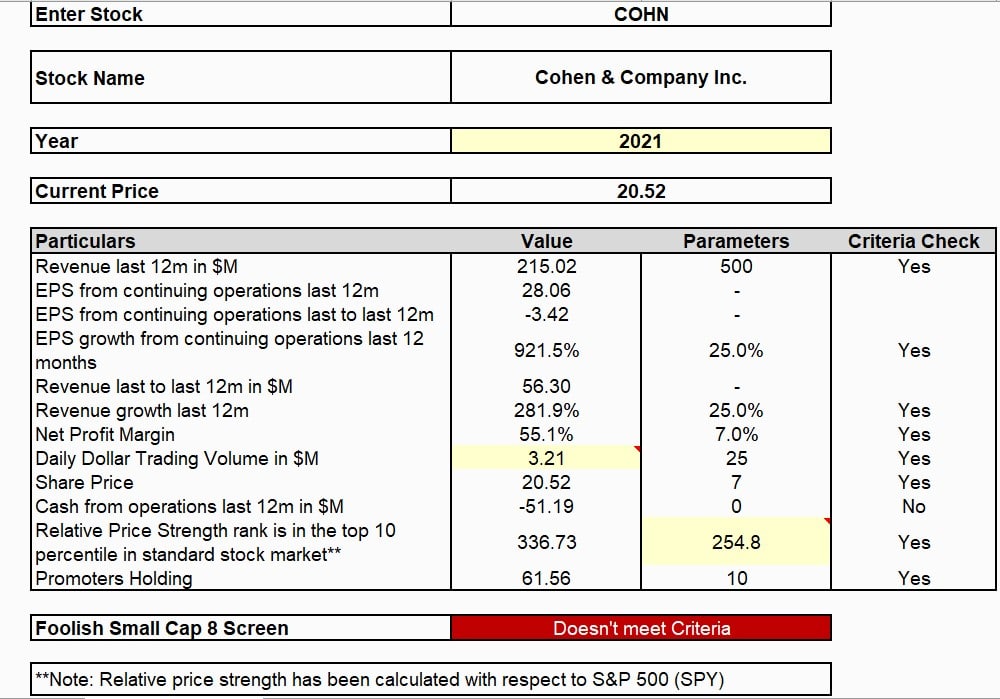
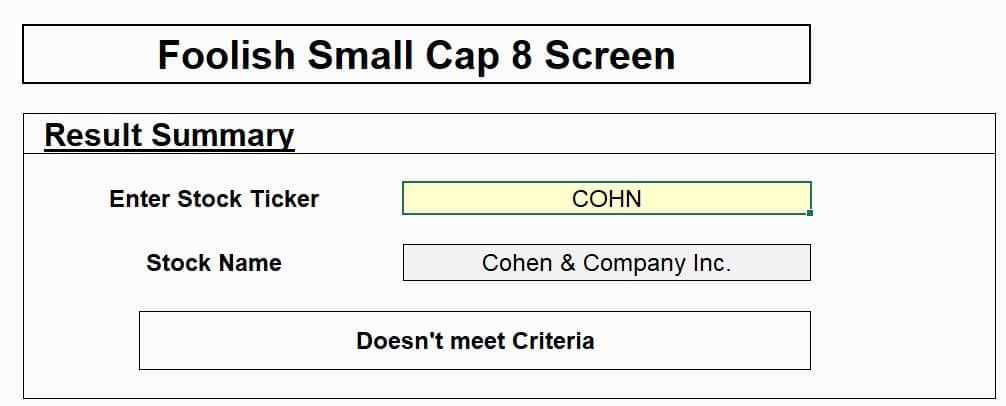
Step 1: Enter the stock ticker in cell E7 and press Enter. I have taken the stock of Cohen & Company Inc. (COHN) as a reference. It is a small-cap publicly owned investment managing firm primarily providing services to institutions and individuals. It manages separate client-focused fixed income portfolios and also manages funds and collateralized debt obligations for its clients.
Step 2: Move to the active template page and enter the current year. The template will pull out all the required values and check them against the parameters of the screen. If a particular criterion satisfies the mentioned parameter, the criteria check column will give a Yes, otherwise No.
Link to the Template: https://marketxls.com/template/foolish-small-cap-8-screen/
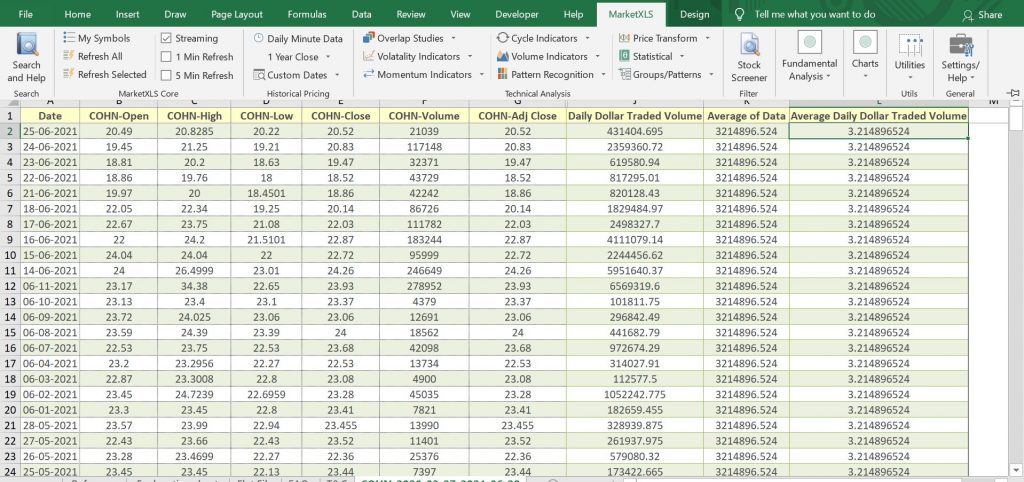
Step 3: The yellow cells will require input from the user. To calculate the daily dollar trading volume, select the ticker cell, click on Custom Dates in the MarketXLS tab and select MarketXLS Historical data. Select the data for at least the previous three months. Now take the average of opening and closing price for all the rows and multiply with the respective volumes. Then calculate the average of newly calculated daily dollar traded volumes. The same procedure has to be repeated while analyzing any other stock as well as after each trading day.
Step 4: To calculate the relative price strength of the entire stock universe for a parameter value, go to MarketXLS Tab>Utilities>Useful Lists>S&P 500. Use the function
=StockReturnOneYear(Ticker cell)/StockReturnOneYear(“SPY”)*100
for all the stocks listed on S&P 500 and then use the formula =Percentile.inc (RPS array,0.9). The value came as 254.8 on the day of screening COHN. The same value might be readily available on popular websites as well.
COHN passes all the parameters except the positive cash flow one. Therefore, the template shows “Doesn’t Meet Criteria”.
The MarketXLS software also has a Foolish Small-Cap 8 Guru function (=gs_foolish_small_cap_8_screen)
to find out whether a stock fits in all the criteria or not. Just like this, there are plenty of other Guru functions as well.
(The same process and working has been explained thoroughly in the template as well)
Bottom Line
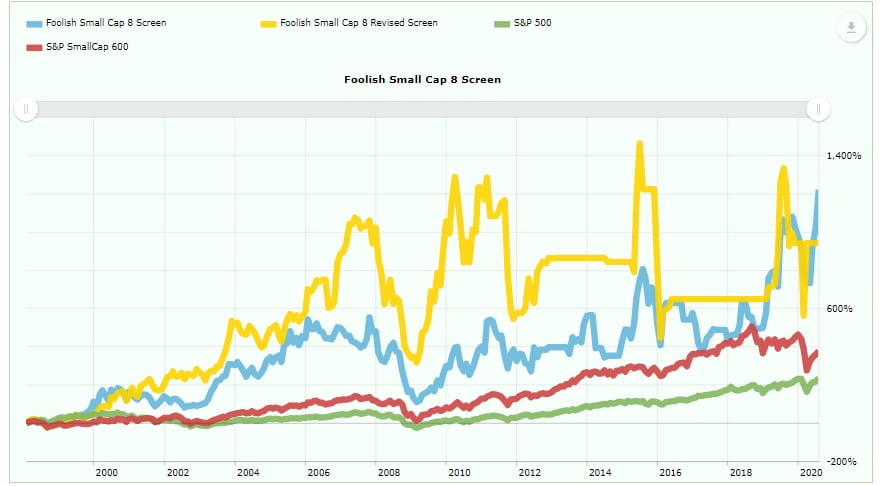
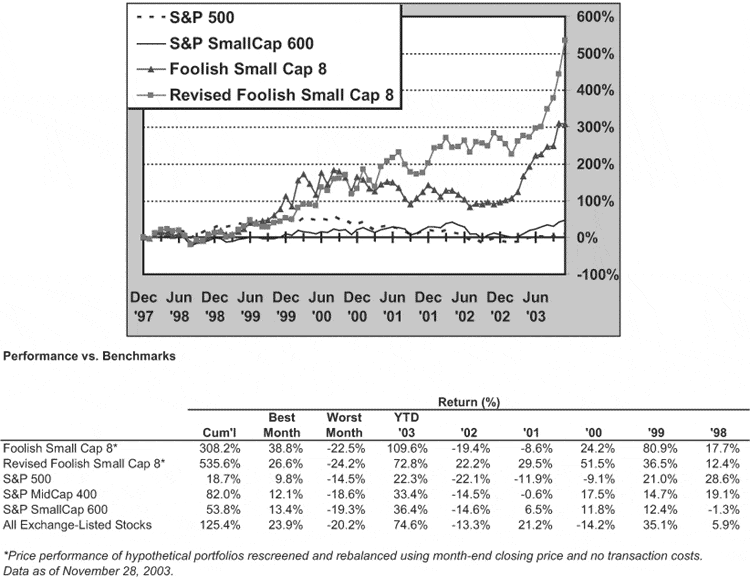
Based on back-testing performed from 1997-2003, both the Foolish Small-Cap 8 screen and revised Foolish small cap 8 screens had outperformed the small, mid, and large-cap indexes by a wide margin over that time period. On the other hand, the original Foolish 8 screen lagged the S&P Mid-Cap 400 and Small-Cap indexes in 2001 and 2002 and the S&P 500 and Mid-Cap 400 in 1998.
While we know that companies passing both Foolish screens must have strong short-term growth in earnings and sales, it is important to look at the companies’ longer-term performance as well.
Stock screening such as this is a useful way of identifying potential investment candidates. However, the Motley Fool™ states that the final list of companies passing the two Foolish 8 screens, is by no means a buy or recommended list. It is up to you to perform your own due diligence to decide whether the companies can truly outperform the market.
The values used to screen stocks are based on past data and there is no guarantee that these values will be repeated in the future. Hence the investors are suggested to further analyze and keep checking the stock performance on a regular basis.
Disclaimer
All trademarks referenced are the property of their respective owners. Other trademarks and trade names may be used in this document to refer to either the entity claiming the marks and names or their products. MarketXLS disclaims any proprietary interest in trademarks and trade names other than its own, or affiliation with the trademark owner.
