Portfolio X-Ray
See what your portfolio
is actually made of.
Enter your holdings. One report scores the portfolio out of 100, shows what you really own underneath the funds, what the fees take, how it held up when markets fell, and where the risk is actually concentrated.
No spreadsheet. No linking your brokerage. No subscription.
Your score is free, on screen. The full seven-page report is $25, one time. No subscription, and a refund if you ask.
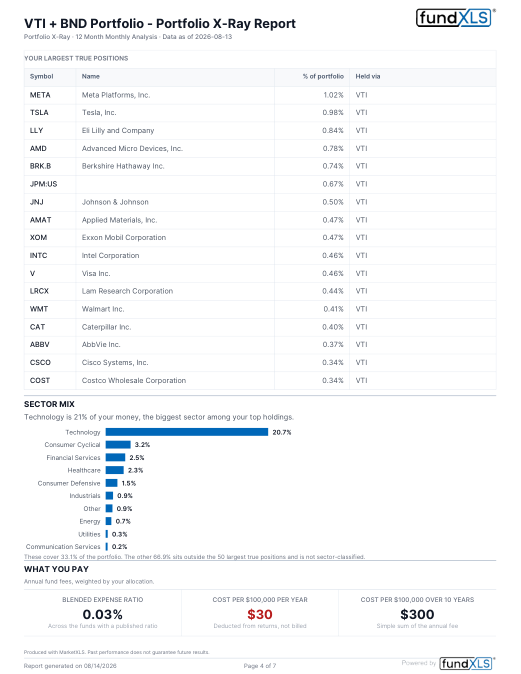
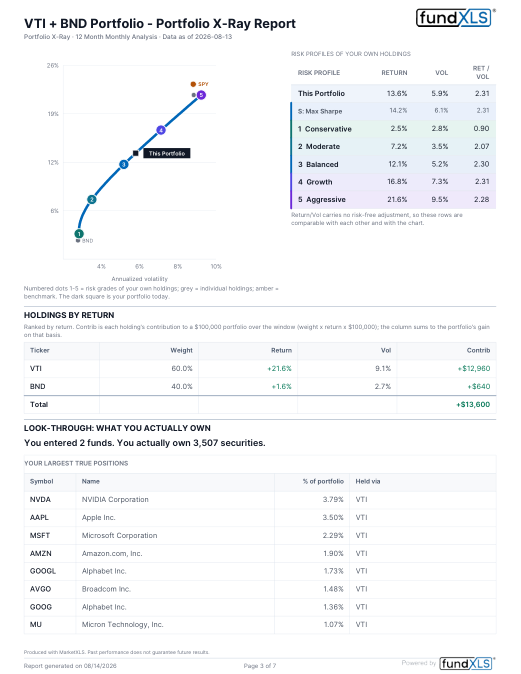
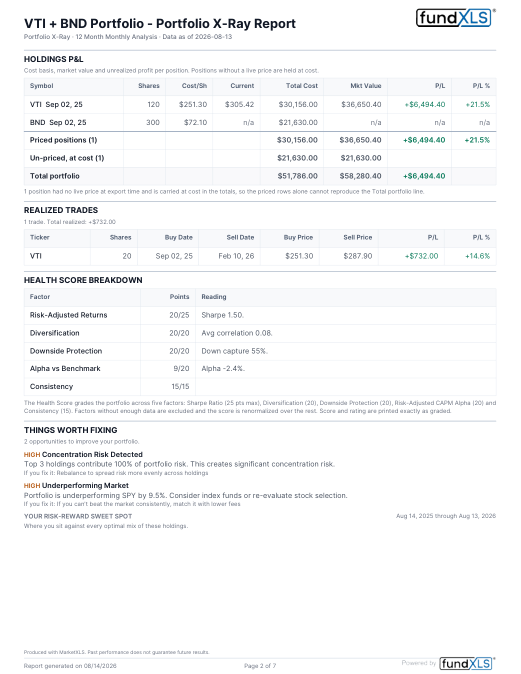
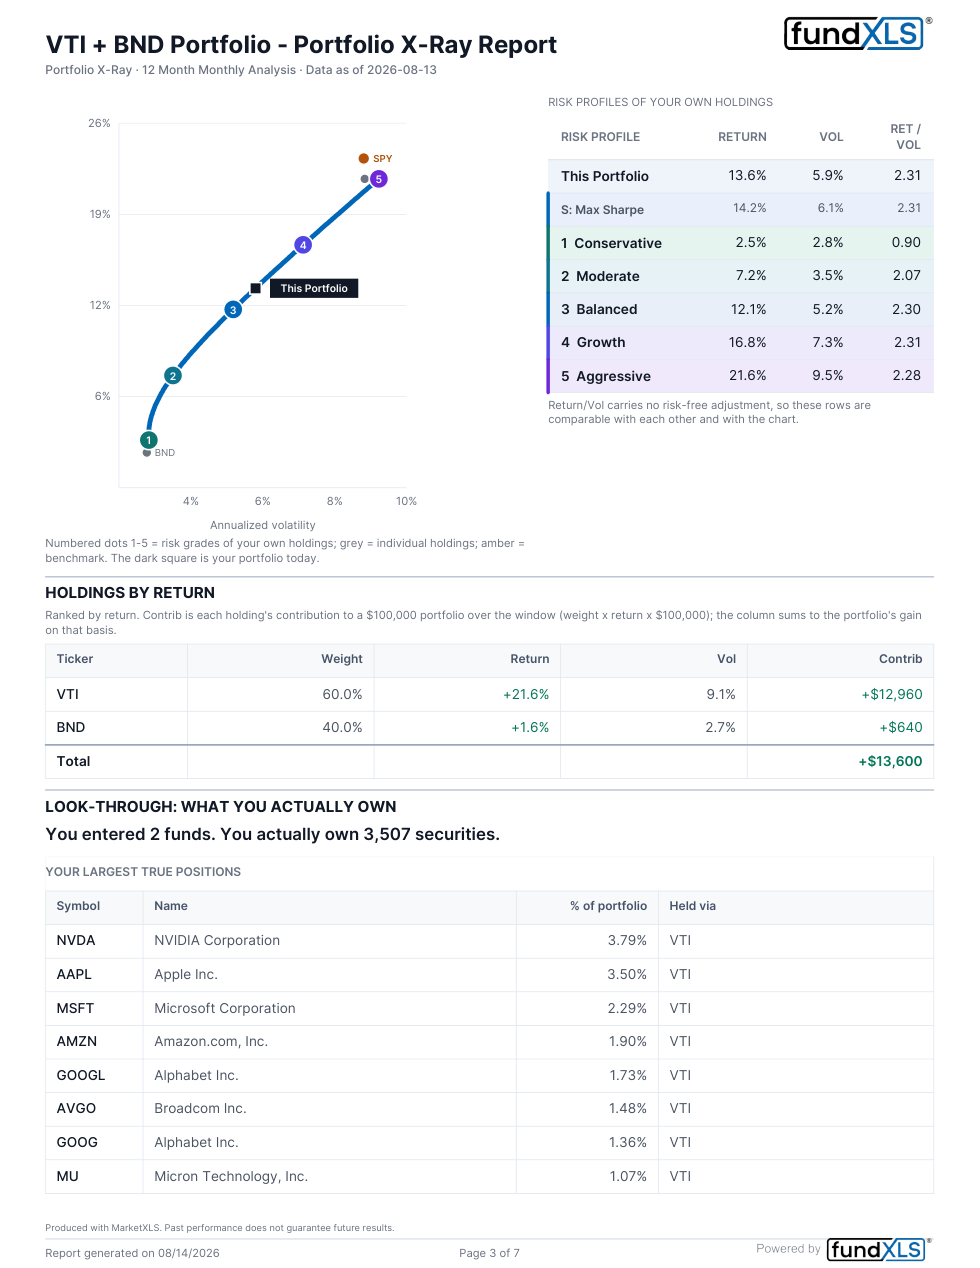
Seven pages, generated by the same pipeline yours will use. Read the whole sample
What is in the report
Every line below is a section of the seven pages. Nothing is described here that the sample does not contain.
A grade out of 100, broken into the five factors behind it, so the number is arguable rather than mysterious.
Return, volatility, Sharpe, max drawdown, beta, alpha, Sortino, Calmar, VaR, win rate, index gap, information ratio.
Your mix and the S&P 500 from the same starting dollar, with the gap in dollars.
Equity funds unpacked to what they hold. The sample turns 2 funds into 3,507 securities. Bond funds and funds of funds resolve partially, and the report names what it could not resolve.
Ranked after look-through, each showing the funds it arrives through, and flagged when you hold it through more than one.
Blended expense ratio applied to your allocation, per $100,000 per year and over ten years.
How the mix behaved in a crash, a recession, rising rates and a bull run. Historical and hypothetical, not forecasts.
Skew, kurtosis, CVaR, and a correlation matrix showing which holdings move together.
Five risk grades of your own funds plus a max-Sharpe mix, with the trades implied by whichever one you pick.
The window, the risk-free rate, how each factor is scored, and what the look-through does and does not resolve.
Free on screen. The full report is $25, one time. No subscription, and a refund if you ask.
How it works
Enter your tickers
Paste them or type them. Nothing to install, no brokerage login, no account needed to see your score.
See your score first
The health score and headline numbers are free, on screen, before you decide anything.
Pay $25 once
The full report downloads immediately. One payment, no subscription, and a refund if you ask.
How the numbers are produced
- Holdings and prices come from QuoteMedia, Nasdaq and the funds' own filings. Fund holdings are published on a lag, and the report prints the as-of date it used rather than implying live data.
- The score grades five factors: risk-adjusted return, diversification, downside protection, alpha against the benchmark, and consistency. Factors that cannot be graded are excluded and the score is renormalised, which the report states on the page.
- Look-through resolves funds that hold securities directly. A fund of funds, including a target-date fund, unwraps one level to the funds inside it and stops there. The report says so where it applies.
- The analysis covers the trailing 12 months of monthly prices, and the benchmark is SPY, the fund that tracks the S&P 500, rather than the index itself. Positions with no live price are carried at cost, which the report states where it applies.
- Scenarios are historical and hypothetical. They are not forecasts.
See what you actually own
Enter your tickers, see your score on screen, and decide then. If you want the seven pages, they are $25, once, and yours to keep.
Free on screen. The full report is $25, one time. No subscription, and a refund if you ask.
FundXLS is a product of MarketXLS Limited. It is an information tool, not an investment adviser, and nothing in the report is investment advice or a recommendation to buy or sell any security. Past performance does not indicate future results. Fund holdings are reported on a delay and may be inaccurate or incomplete.