A sample Portfolio
X-Ray report

Generated by FundXLS on a real 27-position portfolio worth $3.15 million. It tells you, in detail, what you own underneath your funds, what the fees take in dollars, how the book behaved when markets fell, and which holdings are really the same bet. All 11 pages are beside this, and every section is explained below.

Generate reports with FundXLS

FundXLS Pro, $149 a year or $45 a quarter. Run the report as often as your portfolio changes, plus the ETF and mutual fund research tools.
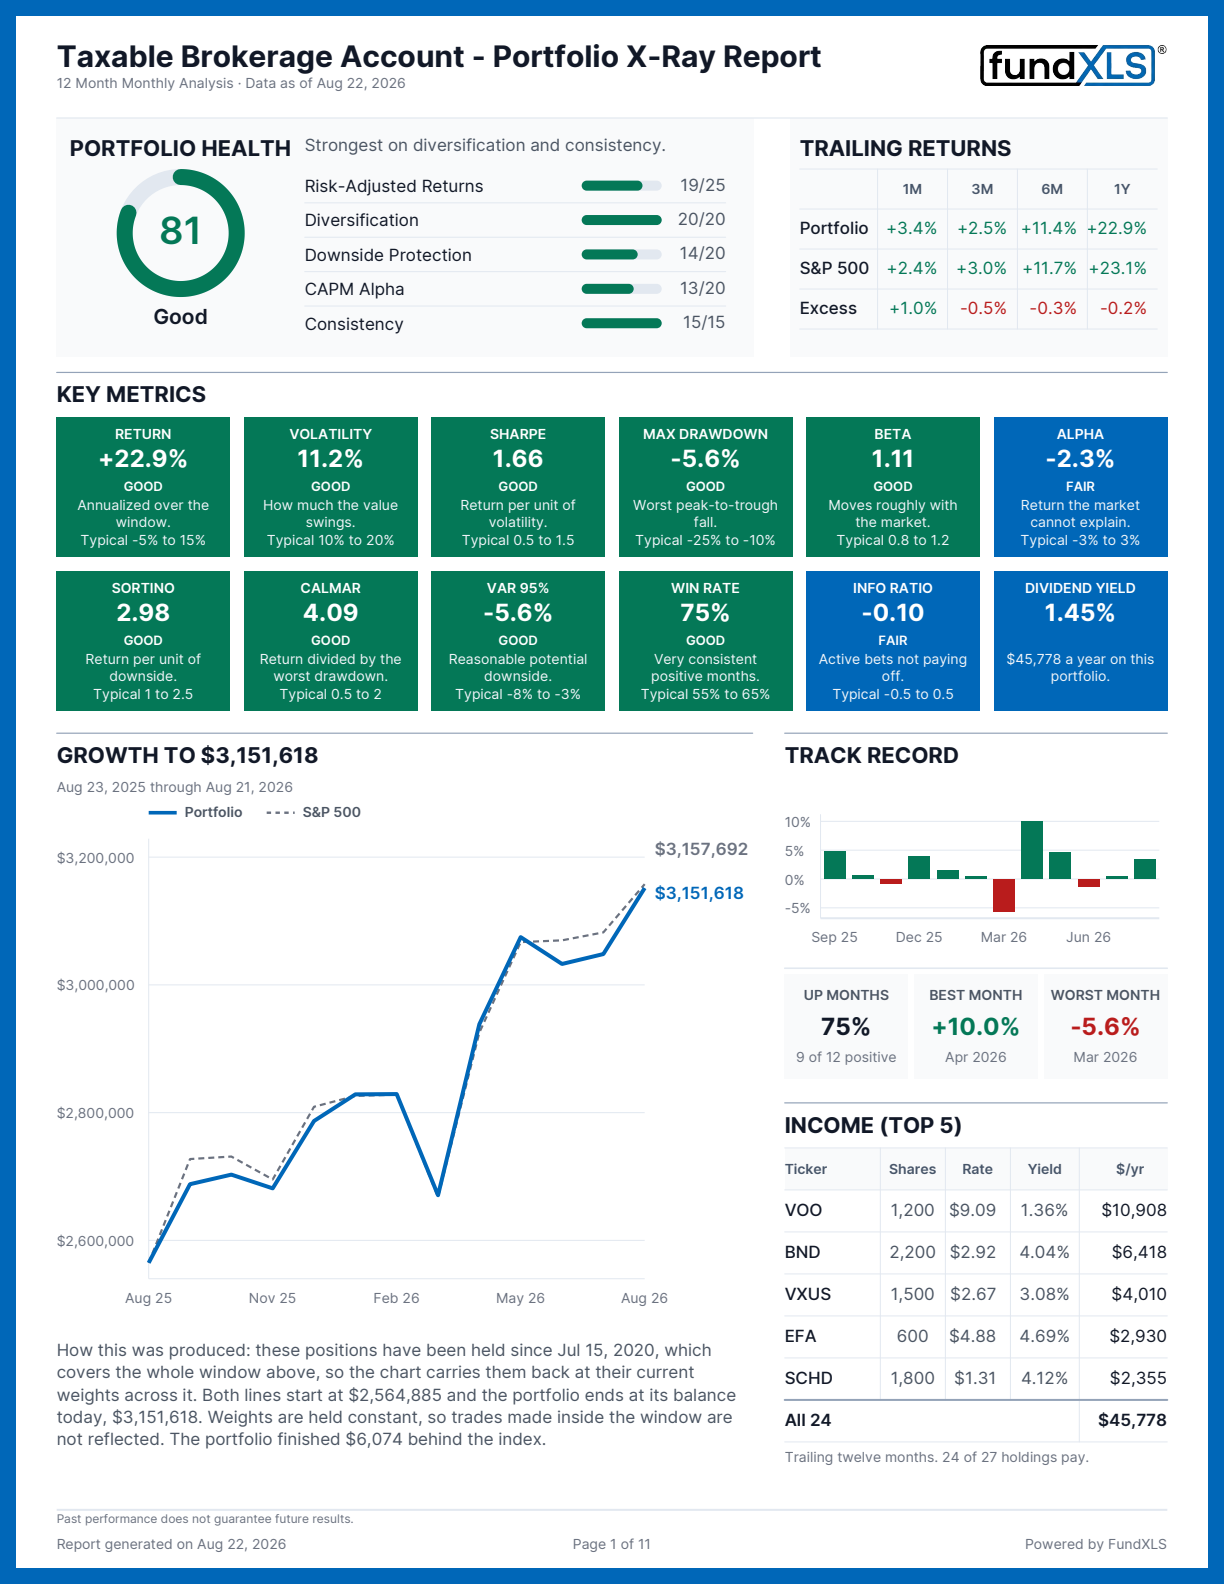
Page one of the sample Portfolio X-Ray report: a health score of 81 out of 100 broken into five scored factors, twelve metric tiles, a growth chart and an income table

Scroll it here, or open it full screen.

What does each section tell you?

Every panel below is cropped from the sample above, not redrawn for this page. The figures quoted are the ones the report printed.
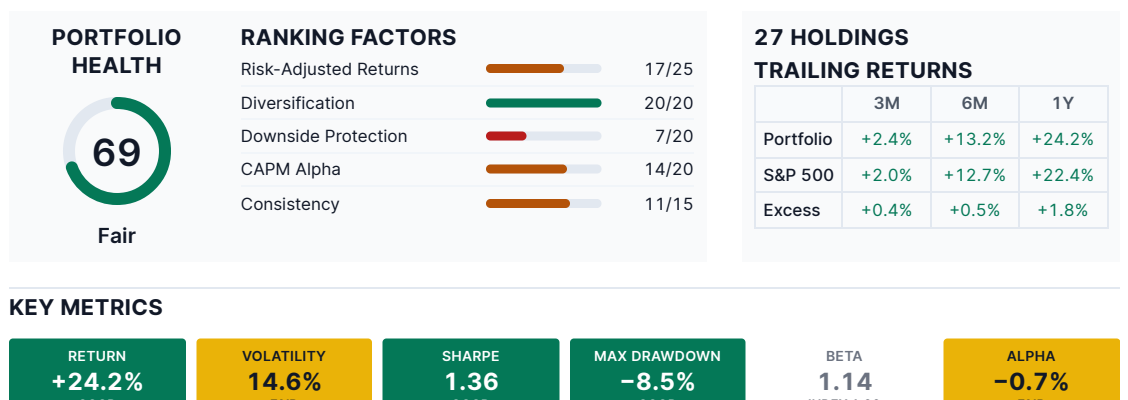
The portfolio health panel from the sample report, scoring 81 out of 100 across five factors

Portfolio health score

Is this portfolio in good shape, and where is it weakest?

A grade out of 100, split into the five factors that produced it and scored separately, so the number can be argued with instead of taken on trust. The sample scores 81, and its weakest factor is downside protection at 14 out of 20.

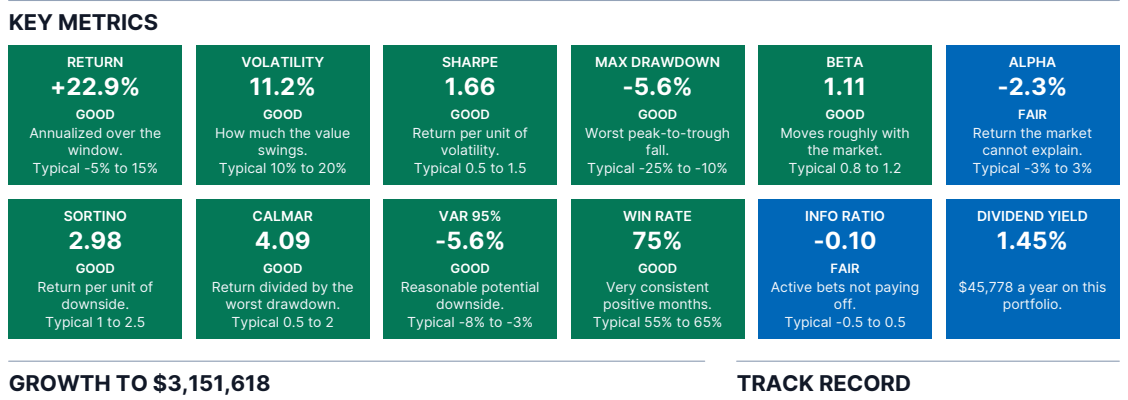
Twelve metric tiles from the sample report, each showing a value, a quality band and a typical range

Twelve risk and return figures

How do my numbers compare with what is normal?

Return, volatility, Sharpe, drawdown, beta, alpha, Sortino, Calmar, VaR, win rate, information ratio and dividend yield. Each prints its typical range beside it, so a figure is readable without already knowing the statistic.

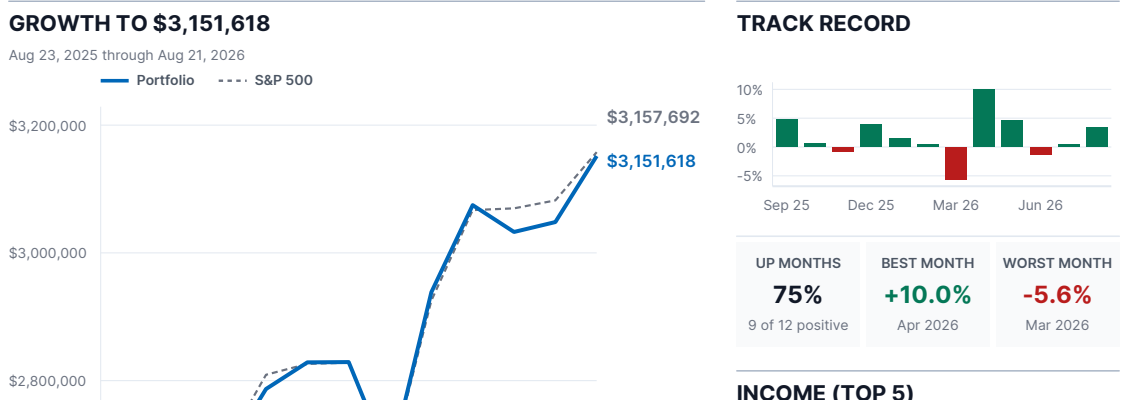
The growth chart from the sample report, portfolio against the S&P 500, with a monthly track record

Growth against the index

Would I have been better off in the S&P 500?

Both lines from the same starting dollar and ending in dollars rather than percentages, with the month-by-month record beside it. The sample finished $6,074 behind the index over the window.

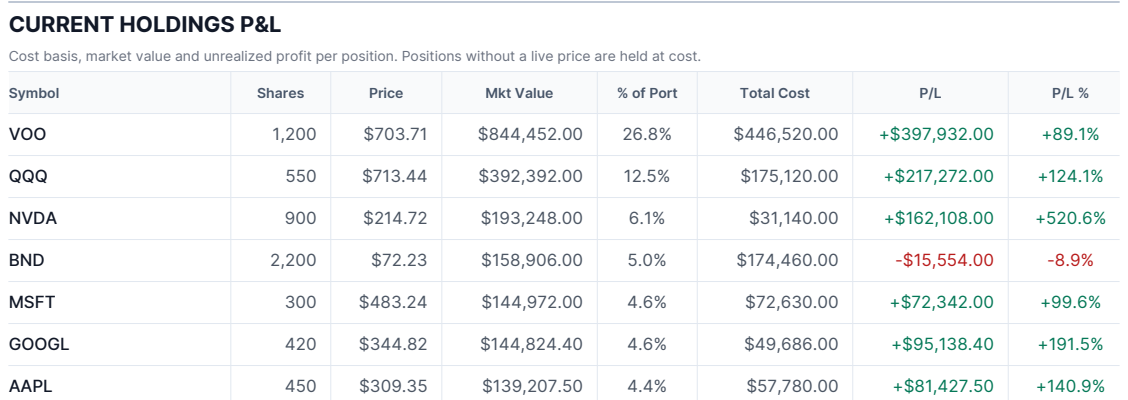
The current holdings profit and loss table from the sample report

Current holdings P&L

What is each position worth now, and what has it made?

Shares, price, market value, weight, total cost, profit and profit percent for every position, with a total row that sums the column above it. This one needs a cost basis; without one the report names the omission on its last page instead of leaving a gap.

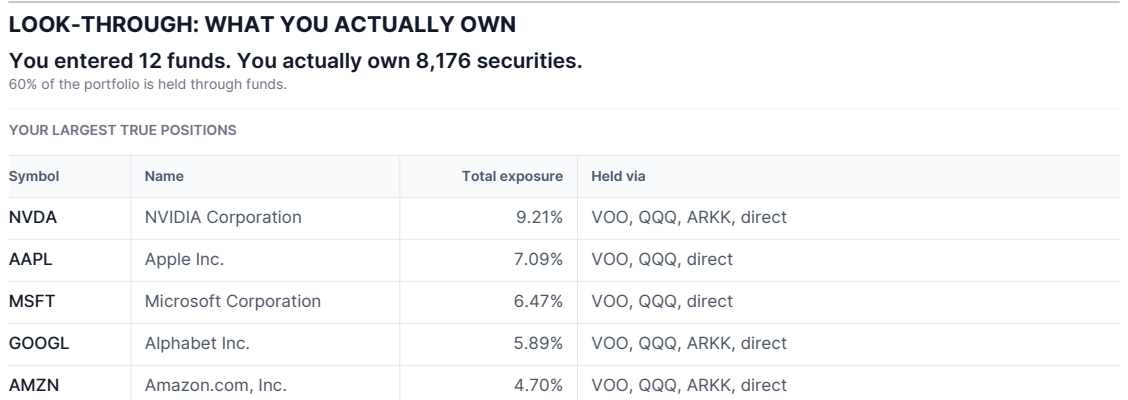
The look-through section from the sample report, resolving 12 funds into 8,176 securities

Look-through to the securities

What do I actually own underneath the funds?

Every fund resolved to the securities inside it, and each name showing the funds it arrives through. The sample turns 12 funds into 8,176 holdings and lands NVIDIA at 9.21% of the money against the 6.1% held directly, because three of the funds hold it too.

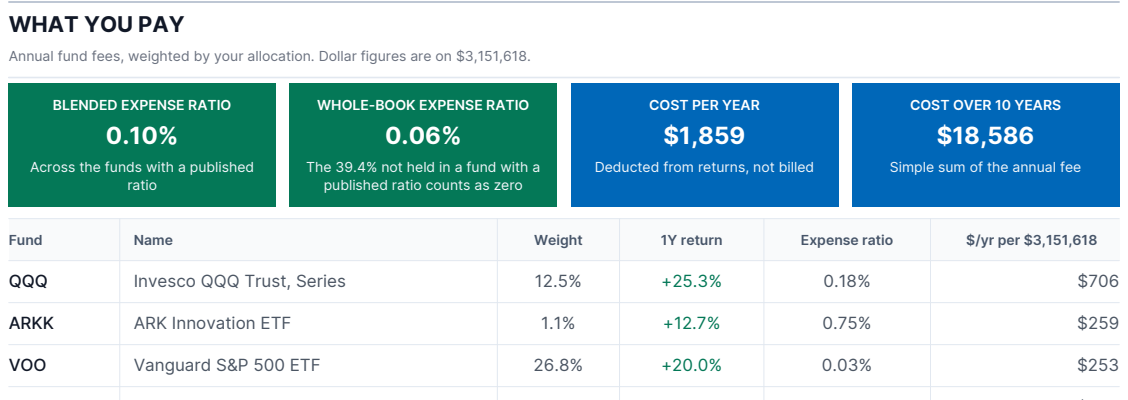
The fee section from the sample report, showing blended expense ratio and cost in dollars

Fees in dollars

What is holding this costing me?

The blended expense ratio applied to your own allocation and printed as money: $1,859 a year and $18,586 over ten years in the sample, with every fund costed separately rather than averaged into a single figure.

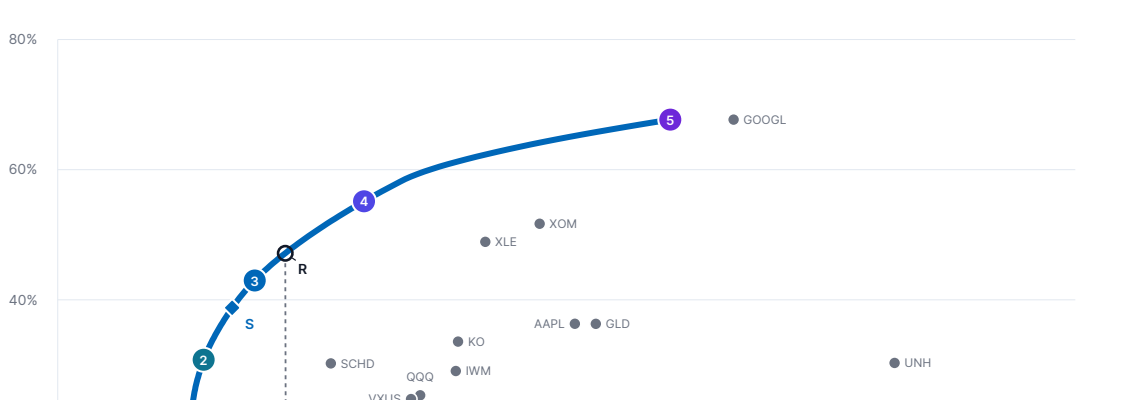
The efficient frontier chart from the sample report with the portfolio plotted against optimal mixes

Risk against reward

Am I being paid for the risk I am taking?

Where the book sits against the efficient frontier built from its own holdings, with five graded mixes plotted beside it. Positions on the curve are measurements of the same holdings at different weights, not recommendations.

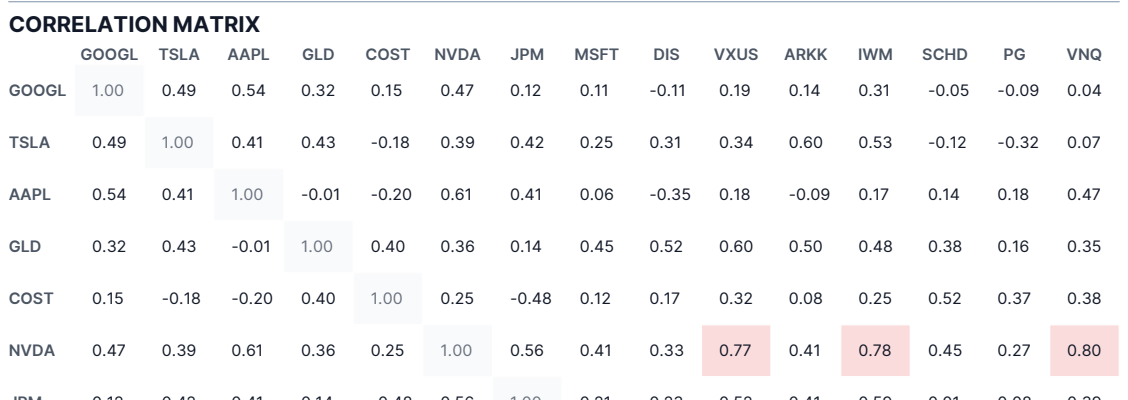
The correlation matrix from the sample report, every holding pair scored

What moves together

Which of my holdings are really the same bet?

Every pair scored against every other, with anything above 0.90 called out separately. Two holdings correlated at 0.98 are one position wearing two tickers, and a pie chart will never show it.

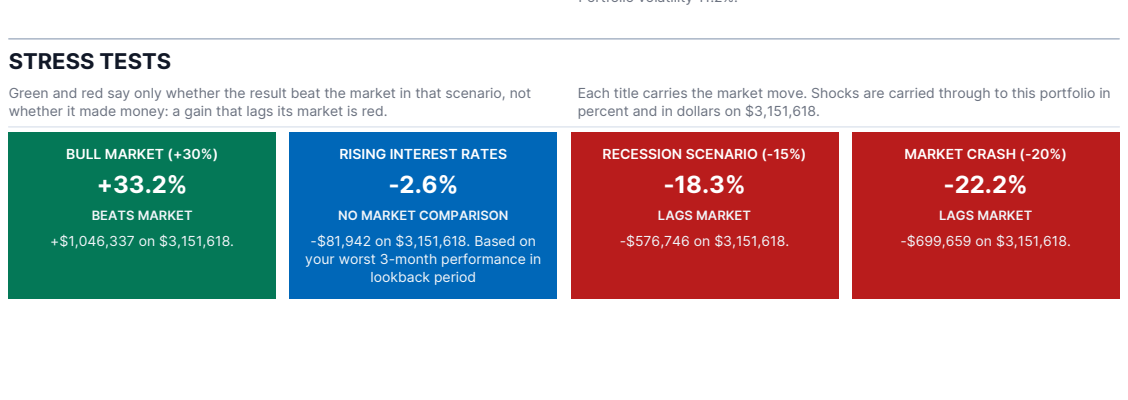
Four stress scenarios from the sample report: market crash, rising rates, recession and bull market

Stress tests

What happens to this in a crash?

Four scenarios, each showing the portfolio move against the market move so being down less is legible as the result it is. Historical and hypothetical, and labelled as such: nothing here is a forecast.

Run it on your own holdings

The sample above came out of the same pipeline your reports will, on live prices and published fund holdings.

Generate reports with FundXLS

FundXLS Pro, $149 a year or $45 a quarter. Run the report as often as your portfolio changes, plus the ETF and mutual fund research tools.

FundXLS is a product of MarketXLS Limited. It is an information tool, not an investment adviser, and nothing in the report is investment advice or a recommendation to buy or sell any security. Past performance does not indicate future results. Fund holdings are reported on a delay and may be inaccurate or incomplete.