
Table of Contents
- Introduction
- Understanding What Z-Score Is: How to Find the Z Score in Excel
- Step-by-Step Guide: How to Calculate Z-Score and Find It in Excel
- what is the formula for Z score in Excel?
- Using MarketXLS: How to Find the Z Score in Excel for MarketXLS Users
- What is a good range for Z Score when analyzing the company?
- Summary
Introduction
Are you looking to make smarter investment decisions or better assess the risk of your portfolio? Understanding the Z-score can help. It’s a powerful tool used by investors and analysts to measure how far a data point, like a stock price, deviates from the mean, in terms of standard deviations. This simple yet profound concept can highlight whether a stock is overvalued or undervalued. And the best part? You can easily calculate the Z-score in Excel. Let’s dive into what a Z-score is, its importance in finance, and how you can find it using Excel.
Understanding What Z-Score Is: How to Find the Z Score in Excel
Understanding how to find the Z score in Excel is crucial for investors and financial analysts, as a Z-score measures the deviation of a data point from the mean in terms of standard deviations. This statistical tool helps assess whether a stock is overvalued or undervalued compared to its historical performance. For instance, a high Z-score indicates that the stock’s price is significantly above the mean, suggesting overvaluation. Conversely, a low Z-score signals undervaluation. Investors use Z-scores to identify stocks that may be considerably riskier or safer than the average, making it invaluable for risk assessment and portfolio management. Thus, Z-scores provide critical insights into investment decisions.
Step-by-Step Guide: How to Calculate Z-Score and Find It in Excel
In finance and investing, the Z-Score is a statistical measurement that helps assess the volatility or relative risk of an investment. Calculating it involves subtracting the mean return of a dataset from the specific data point, then dividing the result by the standard deviation of the dataset. This formula standardizes the data point, showing how many standard deviations it is from the mean. Investors use the Z-Score to compare different assets or portfolios, allowing them to gauge relative performance and make more informed decisions. A Z-Score above zero indicates performance above the mean, while a negative score signifies underperformance. It’s a quick way to measure and manage investment risks.
what is the formula for Z score in Excel?
In Excel, the formula for calculating the Z score is `(data point – mean) / standard deviation`. This formula standardizes data points within a dataset, allowing for meaningful comparisons. In investing and finance, Z scores help identify the relative position of a value in a distribution, such as stock returns or portfolio performance. By doing so, investors can spot anomalies or trends. For instance, a Z score above 2 or below -2 may indicate potential trading opportunities or risk factors. This statistical measure is essential for risk management and predictive models in financial analysis. It allows for a more nuanced understanding of market behavior.
Using MarketXLS: How to Find the Z Score in Excel for MarketXLS Users
The Z-score in Excel can be computed using the following formula:
\[ Z = \frac{X – \mu}{\sigma} \]
Where:
– \(X\) is the value.
– \(\mu\) is the mean of the dataset.
– \(\sigma\) is the standard deviation of the dataset.
To calculate the Z-score for a value in Excel, you would generally follow these steps:
1. Calculate the Mean (\(\mu\)) of the dataset:
– Use the AVERAGE function.
=AVERAGE(range)2. Calculate the Standard Deviation (\(\sigma\)) of the dataset:
– Use the STDEV.P function for population standard deviation or STDEV.S for sample standard deviation.
=STDEV.P(range)3. Compute the Z-score:
– Use the formula listed above and combine functions properly.
= (X - AVERAGE(range)) / STDEV.P(range)For instance, if your data is in cells A1 to A10 and the value for which you want to calculate the Z-score is in cell B1, the formula would look like this:
= (B1 - AVERAGE(A1:A10)) / STDEV.P(A1:A10)Using MarketXLS, certain functions (like Standard Deviation) are used in similar contexts to derive performance analytics or volatility calculations for stocks and other securities. For instance, the function StandardDeviationOneYear measures a stock’s price volatility over the past year:
=StandardDeviationOneYear("MSFT")Similarly, the AltmanZScore function can be used to assess the financial health of a company:
=AltmanZScore("MSFT")These functions demonstrate advanced usage related to analyzing financial data in Excel, powered by MarketXLS .
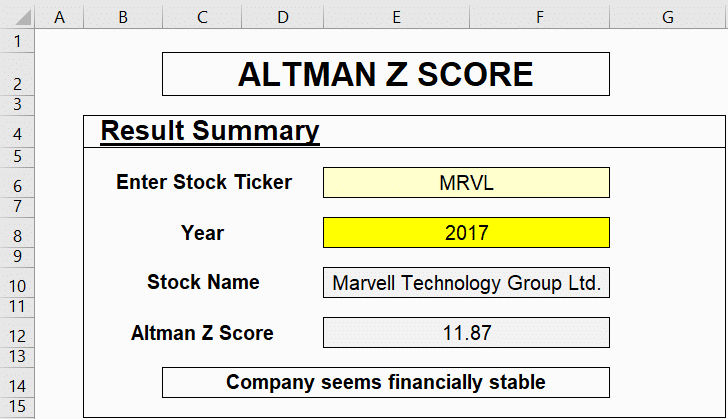
Here is the template you might want to checkout and MarketXLS has 100s of templates to get you started easily and save you time. You can learn about the “Altman Z Score” template:
What is a good range for Z Score when analyzing the company?
1. Z-Score above 3.0:
– This indicates that the company is in a safe zone with a low probability of bankruptcy. Companies scoring higher than 3.0 are generally considered financially stable.
2. Z-Score between 1.8 and 3.0:
– Companies in this range are in the “gray” zone. They are at a moderate risk of bankruptcy and warrant closer scrutiny.
3. Z-Score below 1.8:
– This is a red flag zone, indicating a high probability of bankruptcy. Companies scoring less than 1.8 are considered to be in financial distress or at high risk of filing for bankruptcy.
You can calculate the Altman Z-Score in MarketXLS using the function =AltmanZScore("SYMBOL") to get the current Z-Score for any publicly traded company.
By regularly monitoring the Z-Score alongside other financial metrics, investors and analysts can make informed decisions about the financial health and sustainability of a company.
Here is the template you might want to checkout and marketxls has 100s of templates to get you started easily and save you time.
Link to the template: Altman Z Score
Image URL: !Altman Z Score Image
.
Summary
A Z-score measures how far a data point is from the mean, useful for investors. High Z-scores indicate overvaluation; low scores show undervaluation. Investors use Z-scores to gauge stock risks and make better decisions. To find the Z-score in Excel: 1. Calculate the mean using `=AVERAGE(range)`. 2. Calculate standard deviation using `=STDEV.P(range)`. 3. Use the formula `= (data point – AVERAGE(range)) / STDEV.P(range)`. MarketXLS users can use functions like `=StandardDeviationOneYear(“MSFT”)` and `=AltmanZScore(“MSFT”)` for advanced analysis.
