How to hedge a drop in S&P 500 Using MarketXLS

With market valuations rising, many investors are concerned about the likelihood of a market crash, which is traditionally defined by losses of more than 20% over a 12-month period. While these crashes are rare, prudent investors have hedging techniques in place to protect themselves from unexpected losses. A hedge is a strategy for reducing the risks associated with an investment. A hedge is an instrument or method that increases in value when the value of your portfolio decreases. As a result, the hedging profit covers part or all of the portfolio’s losses.
Rather than focusing on specific risks, most investors prefer to protect their entire stock portfolio from market risk. As a result, investors hedge at the portfolio level, normally with a market index-related instrument.
The Long Put Position
The simplest, but also most expensive hedge is a long-put position. Puts on S&P 500 ETFs or S&P futures are available to investors. Typically, an option with a strike price of 5 to 10% below the current market price is used. These options will be less expensive, but they will not protect the portfolio from the initial 5% to 10% drop in the index.
One issue with the put option strategy is that during a large downturn, option premiums are inflated due to increased volatility. Basically, what that means is that an investor could be on the right track but still lose money. Selling short is usually not a good idea for someone who is merely dabbling in the markets.
Buying just before a fall is the first essential to making the short approach work. Shorting and buying puts offer the advantage of allowing investors to profit directly on a dip in the S&P 500. Unfortunately, this puts them at risk of losing money if the S&P 500 rises, which it generally does. Another important aspect of successful shorting is getting out promptly when the market rises.
How Can MarketXLS Help?
MarketXLS has templates readily available for lightning-fast analysis. Here’s a snapshot of the template
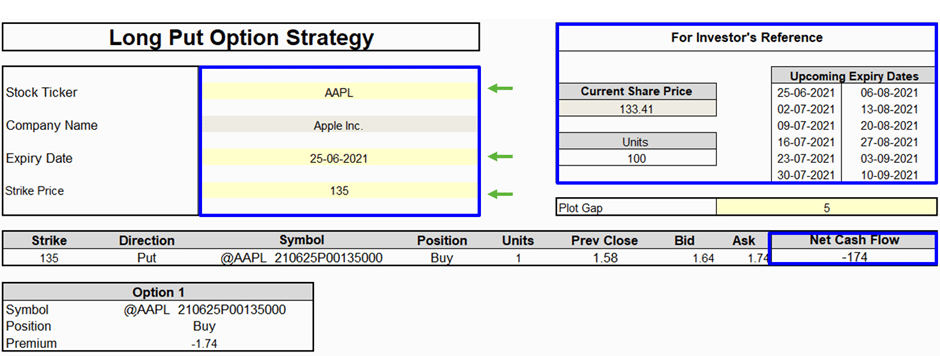
The cells in which the user has to enter his inputs have been highlighted in yellow – Stock Ticker, Expiry Date, Strike price, and the plot gap.
And that is all!
The template will automatically show you the net cash flow and the payoff profile even before you blink your eye.
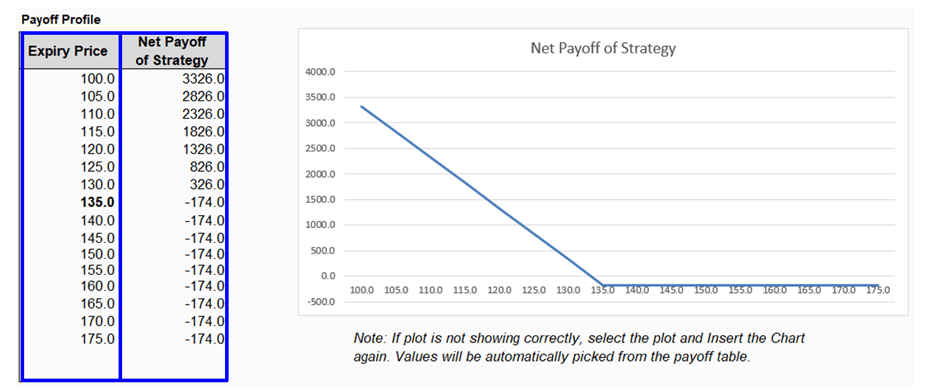
The Net Payoff table helps the user to observe the potential profit/loss at different expiry levels along with the Net Payoff Diagram for a better understanding of the strategy implementation. The table contains the Net Payoff of the Strategy at different expiry prices. It also shows the maximum loss and maximum profit that you can make based on the data inputs given by you.
To learn more, you can view the video on the Long Put Option strategy at https://www.youtube.com/watch?v=hNH61BrIpsE
The Covered Call –
A covered call is a financial transaction in which an investor sells call options on his assets and earns an option premium. This is mainly done by investors who hold shares for a long period but are skeptical about the price movement in the short run. Instead of depending only on the rise in the value of shares, investors make use of it by selling call options on their underlying assets. It’s like renting out an asset. A trader who doesn’t own stocks can also leverage this strategy. He can buy stocks at a current price and write off options on the stocks. One can also sell options without having them just like shorting stocks. This is called writing. However, there are certain things that need to be looked into while using this strategy. The approach will also vary with the goals of a trader
Before getting into a trade
- Stock types: This strategy works best with stable stocks. As long as the beta is 1 or less than 1 you are good to go. Because one doesn’t know, a stock may plummet to 0.
• Volatility: A stock can be stable but the volatility in the market can drive the best of stocks crazy.
• Trader’s attitude: Knowing what one wants from trade is equally important. An investor might hold a stock very dear and only look to earn from a premium. But a trader might want to gain from both intrinsic and extrinsic values.
These are some of the factors a trader can look for before jumping in with this strategy. However, after the trades are executed the adjusting of options varies with the attitude of a trader. An investor should only get into a trade if he anticipates it to go down so that he gets to keep his shares.
How Can MarketXLS Help –
MarketXLS has templates readily available for lightning-fast analysis. Here’s a snapshot of the template 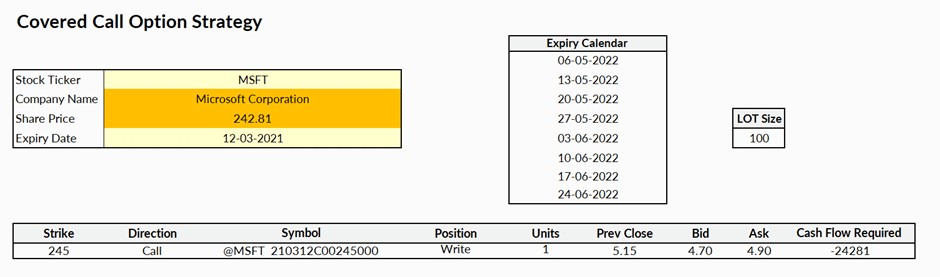
The cells in which the user has to enter his inputs have been highlighted in yellow – Stock Ticker, Expiry Date and the Strike price.
The template will automatically show you the net cash flow and the payoff profile even before you blink your eye.
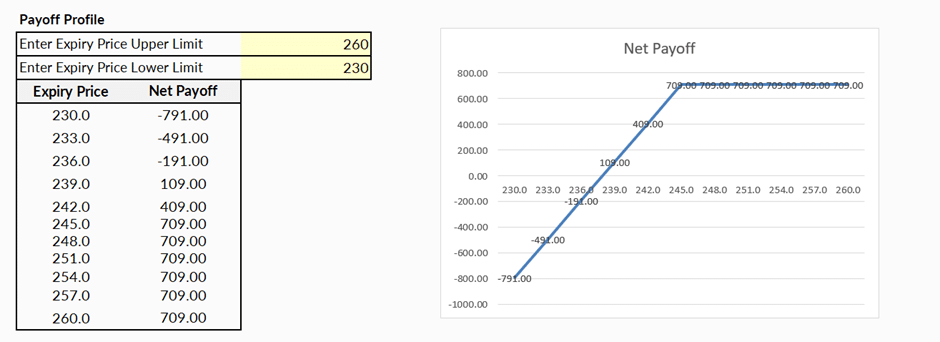
The Net Payoff table helps the user to observe the potential profit/loss at different expiry levels along with the Net Payoff Diagram for better understanding of the strategy implementation. The table contains the Net Payoff of the Strategy at different expiry prices. It also shows the maximum loss and maximum profit that you can make based on the data inputs given by you.
To learn more, you can view the video on Covered Call Option strategy on https://www.youtube.com/watch?v=E1gWIG8TtAU
Inverse Strategies –
Investing in market-hedged products, which protect against specific negative risks, is another alternative for investors who anticipate a market meltdown. There are a variety of these investments available, with inverse exchange-traded funds (ETFs) and leveraged inverse ETFs being two of the most well-known. AdvisorShares Ranger Equity Bear ETF (NYSEARCA: HDGE) and ProShares UltraShort NASDAQ Biotechnology ETF are two examples. These funds take an active inverse market position in the hope of profiting from a market correction or disaster. Short-side protection is taken a step further with leveraged inverse ETFs, which use leverage to boost gains from short-selling positions. These inverse funds are designed for instances where a market fall could result in significant losses.
Selling Calls –
Selling call options is a reversal method for buying put options to safeguard against a market fall. When selling call options, a seller anticipates a drop in the price of a security and looks for a buyer prepared to acquire the call option in exchange for the right to buy the security at a certain price. The buyer’s acquisition of the security at a higher price than the seller expects it to be valued in the trading market helps the seller of the call option. Call options, like put options, are exchanged for specific assets or indexes. More elaborate call option selling techniques can be created to simulate and protect specific investment positions.
MarketXLS –
MarketXLS has about one hundred templates to save you time. Whether it is any option strategy or a valuation model, we have got you covered. We add new templates all the time and they are all available with your MarketXLS subscription.
Feel free to experiment at https://marketxls.com/marketxls-templates
Get Market data in Excel easy to use formulas
- Real-time Live Streaming Option Prices & Greeks in your Excel
- Historical (intraday) Options data in your Excel
- All US Stocks and Index options are included
- Real-time prices and data on underlying stocks and indices
- Works on Windows, MAC or even online
- Implement MarketXLS formulas in your Excel sheets and make them come alive
- Save hours of time, streamline your option trading workflows
- Easy to use with formulas and pre-made templates

I invite you to book a demo with me or my team to save time, enhance your investment research, and streamline your workflows.