
← Back to Templates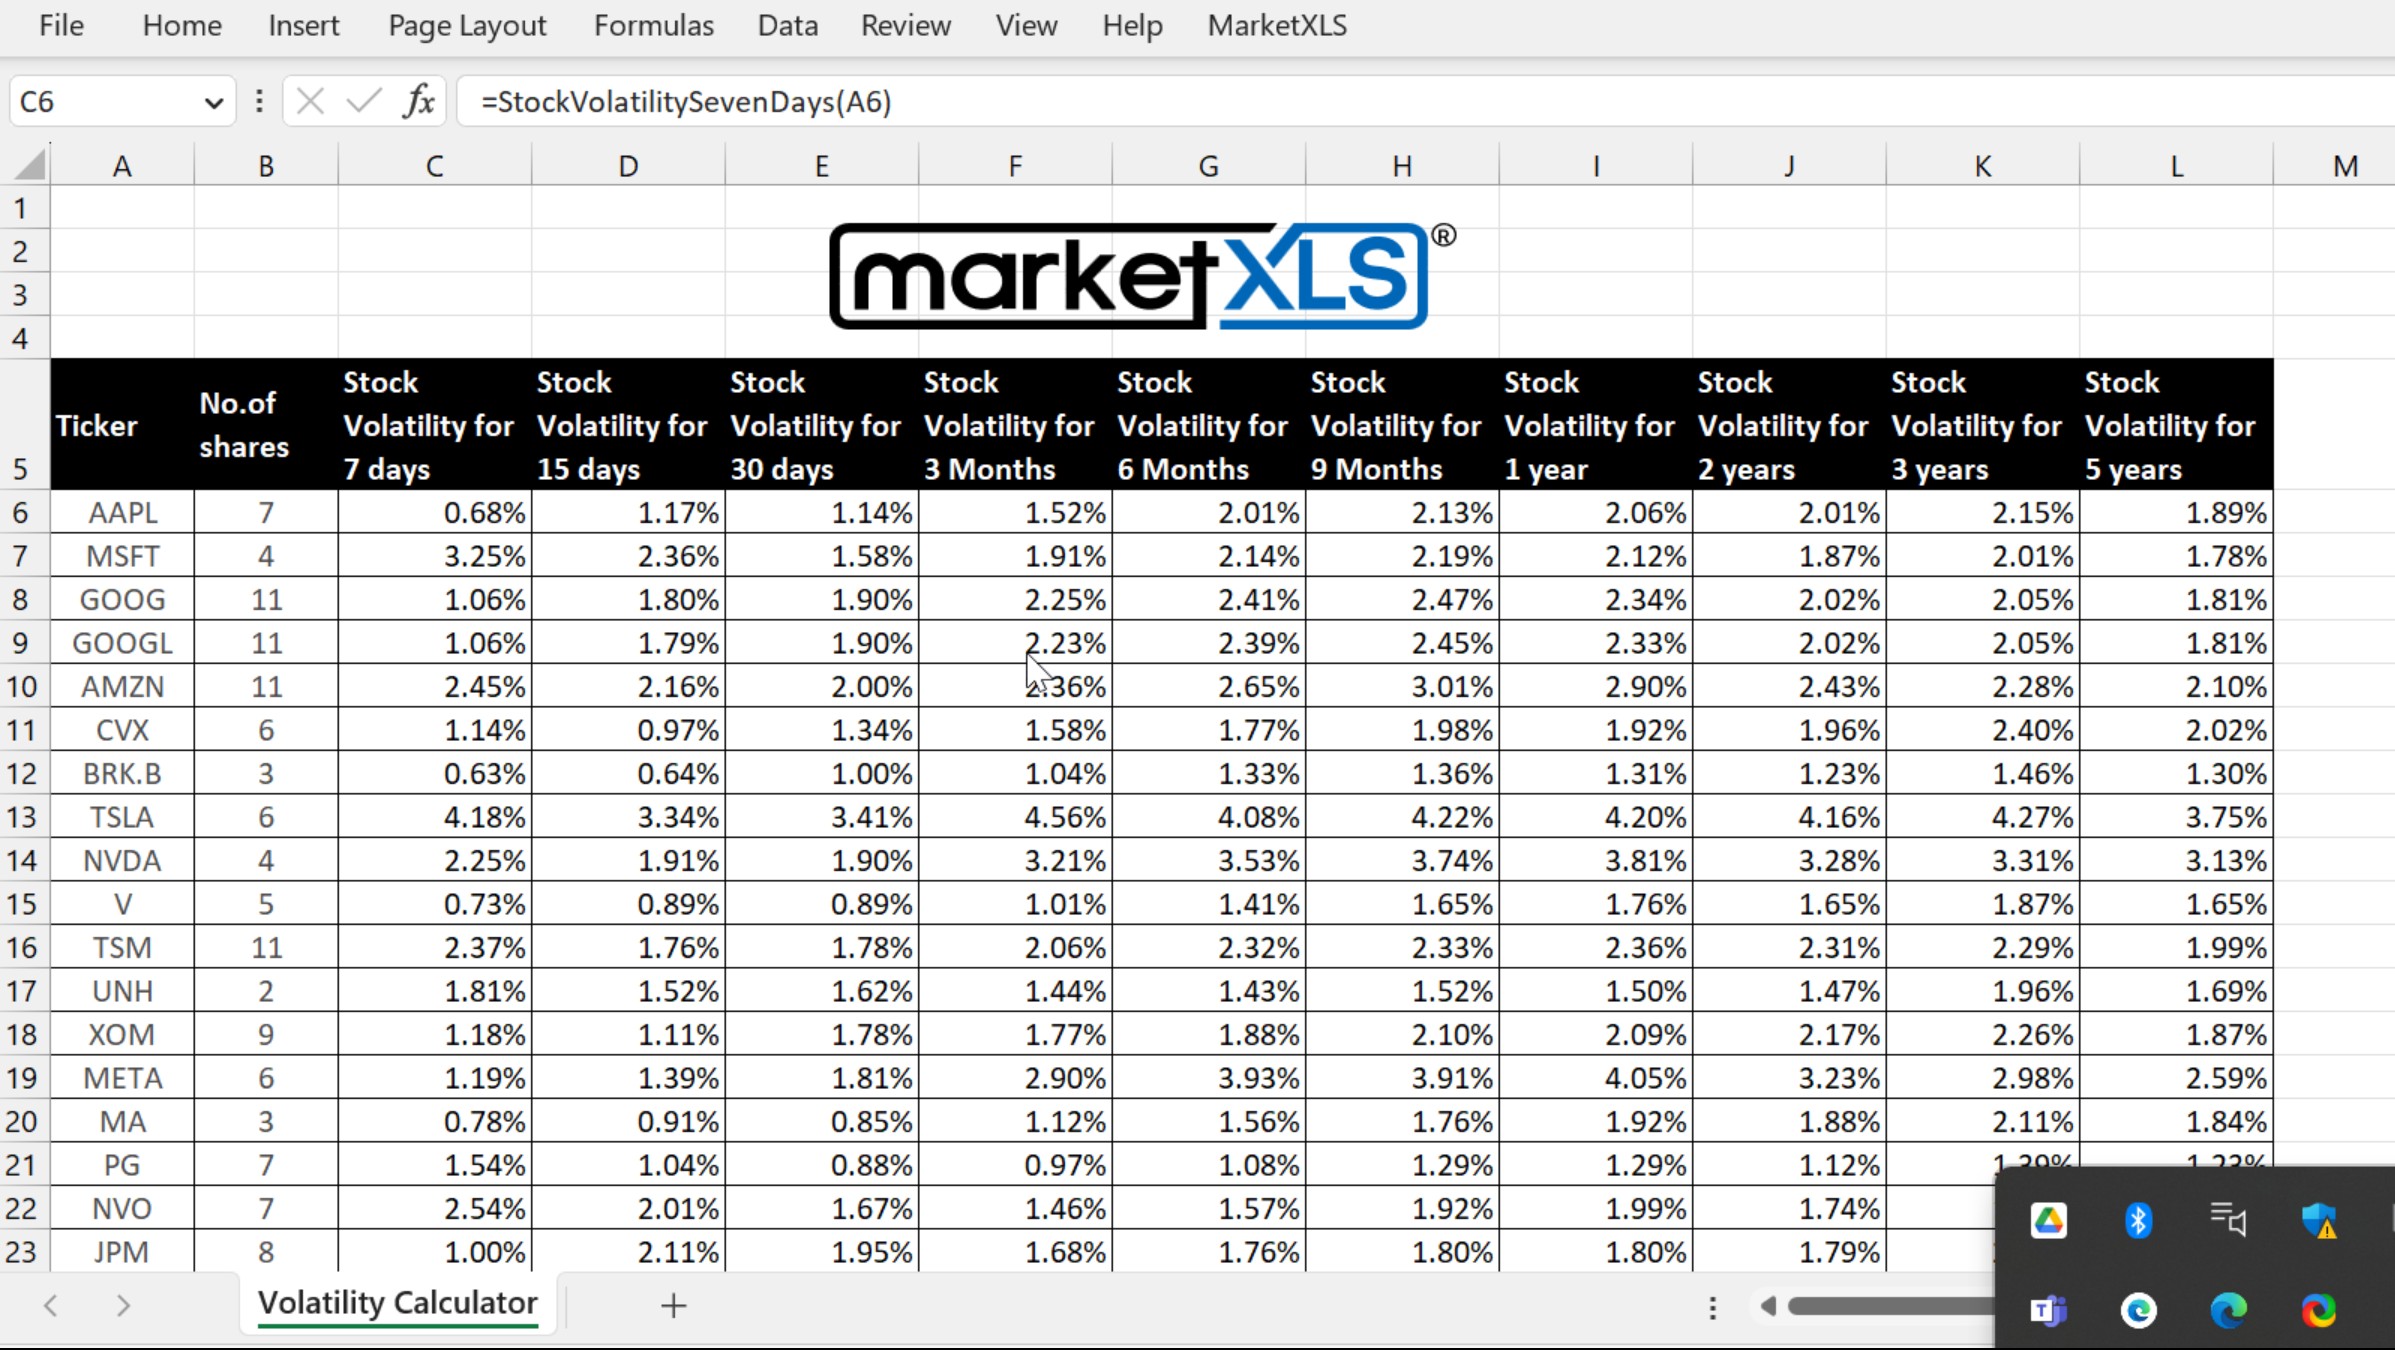
Volatility Calculator
Description
Measures realized volatility across eight horizons for each symbol, from seven days through two years, one row per ticker. The term structure that emerges is what makes it useful: short window volatility sitting far above the annual figure marks a stock in a disturbed state, while the reverse suggests it has settled down. These are realized figures computed from price history, not implied volatility from the options market, and the two answer different questions. Add symbols to the first column and every horizon populates on refresh.
Template Screenshots
Get Access to 1 Billion Usable Market data points IN YOUR EXCEL SHEETS WITH EASY TO USE EXCEL FUNCTIONS
Get started today▶
How does MarketXLS work? Watch Demo
Similar Templates
No similar templates found