Monte Carlo Simulation Excel is an excellent tool for investors when assessing the potential risks associated with the portfolio and asset allocation. This article will discuss what it is, how it is works, how MarketXLS add-in calculates Monte Carlo simulation of your portfolio.
The Monte Carlo approach is a computer-based method that uses statistical sampling to build a model of a possible range of results (a probability distribution) for those factors that have an element of uncertainty.
Monte Carlo simulation involves creating random variables. These variables have similar properties to the risk factors which the simulation is attempting to simulate.
Monte-Carlo simulation simulates and produces several outcomes for a number of scenarios over a large number of time-steps. As a result, the technique provides a large number of possible outcomes of variables, along with their probabilities. From the possible outcomes of the values, an average value is chosen. The average measure is usually dependent or even mean calculated as to measure. The larger the number of scenarios, the higher the accuracy of the result.
How the Monte Carlo Simulation Works
The Monte Carlo simulation builds models of potential outcomes by substituting a range of values for every uncertain factor known as a probability distribution. The simulation then runs through all possible results, using a different set of random values every time.
During a Monte Carlo simulation, values are sampled at random from the input probability distributions. Each set of samples is defined as iteration. The resulting outcome from each sample is then recorded. At the end of the simulation, thousands or millions of “random trials” produce a distribution of outcomes that can be analyzed.
The Monte Carlo simulation determines the likelihood that stock trading asset price will change in a certain way. Additionally, this model can assess the risk that an entity or an asset will default. One of the most common ways to estimate returns and risk is using a Monte Carlo simulation (MCS).
Disadvantages of the Monte Carlo simulation
The Monte Carlo simulation in finance has its shortcomings as well because no one can predict the future. The simulations are particularly disadvantageous during a bear market. This is because the outcomes are based on constant volatility and can create a false sense of security for the investors.
Moreover, the simulation is unable to factor in the behavioral aspect of the stock market. Therefore the simulations only show an approximation of the true value and can sometimes show very large variances.
Monte Carlo Simulation Calculation
The investors can assess portfolios using Monte Carlo simulation. The MarketXLS® add in system calculates the standard deviation and annual returns for your portfolio based on set weights to give the result.
Step1: Calculate the Monthly Return of Every Asset in the Portfolio
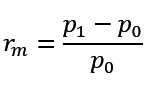
Where:
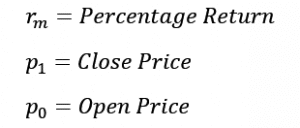
Note: To maintain consistency with theory in this regard, Close Price is a security’s Adjusted Close (Close prices adjusted for dividends and splits) of the last day of a given month, and the Open Price is the Adjusted Close price for the last day of the previous month.
Step2: Calculate Monthly Return of Portfolio
Portfolio return for a given month is calculated as follows:
![]()
Where:
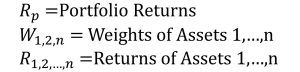
This is repeated for all the months under consideration.
Step3: Calculate the STD_DEV of the Portfolio
The portfolio’s standard deviation is calculated below:
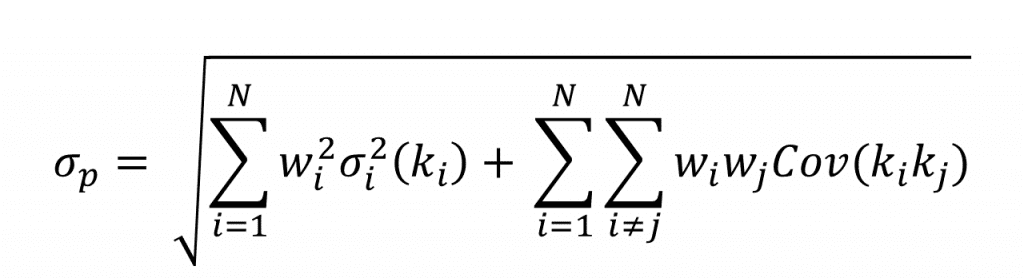
Where:

Step 4: Calculate Drift over a time period of the portfolio
Generating simulated asset paths of the portfolio:
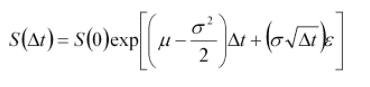
Where:

Monte Carlo Simulation Excel with MarketXLS
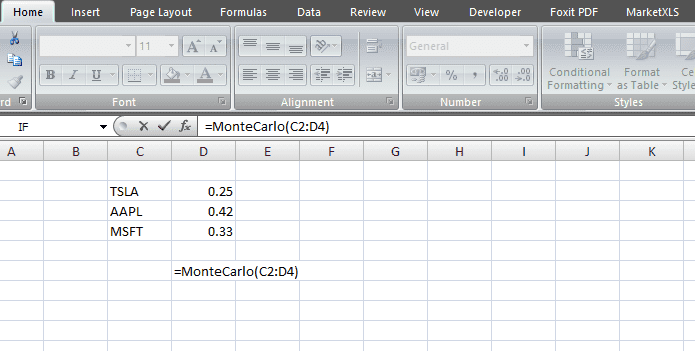
Monte Carlo Simulation Excel with MarketXLS® formulae helps investors assess their portfolios and make investment decisions. MarketXLS® template has now made it easy to perform a Monte Carlo Simulation with just a few clicks. The investor needs to enter the stock symbol and the weight of the portfolio.
The following inputs are required to be entered by the investor:
- Symbol of the asset: Enter the ticker under which the security in your portfolio is traded.
- Weight of the asset in your Portfolio: Enter the percentage weight of each security, as shown below.
Input:
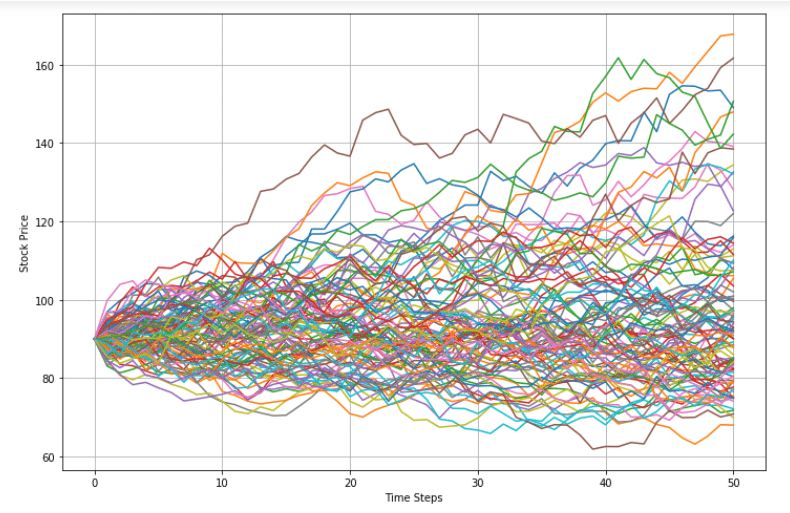
Output:
Stock price with 100 repeated simulations of random number with time steps on the graph would give this plot:
Optional Fields:
Months under observation:
Monte Carlo Simulation Excel is a great tool when assessing the potential risks associated with the portfolio and for asset allocation. The investor can use the Monte Carlo simulation with MarketXLS add in to get a combination of assets that attempt to predict the future many times over to estimate returns for a given level of risk of the portfolio. An investor can derive the expected returns with the Monte Carlo simulation excel, depending on his individual preferences and investment timeframe using MarketXLS.
