

The DuPont method is an essential analysis used to assess a company’s performance in detail. Donaldson Brown, a DuPont Corporation salesman, found the DuPont equation in 1920. The DuPont analysis is an expansion of the Return on Equity (ROE) which is broken down into a more detailed and complex equation. Many investors use the ROE to find the right companies to invest in. Further, we will explore what is ROE and how using the DuPont equation will give investors a more precise analysis of the company.
**Return on Equity **ROE measures the profits a company makes compared to the shareholder’s investment.
*/}(https://marketxls.com/blog/wp-content/uploads/2021/04/ROE.png)
An increase in shareholder equity is a positive sign for the company meaning a higher ROE. However, a high ROE can also be caused when a company takes on more debt, which means a decrease in shareholder equity. This could cause the stocks to become riskier. The ROE number can be misleading therefore the ratio needs to be decomposed to analyze the data better. Utilizing ROE does not always give an accurate estimation of company performance.
###** How to Calculate DuPont Analysis?The Three-Step DuPont equation has additional components to calculating the ROE compared to the original ROE equation. It measures three factors of a company: Profitability, Efficiency, and Financial Leverage.ROE = Net Profit Margin x Asset Turnover x Equity MultiplierThese three factors are a result of three separate formulas:Net Profit Margin= Net Income/ revenueAsset Turnover**= Sales / AssetsEquity Multiplier= Assets / Shareholders Equity
*/}(https://marketxls.com/blog/wp-content/uploads/2021/04/ROE-equation.png)
###** Return On Equity (ROE) vs. Return On Assets (ROA)**As said above, ROE is a measure of how much a business profits based on the amount of equity invested in the business. Return on Assets (ROA) is a measure of how much profits a business makes with respect to the total assets.

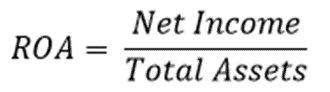
ROA
A difference between ROE and ROA is the denominator. The numerator “Net Income” is the same for both. The denominator of ROE is Shareholder’s Equity which is equal to Assets – Liabilities. While ROA’s denominator is Total Assets = Shareholder’s Equity + Liabilities.
Looking at these two equations we see that ROA and ROE are actually equal to each other especially when the company’s liabilities are zero which leads to equity equals assets. To see the difference between ROE and ROA, we need to use ROE’s DuPont Analysis equation.
*/}(https://marketxls.com/blog/wp-content/uploads/2021/04/DuPont-equation.png)
The image above shows that the first half of the ROE equation is ROA because if you cancel the sales then it becomes Net Income/Assets. Financial leverage, also known as equity multiplier, is the main differentiator between ROE and ROA. If a company takes on debt/financial leverage then it would affect the ROE because taking on debt increases the company’s assets. When debt increases, shareholder’s equity decreases which raises ROE. Both ROE and ROA are profitability ratios that are important to consider when looking at a company’s performance.
###Using the MarketXLS TemplateInstead of doing all the calculations, MarketXLS has a template that makes it easier for investors to use the DuPont Analysis.
*/}(https://marketxls.com/blog/wp-content/uploads/2021/04/MarketXLS-template-DuPont.png)
The table above is a part of the DuPont template. It calculates the ROE of all three factors, thereby reducing your workload. You can use it to compare ROE between multiple companies or between multiple years.
Here is a link to the template MarketXLS – DuPont Analysis Template
###ConclusionFinally, we can see that the DuPont Analysis is important to investors because it can show them the whole picture. A DuPont Analysis will show us what is changing in the company and where exactly are they doing better or lagging. If a company is doing worse than its competitors, you can check whether it has a high cost, thereby decreasing net profit margin or lowering financial leverage. DuPont Analysis is essential in providing a deeper understanding of a company’s financial standing.
###DisclaimerNone of the content published on marketxls.com constitutes a recommendation that any particular security, portfolio of securities, transaction, or investment strategy is suitable for any specific person.
The author is not offering any professional advice of any kind. The reader should consult a professional financial advisor to determine their suitability for any strategies discussed herein.
The article is written to help users collect the required information from various sources deemed to be an authority in their content. The trademarks, if any, are the property of their owners, and no representations are made. All trademarks referenced are the property of their respective owners. Other trademarks and trade names may be used in this document to refer to either the entity claiming the marks and names or their products. MarketXLS disclaims any proprietary interest in trademarks and trade names other than its own or affiliation with the trademark owner.** References:**
Image of DuPont Model equation
