
Excel & Tools

Earnings Power Value (EPV) = normalized after-tax earnings / WACC, a no-growth intrinsic value. The full formula, a worked example, and an Excel spreadsheet using MarketXLS.

How to build a trading journal in Excel: the fields to log, the formulas for win rate, profit factor, and expectancy, and how MarketXLS fills prices and context automatically.

Value at Risk (VaR) estimates the loss a portfolio should not exceed at a set confidence level. Calculate parametric, historical, and Monte Carlo VaR in Excel.

Five ways to get stock quotes in Excel in 2026, from STOCKHISTORY and the Stocks data type to MarketXLS formulas like =Last("AAPL") and streaming =QM_Stream_Last.

Convert option symbols between QuoteMedia, Fidelity, Schwab, Yahoo Finance, E*Trade, TradeStation, eSignal, and MetaStock formats in Excel with =OptionSymbolConvert(symbol, from, to).

EBITDA Formula in Excel is essential for evaluating company profitability. Learn how to calculate EBITDA manually and with MarketXLS functions, compare it to other metrics, and build valuation models.

Zerodha Brokerage Calculator in Excel helps you compute intraday, delivery, F&O, and commodity trading costs with formulas for STT, GST, SEBI fees, and stamp duty.

A trading journal records each trade (date, ticker, size, entry, exit, reason, result) so you can review what works. How to build one in Excel.

Annualized rate of return measures investment growth on a per-year basis. Learn how to calculate CAGR manually in Excel and with the MarketXLS =CAGR() function for portfolio analysis.

Calculate stock and portfolio volatility in Excel with MarketXLS functions such as StockVolatilityCustomDates and PortfolioVolatility, plus a free volatility calculator template.

Stock beta in excel measures how volatile a stock is relative to the overall market — learn to calculate it manually with formulas and instantly with MarketXLS functions.
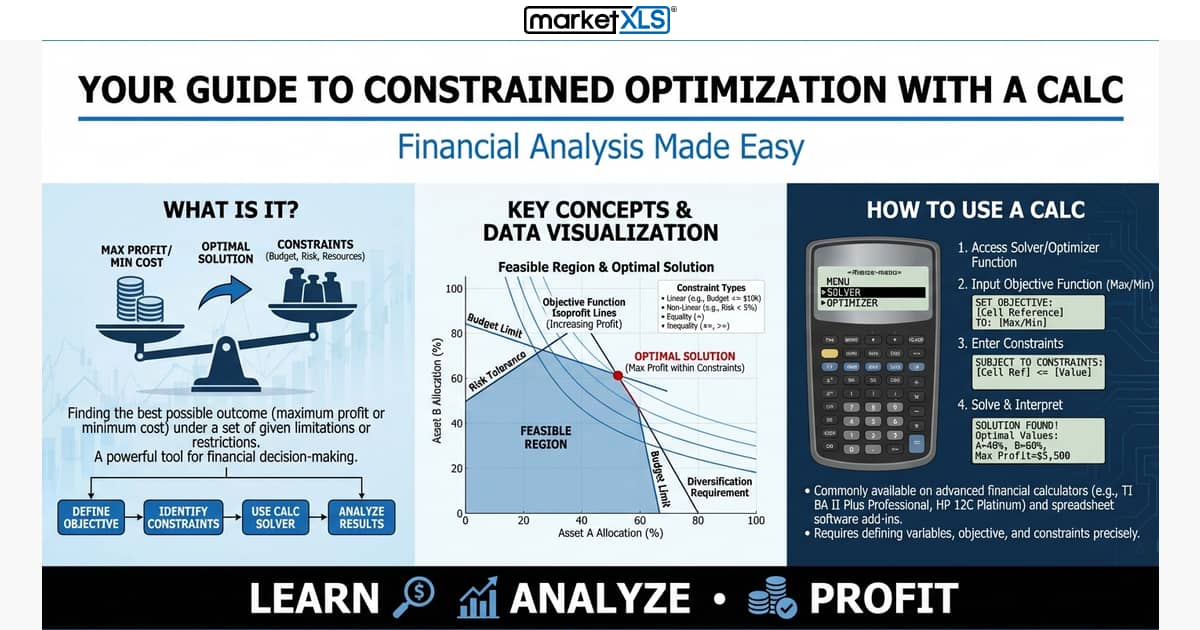
Constrained optimization finds the best outcome within limits, such as the highest-return portfolio under a risk cap. How it works and how to solve it with a calculator or Excel.

Sharpe ratio = (portfolio return minus risk-free rate) divided by the standard deviation of returns. How to calculate it with a calculator or in Excel.

What the Scott Burns retirement calculator asks for, what it estimates, and how to track the investments behind your retirement plan in Excel.

A reverse CAGR calculation works backward from a target value to the starting amount or growth rate you need. Formulas and Excel examples.

DuPont analysis splits Return on Equity into net profit margin, asset turnover, and equity multiplier. See the formula, how it differs from ROA, and the MarketXLS Excel template.