
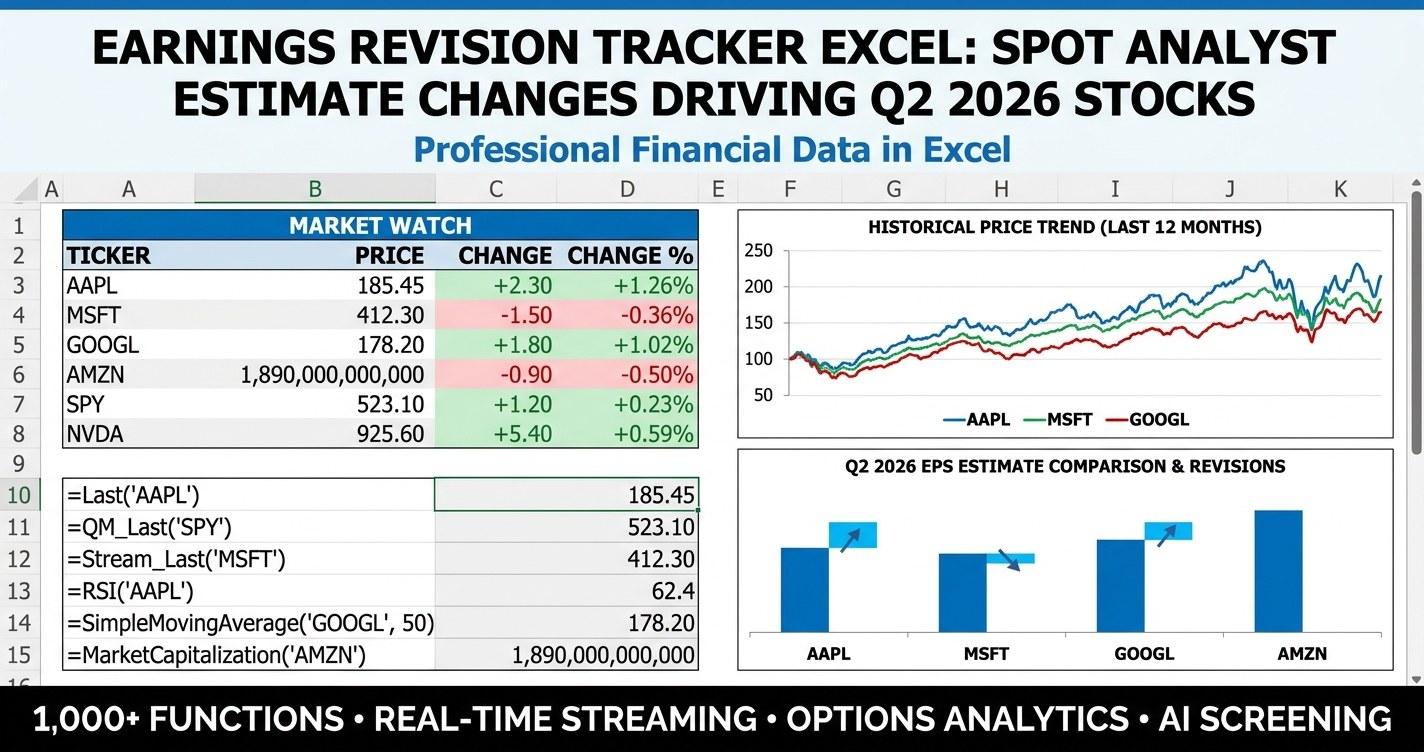
Earnings revision tracker excel - if that's why you landed here, you're trying to do what every disciplined buy-side analyst does in the weeks after a company reports: watch how the consensus EPS estimate and the consensus 1-year price target are migrating, and ask whether that drift is telling you something the price has not yet caught up to. This guide walks through a working revision tracker built in Excel, powered by the MarketXLS add-in, with a 25-name large-cap watchlist, a sortable Upgrade Score, sector heat map, and a starter portfolio sized by conviction. Both files are free to download below.
The mid-Q2 2026 calendar is dense. The S&P 500 is roughly two-thirds of the way through Q1 2026 reporting, the May FOMC meeting is days away, and forward EPS for the index has been pushed around by rate guidance, the AI capex cycle, and a fresh round of tariff headlines. Watching headlines is one thing. Watching analyst behaviour is another - it tends to leak the consensus view before it shows up in price.
What Is An Earnings Revision Tracker?
An earnings revision tracker is a spreadsheet that records the consensus analyst EPS estimate and 1-year price target for a basket of stocks at multiple points in time, then computes the percentage change between them. The output is a sortable table showing which stocks have seen the largest upward revisions and which have seen the largest downward revisions over a fixed window (commonly 7, 30, or 60 days).
The intuition behind tracking revisions is empirical. Decades of academic research from authors like Brown, Wei, Womack and Givoly have documented that stocks experiencing significant positive earnings revisions tend to outperform stocks experiencing negative revisions over the following 6-12 months. The effect is strongest immediately after a reporting cycle, when analyst notes are being updated in bulk - exactly the window we're in for Q2 2026.
Quick Reference: What's In The Tracker
| Column | What It Measures | Why It Matters |
|---|---|---|
| EPS Now (Q) | Current consensus EPS for the upcoming quarter | The number Wall Street currently expects |
| EPS 30d Ago | Same estimate, 30 days ago | Anchors how far the estimate has moved this month |
| EPS 60d Ago | Same estimate, 60 days ago | Captures the slower drift since the start of earnings season |
| EPS Rev % (60d) | Percentage change in current-quarter EPS over 60 days | Core revision momentum signal |
| Last Surprise % | EPS surprise in the most recently reported quarter | Confirms whether companies are beating or missing |
| Tgt Now | Current mean 1-year target price | Directional view from the sell side today |
| Tgt 4w Ago | Mean target price approx. 4 weeks ago | Anchors the target drift |
| Tgt Rev % | Percentage change in 1-year target price | Confirming signal that often follows EPS revisions |
| Implied Upside % | (Target / Price) - 1 | How far the consensus thinks the name can run |
| Upgrade Score | 0.5 x EPS Rev + 0.3 x Tgt Rev + 0.2 x Surprise | Single composite to sort the watchlist on |
Q2 2026 Market Backdrop: Why Revisions Matter Right Now
Three macro forces are pushing analyst models around at the same time, which is why estimate revisions are unusually informative this quarter.
1. The AI Capex Cycle Keeps Re-Pricing The Mag 7
NVIDIA, Meta, Microsoft, Alphabet, and Amazon have all delivered Q1 results that forced the sell side to lift not only the next quarter EPS estimates but also out-year capex assumptions. The pattern is the same: a guidance raise, a wave of analyst notes the next morning, then a steady drift higher in the consensus number for two to four weeks. A revision tracker captures that drift in one column instead of forcing you to read 40 broker notes.
The flip side is real, too. Tesla, Boeing, and a handful of consumer-discretionary names have seen meaningful downward revisions as the Street digests demand softness and one-time charges. The same column that surfaces the upgrades flags the downgrades.
2. Fed Rate Path And Forward P/E Compression
The May 2026 FOMC decision is imminent, and the path of forward rates will reset the discount rate analysts apply to out-year cash flows. When that happens, target prices move first - usually in the days after the meeting. A revision tracker built on EARNINGSESTIMATES_TARGETPRICEHISTORY_MEANTARGETPRICEESTIMATE_WEEKS3AGO and ONEYRTARGETPRICE will surface that move within the same week.
3. Tariff Headlines And Industrials / Consumer Names
Industrials and consumer discretionary names have been the most volatile recipients of estimate cuts this cycle. Analysts have been trimming current-quarter EPS for tariff-exposed manufacturers, which shows up clearly in a 60-day revision view. The tracker lets you compare an XOM or CVX estimate cut (energy-driven) against a CAT or BA cut (tariff or operational-driven) on the same screen.
How To Build An Earnings Revision Tracker In Excel With MarketXLS
The mechanical build is short. It needs three families of MarketXLS functions plus a couple of helper columns. Every function below has been verified against the live MarketXLS function library before publishing.
Step 1: Pull The Current EPS Estimate
=EPSESTIMATECURRENTQUARTER("AAPL")
This returns the consensus EPS estimate for the upcoming quarter. For longer-horizon work you can swap in:
=EPSESTIMATENEXTQUARTER("AAPL")
=EPSESTIMATECURRENTYEAR("AAPL")
=EPSESTIMATENEXTYEAR("AAPL")
Step 2: Pull The Same Estimate As Of 30 And 60 Days Ago
=EARNINGSESTIMATES_CONSENSUSEPSESTIMATESTRENDS_DAYS30AGO_QR1_VALUE("AAPL")
=EARNINGSESTIMATES_CONSENSUSEPSESTIMATESTRENDS_DAYS60AGO_QR1_VALUE("AAPL")
The function name is long but the structure is consistent: DAYS{X}AGO for the time window, QR1 for the current quarter (QR2, FR1, FR2 are also supported for the next quarter and full years). Pair them with the CURRENTEST_QR1_VALUE function if you want to be explicit about which estimate you are subtracting from:
=EARNINGSESTIMATES_CONSENSUSEPSESTIMATESTRENDS_CURRENTEST_QR1_VALUE("AAPL")
Step 3: Compute The Revision Percentage
The arithmetic is straightforward, but use ABS in the denominator so the sign is preserved when an estimate flips from negative to positive:
=IFERROR((E2-G2)/ABS(G2),"")
Where E2 is the current estimate and G2 is the estimate 60 days ago.
Step 4: Layer In Price Target Revisions
Target prices often move AFTER estimates, so a target price revision is a confirming signal. Pull both:
=ONEYRTARGETPRICE("AAPL")
=EARNINGSESTIMATES_TARGETPRICEHISTORY_MEANTARGETPRICEESTIMATE_WEEKS3AGO("AAPL")
Then divide the difference by the prior level for a clean percentage.
Step 5: Add Earnings Surprise Context
The surprise % from the most recently reported quarter tells you whether the company actually beat the number, which is a useful reality check on the revision direction:
=EARNINGSESTIMATES_EARNINGSSURPRISE_PERCENTEPSSURPRISE_CURRENT_VALUE("AAPL")
Companion functions return the actual EPS, the consensus estimate it was compared to, and the dollar difference:
=EARNINGSESTIMATES_EARNINGSSURPRISE_EPSACTUAL_CURRENT_VALUE("AAPL")
=EARNINGSESTIMATES_EARNINGSSURPRISE_EPSESTIMATE_CURRENT_VALUE("AAPL")
=EARNINGSESTIMATES_EARNINGSSURPRISE_EPSDIFFERENCE_CURRENT_VALUE("AAPL")
Step 6: Combine Into An Upgrade Score
A single sortable column makes the watchlist usable. The template uses:
=IFERROR(0.5*EPS_Rev + 0.3*Target_Rev + 0.2*Surprise, "")
Weight the components however you prefer. The important part is having one ranked column to anchor your filtering.
Step 7: Filter For Coverage And Valuation
Revisions are noisy when only a handful of analysts cover a stock. Add a filter on:
=NUMBEROFANALYSTS("AAPL")
A common cutoff is 10 or more covering analysts. Then layer a forward valuation filter so you don't end up sized into expensive names just because the revision tape is hot:
=FORWARDPE("AAPL")
=PEGRATIO("AAPL")
What's Inside The Template
Both downloadable files share the same six-sheet structure:
Sheet 1: Cover
Quick title page with the data snapshot date and a one-paragraph description of what the workbook does. The sample file has a fixed "Data as of" date; the template file refreshes live whenever you hit the MarketXLS Refresh All button.
Sheet 2: How To Use
A walkthrough of every sheet plus a dedicated MarketXLS Functions Used box at the bottom listing all 11 of the formulas that power the workbook. If you want to extend the watchlist beyond the 25 names already in the file, this is the formula library you copy from.
Sheet 3: Main Dashboard
The 25-name watchlist with all 14 columns laid out in the table above. Color-coded conditional formatting on the EPS Rev %, Target Rev %, Surprise %, Implied Upside %, and Upgrade Score columns makes the heat map readable at a glance. A Watchlist Summary block at the bottom averages every metric across the basket and counts positive vs. negative revisions.
Sheet 4: Scenario Analysis
A what-if table built around four yellow input cells: portfolio size, long allocation %, cash/hedge %, and holding period. The five scenarios (Deep Upgrade Tilt, Modest Upgrade Tilt, Balanced, Modest Downgrade Tilt, Deep Downgrade Tilt) translate revision-cluster assumptions into a 12-month return profile and a portfolio-level dollar value. Educational only - replace the assumed return numbers with your own back-tests if you want a more rigorous model.
Sheet 5: Strategy
An eight-step playbook that walks through the workflow: define the universe, pull EPS estimates, compute revision %, add target price changes, build the Upgrade Score, filter for valuation, size positions, and refresh weekly during earnings months. A risk-reminders block at the bottom flags the four most common ways revision strategies fail.
Sheet 6: Portfolio
A mechanical long-only basket. Each name receives a weight equal to its positive Upgrade Score divided by the sum of all positive scores in the watchlist. Plug a portfolio size into the yellow input cell at the top and every position dollar amount and share count flows through automatically. Stocks with a non-positive Upgrade Score get a zero weight - they're not in the basket this rebalance.
Sheet 7: Sector View
Aggregates EPS revision %, target revision %, surprise %, and Upgrade Score by GICS sector. Color-coded so you can immediately see which sectors are seeing the strongest and weakest analyst sentiment. Useful as a top-down filter before drilling into individual names.
Reading The Q2 2026 Snapshot
The static sample file is captured as of 2026-05-02 and reflects the mid-Q2 picture. A few patterns worth noticing as you open the workbook:
- The Mag 7 names cluster in the upper part of the Upgrade Score column, with NVDA, META, AMZN, AVGO, and LLY all showing meaningful 60-day positive EPS revisions.
- Energy (XOM, CVX) and a couple of industrials (CAT, BA) sit in the negative revision zone, reflecting the soft commodity prints and tariff headlines that have weighed on those sectors.
- TSLA and BA are illustrative outliers with negative surprise % AND negative revision % AND negative target revision % - the tracker flags them clearly with red shading across the row.
- UNH shows that defensives are not always safe; it's in the deepest negative revision zone in the sample because of the medical-cost-trend reset analysts have been pricing into 2026 estimates.
These observations are descriptive, not prescriptive. They are how the tracker SHOWS you the tape, not what to do about it. That part is up to you.
Download The Templates
Download the templates:
- - Pre-filled snapshot as of 2026-05-02, with the live formula listed alongside every value so you can see exactly which MarketXLS function powers it.
- - Fully live workbook. Open in Excel with the MarketXLS add-in installed and hit Refresh All to pull current EPS estimates, target prices, surprises, and prices.
If you don't have the MarketXLS add-in yet, head to the MarketXLS site for an overview of the platform or book a personalised demo to see how the analyst and earnings function library works inside Excel.
How This Pairs With Other MarketXLS Earnings Tools
The earnings revision tracker is the front-of-the-funnel screen. Once you've ranked the universe, you'll typically want to drop down into a single-name view. A few related templates and posts to chain it with:
- Mag 7 earnings tracker for Q1 2026 - same idea, focused on the seven AI capex bellwethers.
- Bank earnings tracker for Q1 2026 - financials version with NIM, deposit beta, and credit cost columns.
- Forward earnings yield dashboard - layer valuation on top of the revision view.
- Earnings surprise screener - drill into the surprise component of the Upgrade Score.
Frequently Asked Questions
What is an earnings revision tracker excel?
An earnings revision tracker excel is a spreadsheet that records the consensus analyst EPS estimate and 1-year price target for a list of stocks at multiple points in time and computes the percentage change between them. The output is a sortable table showing which stocks have seen the largest upward and downward revisions over a fixed window (typically 7, 30, or 60 days), so you can rank the watchlist by analyst sentiment momentum.
How do I track EPS estimate changes in Excel?
The cleanest way to track EPS estimate changes in Excel is to use the MarketXLS add-in, which exposes the consensus EPS estimate at multiple historical points through functions like EPSESTIMATECURRENTQUARTER for today's number and EARNINGSESTIMATES_CONSENSUSEPSESTIMATESTRENDS_DAYS30AGO_QR1_VALUE / DAYS60AGO_QR1_VALUE for prior periods. Subtract them and divide by the prior level (using ABS to preserve sign) to get a clean revision percentage.
Which MarketXLS functions power the earnings revision tracker?
The tracker uses 11 verified MarketXLS functions: Last (price), Sector, EPSESTIMATECURRENTQUARTER (current EPS), EARNINGSESTIMATES_CONSENSUSEPSESTIMATESTRENDS_DAYS30AGO_QR1_VALUE and DAYS60AGO_QR1_VALUE (historical EPS estimates), EARNINGSESTIMATES_EARNINGSSURPRISE_PERCENTEPSSURPRISE_CURRENT_VALUE (surprise %), ONEYRTARGETPRICE (current target), EARNINGSESTIMATES_TARGETPRICEHISTORY_MEANTARGETPRICEESTIMATE_WEEKS3AGO (4-week-old target), NUMBEROFANALYSTS (coverage filter), FORWARDPE and PEGRATIO (valuation overlay), and MARKETCAPITALIZATION.
How often should I refresh an earnings revision tracker?
During an active earnings cycle (April-May, July-August, October-November, January-February) a weekly refresh is sensible because consensus estimates can shift meaningfully within a single week as analysts publish post-earnings notes. Outside of earnings months a monthly refresh is usually sufficient to catch the slower estimate drift driven by macro and guidance updates.
Are earnings revisions a reliable signal?
Decades of academic research (Givoly and Lakonishok, Brown, Womack, and others) have documented that stocks with the largest positive earnings revisions historically outperformed stocks with the largest negative revisions over 6-12 month horizons. The effect is strongest immediately after a reporting cycle. That said, the magnitude varies by regime, the signal is noisier in low-coverage names, and revisions tied to one-time accounting events do not behave like organic earnings momentum. Treat the tracker as one input in a process, not a stand-alone trading rule.
Can I extend the watchlist beyond the 25 stocks in the template?
Yes. The MarketXLS Functions Used box on the How To Use sheet lists every formula in the workbook with a sample ticker. Copy a row in the Main Dashboard, change the ticker symbol, and the entire row will repopulate. The Sector View, Portfolio, and Watchlist Summary sheets reference the dashboard with sector-aware formulas, so they pick up the new name automatically once it's added.
The Bottom Line
An earnings revision tracker excel turns 40 broker notes into one sortable column. During a quarter as cross-current-heavy as Q2 2026, that compression is genuinely useful. The tracker is not a forecast of where any individual stock will trade; it is a structured way to see where the consensus has been moving and how fast. Pair it with valuation discipline and a coverage filter and it becomes a steady part of an analytical workflow rather than another spreadsheet that gets opened twice and forgotten.
If you want the live version that pulls fresh consensus EPS estimates, target prices, and surprises every time you hit refresh, grab the above. To see the underlying analyst and earnings function library in action, visit MarketXLS or book a demo.
Educational use only. Nothing in this article or in the linked workbooks should be construed as investment advice or a recommendation to buy or sell any security.
