

Excel has two built-in ways to get stock data: the Stocks data type (a delayed snapshot of about 15 fields such as price, P/E, and market cap) and the STOCKHISTORY function (daily, weekly, or monthly historical prices). Both need Microsoft 365, and neither covers options, technical indicators, or streaming quotes. For those, you can import an API with Power Query or install an add-in such as MarketXLS, which adds a library of 1000+ functions like =Last("AAPL"), =PERatio("AAPL"), and =RSI("AAPL").
Try it in your own spreadsheet
Get the free MarketXLS sample workbook (.xlsx).
No account needed. MarketXLS live data requires a paid plan. Preview workbook
Explore more videos
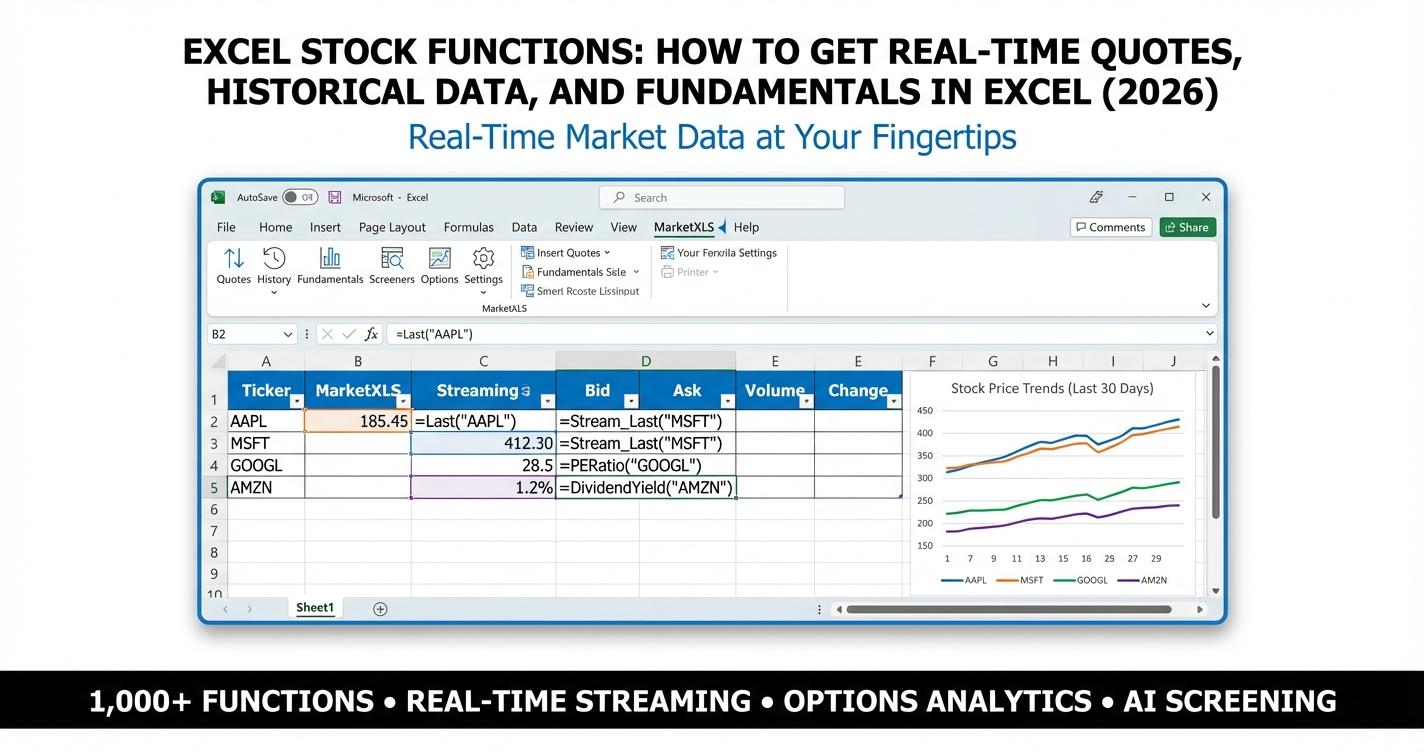
This guide explains each method, its limits, and which one to use for quotes, history, fundamentals, and options.
Excel Stock Functions: The Built-In STOCK Data Type
The Stocks data type is a built-in Microsoft 365 feature that turns a ticker in a cell into a linked record with fields you can reference. It is the simplest way to get market data without an add-in.
How to Enable It
- Type a ticker symbol (e.g.,
AAPL) into a cell - Select the cell and go to the Data tab
- Click Stocks in the Data Types group
- Excel converts the text into a rich, linked data type powered by Refinitiv
Once converted, click the small icon next to the cell to see available fields including Price, Previous Close, 52-Week High, 52-Week Low, Market Cap, P/E Ratio, Volume, and Beta.
Extracting Fields
After converting cell A2 to the Stocks data type, pull fields into adjacent cells:
=A2.Price
=A2.[52-week high]
=A2.[Market cap]
=A2.[P/E]
=A2.Beta
=A2.Volume
Combine with XLOOKUP
Build a reference table with converted Stocks data-type cells in column A and extracted prices in column B. Use =XLOOKUP("AAPL",A:A,B:B) anywhere in your workbook to retrieve Apple's price dynamically.
Limitations
- Data refreshes only when you click Refresh All or reopen the workbook - not real-time
- Requires Microsoft 365 subscription (not available in Excel 2019 or earlier)
- Limited to equities and select indices - no options, futures, or crypto
- No historical time-series - only a single snapshot per field
- Field names vary by locale, which can break formulas in shared workbooks
- Roughly 15 available fields - far fewer than professional data platforms
Excel Stock Functions: The STOCKHISTORY Function
STOCKHISTORY is the primary built-in excel stock function for pulling historical price data into a dynamic spill range.
Syntax
=STOCKHISTORY(stock, start_date, [end_date], [interval], [headers], [property0], [property1], ...)
| Parameter | Description | Values |
|---|---|---|
stock | Ticker symbol | "MSFT" |
start_date | First date | DATE(2025,1,1) |
end_date | Last date (default = today) | TODAY() |
interval | 0 = Daily, 1 = Weekly, 2 = Monthly | 0 |
headers | 0 = None, 1 = Show, 2 = Show with ticker | 1 |
property | 0 = Date, 1 = Close, 2 = Open, 3 = High, 4 = Low, 5 = Volume | Multiple |
Example: Daily Closes for 2025
=STOCKHISTORY("AAPL", DATE(2025,1,2), DATE(2025,12,31), 0, 1, 0, 1)
Returns a two-column table with Date and Close for every trading day.
Example: Monthly OHLCV
=STOCKHISTORY("MSFT", DATE(2020,1,1), TODAY(), 2, 1, 0, 2, 3, 4, 1, 5)
Returns monthly Open, High, Low, Close, and Volume.
Common Errors
- #VALUE! - Ticker not recognized. Double-check the symbol
- #CALC! - Date range contains only non-trading days. Extend the range
- #SPILL! - Cells below the formula contain data. Clear them
- Empty results - International tickers may not be available through Refinitiv
Limitations
- Only available in Microsoft 365
- Data source is Refinitiv - no control over the provider
- No intraday granularity
- No fundamental data (P/E, revenue, dividends)
- No options or derivatives data
- Maximum date range may be limited for some tickers
Excel Stock Functions: Power Query for Stock Data
Power Query (Get & Transform) can connect to REST APIs, CSV feeds, or web pages to import stock data into Excel tables.
Steps
- Go to Data - Get Data - From Other Sources - From Web
- Enter the API endpoint URL (e.g., Alpha Vantage, Twelve Data)
- Power Query opens the navigator - select the data table
- Transform columns (change types, rename headers, filter dates)
- Click Close & Load to push data into a worksheet table
Advantages
- Handles JSON, XML, CSV, and HTML tables
- Supports scheduled background refresh
- Excellent for bulk historical data imports
Disadvantages
- Data lands in a table, not individual cells
- Requires manual or scheduled refresh - not streaming
- API authentication can be complex
- Not practical for real-time dashboards
Excel Stock Functions: GOOGLEFINANCE Comparison
If you also work in Google Sheets, the GOOGLEFINANCE function provides a comparison point. GOOGLEFINANCE is free, supports about 18 attributes (price, volume, P/E, EPS, market cap), and includes basic historical daily/weekly data. However, it is locked to Google Sheets, has 20-minute data delays, no dividend data, no technical indicators, and no options support. For a detailed comparison, see our Google Finance Formulas guide.
Excel Stock Functions: MarketXLS - The Professional Add-In
MarketXLS is an add-in for Excel (and a Google Sheets add-on) that adds 1000+ spreadsheet functions for quotes, historical prices, fundamentals, options chains, Greeks, and technical indicators. Quotes come from QuoteMedia. On the Standard plan, US stock quotes are 15-minute delayed; the Advanced and Business plans stream real-time US stock and options data (pricing).
On Windows, the desktop add-in uses formulas as written here, such as =Last("AAPL"). On Mac and Excel for the web, the Microsoft 365 add-in uses the mxls. prefix, such as =mxls.Last("AAPL"). Some functions differ by platform; check the formulas page.
Real-Time Price Functions
| Function | What It Returns | Example |
|---|---|---|
=LAST("AAPL") | Last trade price | Typically 15-minute delayed |
=QM_LAST("AAPL") | Last price via QuoteMedia | Snapshot on recalculation |
=QM_STREAM_LAST("AAPL") | Streaming real-time price | Auto-updates as trades happen |
=BID("AAPL") | Current bid price | Returns bid |
=ASK("AAPL") | Current ask price | Returns ask |
=PREVIOUSCLOSE("AAPL") | Previous close | Returns yesterday's close |
=CHANGE("AAPL") | Price change | Returns change since close |
=VOLUME("AAPL") | Current volume | Returns today's volume |
=LAST("AAPL") is the simplest MarketXLS function for a price: it returns the last trade price, typically delayed 15 minutes. =QM_LAST("AAPL") returns an on-demand QuoteMedia snapshot that updates when Excel recalculates. =QM_STREAM_LAST("AAPL") updates the cell automatically while streaming is on, and needs a plan with real-time data.
Historical Data Functions
| Function | What It Returns |
|---|---|
=QM_GETHISTORY("AAPL") | Full OHLCV history table |
=GETHISTORY("AAPL","2025-01-01","2025-12-31","D") | Custom date range |
=OPEN_HISTORICAL("AAPL","2025-06-01") | Historical open price |
=CLOSE_HISTORICAL("AAPL","2025-06-01") | Historical close price |
=HIGH_HISTORICAL("AAPL","2025-06-01") | Historical high |
=LOW_HISTORICAL("AAPL","2025-06-01") | Historical low |
=ADJUSTED_CLOSE_HISTORICAL("AAPL","2025-06-01") | Split/dividend-adjusted close |
=QM_GETHISTORY("AAPL") spills a daily OHLCV table into your sheet, which replaces manual CSV downloads.
Fundamental Data Functions
| Function | What It Returns |
|---|---|
=PERATIO("AAPL") | P/E ratio |
=FORWARDPE("AAPL") | Forward P/E |
=TRAILINGPE("AAPL") | Trailing P/E |
=PEGRATIO("AAPL") | PEG ratio |
=PRICETOBOOK("AAPL") | Price-to-book ratio |
=MARKETCAPITALIZATION("AAPL") | Market capitalization |
=DIVIDENDYIELD("AAPL") | Dividend yield |
=DIVIDENDPERSHARE("AAPL") | Dividend per share |
=PAYOUTRATIO("AAPL") | Payout ratio |
=PROFITMARGIN("AAPL") | Profit margin |
=OPERATINGMARGIN("AAPL") | Operating margin |
=REVENUEGROWTH("AAPL") | Revenue growth rate |
=BETA("AAPL") | Beta |
=SECTOR("AAPL") | Sector classification |
=INDUSTRY("AAPL") | Industry classification |
=REVENUE("AAPL") | Total revenue |
=TOTALDEBT("AAPL") | Total debt |
=TOTALCASH("AAPL") | Cash on hand |
=BOOKVALUEPERSHARE("AAPL") | Book value per share |
Technical Indicator Functions
| Function | What It Returns |
|---|---|
=RSI("AAPL") | 14-day Relative Strength Index |
=SIMPLEMOVINGAVERAGE("AAPL",50) | 50-day SMA |
=SIMPLEMOVINGAVERAGE("AAPL",200) | 200-day SMA |
=EXPONENTIALMOVINGAVERAGE("AAPL",12) | 12-day EMA |
=EXPONENTIALMOVINGAVERAGE("AAPL",26) | 26-day EMA |
=FIFTYTWOWEEKHIGH("AAPL") | 52-week high |
=FIFTYTWOWEEKLOW("AAPL") | 52-week low |
Options Data Functions
Excel's built-in stock functions do not cover options. MarketXLS returns option chains, contract prices, and Greeks:
=QM_GETOPTIONCHAIN("^SPX")                    // Full option chain
=OPTIONSYMBOL("AAPL","2026-06-19","C",200)     // Build option symbol
=QM_LAST("@AAPL 260619C00200000")              // Option contract price
=QM_GETOPTIONQUOTESANDGREEKS("^SPX")           // Full Greeks and IV
=IMPLIEDVOLATILITY("AAPL")                     // Current implied volatility
Formula documentation: QM_GETOPTIONCHAIN, OPTIONSYMBOL, QM_LAST, QM_GETOPTIONQUOTESANDGREEKS, IMPLIEDVOLATILITY
Historical Financial Statement Data
=HF_REVENUE("AAPL",2025)              // 2025 revenue
=HF_NET_INCOME("AAPL",2025)           // 2025 net income
=HF_FREE_CASH_FLOW("AAPL",2025)       // 2025 free cash flow
=HF_TOTAL_ASSETS("AAPL",2025)         // 2025 total assets
Formula documentation: HF_REVENUE, HF_NET_INCOME, HF_FREE_CASH_FLOW, HF_TOTAL_ASSETS
Excel Stock Functions: Head-to-Head Comparison
| Capability | STOCK Data Type | STOCKHISTORY | Power Query | GOOGLEFINANCE | MarketXLS |
|---|---|---|---|---|---|
| Platform | Excel 365 | Excel 365 | Excel (all) | Google Sheets | Excel + Sheets |
| Cost | Included | Included | Included | Free | Subscription |
| Real-time | Delayed snapshot | No | No | Up to 20-min delay | 15-min delayed (Standard); real-time streaming (Advanced, Business) |
| Historical | No | Daily/Weekly/Monthly | Via API | Daily/Weekly | Full OHLCV |
| Fundamentals | ~15 fields | No | Via API | ~10 fields | Hundreds of fields in a 1000+ function library |
| Options | No | No | No | No | Full chains + Greeks |
| Technical | No | No | No | No | RSI, SMA, EMA |
| Dividends | Limited | No | Via API | No | Full coverage |
| Streaming | No | No | No | No | Yes |
Excel Stock Functions: Building a Real-Time Dashboard
A stock dashboard in Excel is a ticker column plus one MarketXLS formula per metric column. The steps:
Step 1: Set Up Your Ticker List
In column A, list your tickers: AAPL, MSFT, GOOGL, AMZN, NVDA, TSLA, META, JPM, V, UNH.
Step 2: Pull Prices
In column B, use MarketXLS:
=LAST(A2)
Formula documentation: LAST
Copy down for each ticker. For streaming prices on a real-time plan, use =QM_STREAM_LAST(A2) instead.
Step 3: Add Key Metrics
| Column | Formula | Description |
|---|---|---|
| C | =PREVIOUSCLOSE(A2) | Previous close |
| D | =CHANGE(A2) | Daily change |
| E | =VOLUME(A2) | Trading volume |
| F | =PERATIO(A2) | P/E ratio |
| G | =BETA(A2) | Beta |
| H | =RSI(A2) | RSI (14-day) |
| I | =SIMPLEMOVINGAVERAGE(A2,50) | 50-day SMA |
| J | =DIVIDENDYIELD(A2) | Dividend yield |
Step 4: Add Conditional Formatting
- Highlight RSI cells red when > 70 (overbought) and green when < 30 (oversold)
- Highlight dividend yields above 3% in green
- Highlight negative daily changes in red
Step 5: Create Charts
Select price and SMA columns to create a combo chart overlaying the moving average on daily prices. Add a volume bar chart below for context.
Step 6: Add a Historical Data Sheet
On a separate sheet, use =QM_GETHISTORY(A2) to spill full OHLCV history for any ticker. Reference this data in charts or analysis formulas on other sheets.
Step 7: Add an Options Monitor
On a third sheet:
=QM_GETOPTIONCHAIN("^SPX")
Formula documentation: QM_GETOPTIONCHAIN
This pulls the full S&P 500 options chain with strikes, bids, asks, volume, open interest, and Greeks.
Automating Refresh
On-demand MarketXLS functions such as =LAST() and =QM_LAST() update when Excel recalculates (press F9 or use the MarketXLS ribbon refresh). =QM_STREAM_LAST() functions update automatically while streaming is on, with no manual refresh.
Excel Stock Functions: What "Real-Time" Actually Means
"Real-time" in Excel can mean three different things, and each needs a different function:
- Snapshot quote. You ask Excel for the current price, Excel returns the last traded price at that moment, and the cell does not change until you refresh.
- Streaming quote. Excel keeps a subscription open to the feed and updates the cell tick by tick during market hours.
- Historical close. You ask for an OHLC series across a date range. It changes once per session, not second to second.
Different parts of a workbook need different definitions. A position sizing sheet calculating the dollar value of 50 shares can use a snapshot. A scrolling watchlist on a second monitor wants a stream. A backtest or a 200-day moving average wants history. MarketXLS exposes a function for each.
| Use Case | Formula | Behavior |
|---|---|---|
| Latest snapshot | =QM_LAST("AAPL") | Pulls last traded price on recalculation |
| Live streaming during market hours | =QM_STREAM_LAST("AAPL") | Updates automatically while streaming is on |
| Simple quote | =LAST("AAPL") | Last trade price, typically 15-minute delayed |
| Full OHLC history | =QM_GETHISTORY("AAPL") | Spills an array of historical bars |
Keep the streaming set small. Each unique streamed symbol or option contract uses one live symbol subscription, so snapshot functions suit large watchlists and streaming suits the tickers you actively watch.
Excel Stock Functions: Additional Reference Functions
These round out the reference set used in most price and fundamentals dashboards:
=NAME("AAPL")                     Company name
=EARNINGSPERSHARE("AAPL")         EPS
=RETURNONEQUITY("AAPL")           Profitability
=TOTALDEBTTOEQUITY("AAPL")        Balance sheet leverage
=RELATIVESTRENGTHINDEX("AAPL")    RSI, long-form alias of =RSI()
Formula documentation: NAME, EARNINGSPERSHARE, RETURNONEQUITY, TOTALDEBTTOEQUITY, RELATIVESTRENGTHINDEX, RSI
=RELATIVESTRENGTHINDEX() and =RSI() return the same value. Older workbooks tend to use the long form, so both names appear in circulation.
Excel Stock Functions: Workarounds That Will Bite You
A few patterns show up constantly in forum threads. Avoid all three:
- Scraping any consumer finance website that has not licensed its data for spreadsheet use. Most consumer sites prohibit this in their terms of service, the underlying HTML changes regularly, and the workbook breaks without warning.
- Manually typing prices each morning. The data is stale the moment you save the file, and any moving average or correlation you calculate no longer matches the broker screen.
- Using random "free API" keys posted online. Free tiers are usually 5 to 15 minutes delayed, low volume, and unstable. Wiring up retry logic and key rotation costs more time than a real data layer.
Excel Stock Functions: Tips for Maximum Performance
- Use named ranges for ticker lists so formulas stay readable
- Combine STOCKHISTORY with XLOOKUP to pull a specific date's close from a spilled range
- Put
=TODAY()in one cell and reference it everywhere to reduce recalculation overhead - Cache historical data by pasting values once you have the range you need
- Use Excel Tables (Ctrl+T) so new tickers automatically inherit formulas
- Use
=LAST()for snapshots and=QM_STREAM_LAST()only for actively monitored tickers - Start from a MarketXLS template: pre-built workbooks for portfolio tracking, options analysis, and screening
Excel Stock Functions: Download Templates
We have created ready-to-use templates demonstrating every excel stock function discussed in this guide:
- - Contains sample data and formula references
- - Contains live formulas (requires MarketXLS add-in)
Each workbook includes six sheets: How To Use, Main Dashboard, Scenario Analysis, Strategy, Portfolio Comparison, and Correlation Matrix.
A second pair of workbooks focuses specifically on the price layer - live quotes, historical data, a technical snapshot, fundamentals, and a portfolio sheet:
- - live formulas you repoint to any ticker
- - values pre-filled so you can read the layout without the add-in
Excel Stock Functions: Frequently Asked Questions
Is there a free stock function built into Excel?
Yes. If you have Microsoft 365, the Stocks data type and the STOCKHISTORY function are included at no extra cost. They provide delayed quotes and historical daily prices for most major equities. For real-time streaming, options data, dividends, or technical indicators, you will need an add-in like MarketXLS.
How do I get real-time stock prices in Excel?
Excel's built-in Stocks data type only gives delayed snapshots. For real-time prices, use a MarketXLS plan with real-time data (Advanced or Business for US stocks) and the formula =QM_STREAM_LAST("AAPL"), which updates the cell automatically while streaming is on. On the Standard plan, =LAST("AAPL") and =QM_LAST("AAPL") return 15-minute delayed quotes.
Can I pull options data into Excel?
Excel's built-in functions do not support options. MarketXLS fills this gap with =QM_GETOPTIONCHAIN("^SPX") for full option chains and =QM_GETOPTIONQUOTESANDGREEKS("^SPX") for Greeks, implied volatility, and bid/ask data. You can also build option symbols programmatically with =OPTIONSYMBOL().
Does STOCKHISTORY work in Excel 2019?
No. The STOCKHISTORY function requires Microsoft 365 (formerly Office 365). It is not available in perpetual-license versions like Excel 2019 or 2016. For those versions, MarketXLS or Power Query are the best alternatives for historical stock data.
What is the difference between =LAST() and =QM_STREAM_LAST() in MarketXLS?
=LAST("AAPL") returns the last trade price (typically 15-minute delayed) when the workbook recalculates, and the value stays fixed until the next recalculation. =QM_STREAM_LAST("AAPL") updates the cell automatically while streaming is on and requires a real-time plan. Use =LAST() for end-of-day analysis and =QM_STREAM_LAST() for active intraday monitoring.
How many stocks can I track at once?
Snapshot functions such as =LAST() have no fixed ticker limit; performance depends on your machine and workbook size. Streaming is limited: each unique streamed symbol or option contract uses one live symbol subscription, and MarketXLS options tracking is limited to 300 symbols. Reserve =QM_STREAM_LAST() for actively monitored tickers and use =LAST() for the rest.
Excel Stock Functions: Summary
For simple price lookups and historical charts, the built-in Stocks data type and STOCKHISTORY in Microsoft 365 are enough. For streaming quotes, fundamentals beyond about 15 fields, options chains, technical indicators, and dividend data, you need an add-in such as MarketXLS.
The best approach is to layer these tools: use STOCKHISTORY for quick historical pulls, Power Query for bulk imports, and MarketXLS functions like =LAST(), =PERATIO(), =RSI(), and =QM_GETHISTORY() for everything else. See MarketXLS pricing for plans: Standard starts at $70/month billed annually, with 15-minute delayed stock quotes.
