

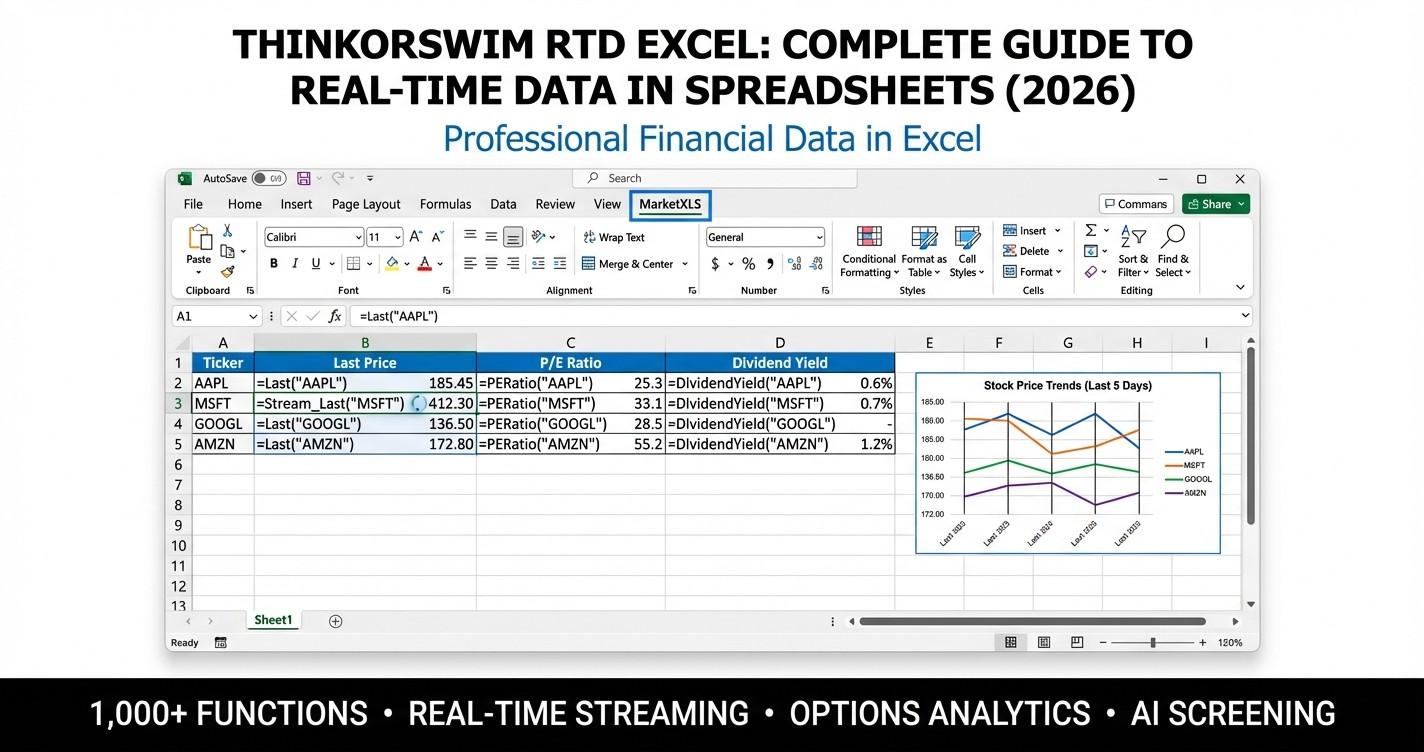
Thinkorswim RTD streams live quotes from the Thinkorswim desktop platform into Excel with formulas like =RTD("TOS.RTD", , "LAST", "AAPL"). To use it, enable Excel RTD in Thinkorswim's Application Settings, keep Thinkorswim running and logged in, and use desktop Excel on Windows. RTD is free with a Charles Schwab account but returns only basic price and volume fields, so it has no fundamentals, technical indicators, or history. This guide covers setup, every common RTD field, troubleshooting, and how MarketXLS functions can fill the data gaps in the same workbook.
What Is Thinkorswim RTD?
Thinkorswim (TOS) RTD is a technology built into the Thinkorswim trading platform (now part of Charles Schwab after the TD Ameritrade merger) that enables users to pull real-time market data into Microsoft Excel. RTD stands for Real-Time Data, and it works through a COM (Component Object Model) server that Thinkorswim registers on your Windows system when you install the desktop application.
The core concept is simple: you write a special Excel formula that connects to the Thinkorswim RTD server, specify what data you want (price, volume, bid, ask, etc.) and for which symbol, and Excel displays the live data that updates automatically as the market moves.
This technology is particularly valuable for traders who:
- Need to monitor multiple instruments simultaneously in a familiar spreadsheet environment
- Want to combine live market data with custom calculations and models
- Prefer Excel's flexibility over the Thinkorswim platform's built-in charting tools
- Are building automated alert systems or trading signal generators
How to Set Up Thinkorswim RTD in Excel
Setting up Thinkorswim RTD requires several prerequisites and configuration steps. Here is a detailed walkthrough:
Prerequisites
Before you begin, ensure you have:
- Thinkorswim Desktop installed on a Windows PC (the web version does not support RTD)
- Microsoft Excel desktop version (not the web app or mobile version)
- An active Charles Schwab brokerage account (formerly TD Ameritrade)
- Thinkorswim must be running and logged in for RTD data to stream
- Your Excel bit version (32-bit or 64-bit) should match your Thinkorswim installation
Step 1: Enable RTD in Thinkorswim
- Open the Thinkorswim platform and log in with your credentials
- Navigate to Setup in the top menu, then select Application Settings
- Go to the General tab
- Find the setting labeled Enable Excel RTD (sometimes listed as DDE/RTD)
- Toggle this setting to Enabled
- Restart Thinkorswim if prompted to apply the changes
Step 2: Understand the Basic RTD Formula
The core RTD formula follows this syntax:
=RTD("TOS.RTD", , "FIELD", "SYMBOL")
Breaking down each parameter:
"TOS.RTD"- the name of the RTD COM server registered by Thinkorswim- The second parameter (empty between the commas) is the server name, which you leave blank for local connections
"FIELD"- the specific data point you want to retrieve"SYMBOL"- the ticker symbol for the security
For example, to get the last traded price of Apple stock:
=RTD("TOS.RTD", , "LAST", "AAPL")
Step 3: Available RTD Fields
Here are the most commonly used RTD field names:
- LAST - Last traded price
- BID - Current bid price
- ASK - Current ask price
- VOLUME - Total volume traded for the day
- HIGH - Day's high price
- LOW - Day's low price
- OPEN - Opening price
- CLOSE - Previous session's closing price
- NET_CHANGE - Net price change for the day
- MARK - Mark price (midpoint of bid-ask for options)
- BID_SIZE - Number of shares at the bid
- ASK_SIZE - Number of shares at the ask
- LAST_SIZE - Size of the last trade
- PERCENT_CHANGE - Percentage change for the day
Step 4: Build Your First RTD Dashboard
Once the basic formula works, you can construct a multi-stock dashboard:
- In column A, list your ticker symbols (AAPL, MSFT, GOOGL, etc.)
- In column B, enter
=RTD("TOS.RTD",,"LAST",A1)and drag the formula down - In column C, use
=RTD("TOS.RTD",,"BID",A1)for bid prices - In column D, use
=RTD("TOS.RTD",,"ASK",A1)for ask prices - In column E, use
=RTD("TOS.RTD",,"VOLUME",A1)for volume - In column F, use
=RTD("TOS.RTD",,"NET_CHANGE",A1)for daily change
This creates a live-updating watchlist entirely within Excel that refreshes automatically as market data streams in.
Limitations of Thinkorswim RTD
While Thinkorswim RTD is a useful tool, it has several significant limitations that traders should understand:
Windows-Only Compatibility
Thinkorswim RTD relies on Windows COM technology, which means it does not work on macOS. If you use a Mac - or switch between Windows and Mac - RTD is not an option. This is one of the most frequently cited frustrations among traders who prefer Apple hardware.
Requires Thinkorswim Running
The RTD server only streams data while the Thinkorswim desktop application is running and logged in. If Thinkorswim closes, crashes, or your session expires, all RTD formulas in Excel stop updating and may display errors. This means you need to dedicate system resources to keeping Thinkorswim active at all times.
Limited Data Fields
Thinkorswim RTD provides approximately 15-20 basic price and volume fields. It does not offer:
- Historical price data
- Fundamental data (PE ratio, revenue, earnings)
- Technical indicators (RSI, moving averages, MACD)
- Options chain data with Greeks
- Portfolio-level analytics
- Risk metrics like Sharpe ratio or beta
For anything beyond basic real-time price data, you need additional tools.
Performance Degradation
Excel performance degrades significantly when you have more than 200-300 RTD formulas active simultaneously. Large watchlists can cause Excel to become sluggish or unresponsive, especially on older hardware.
Single Broker Dependency
RTD only works with the Thinkorswim platform. If you switch brokers or use multiple brokerage accounts, you cannot use TOS RTD for your other accounts.
Thinkorswim RTD vs DDE: Understanding the Protocols
Before RTD became the standard, many broker platforms used DDE (Dynamic Data Exchange) to stream data into Excel. Understanding the difference helps contextualize why RTD is the preferred approach:
DDE (Dynamic Data Exchange) is an older Windows inter-process communication protocol from the 1990s. It is less reliable, more prone to disconnection, and has been deprecated by Microsoft. Some older broker platforms still support DDE, but it is being phased out.
RTD (Real-Time Data) is a newer COM-based protocol specifically designed for streaming data into Excel. It is more reliable, handles reconnection better, and is the recommended approach for all modern Excel data streaming applications.
If your broker offers both DDE and RTD, always choose RTD. It provides a more stable and consistent data streaming experience.
MarketXLS: A More Powerful Alternative to Thinkorswim RTD
Thinkorswim RTD covers basic price monitoring. MarketXLS is an Excel add-in that adds fundamentals, technicals, risk metrics, options, and history as formulas. Here is a detailed comparison:
Data Scope
Thinkorswim RTD provides approximately 15-20 price and volume fields. MarketXLS offers over 1,000 financial functions covering:
- Prices:
=LAST("AAPL"), equivalent to RTD's LAST field without a broker platform running (15-minute delayed on the Standard plan, real-time on Advanced and Business) - Previous close:
=PreviousClose("AAPL")- yesterday's closing price - Volume:
=Volume("AAPL")- current trading volume - Fundamental data:
=PERatio("AAPL"),=Revenue("AAPL"),=DividendYield("AAPL") - Technical indicators:
=RSI("AAPL"),=SimpleMovingAverage("AAPL", 50) - Risk metrics:
=BETA("AAPL"),=SharpeRatio("AAPL"),=SortinoRatio("AAPL") - Options data: Full option chain retrieval and Greeks calculations
- Historical data: Access to historical prices for backtesting
- Dividend analysis:
=DividendPerShare("AAPL"),=ForwardAnnualDividendRate("AAPL") - Portfolio analytics:
=PortfolioVolatility(...)for portfolio-level risk assessment
Platform Compatibility
MarketXLS works on both Windows and macOS, unlike Thinkorswim RTD, which is restricted to Windows. On Mac and Excel for the web, MarketXLS runs as a Microsoft 365 add-in installed from Microsoft AppSource, and formulas use the mxls. prefix, for example =mxls.Last("AAPL"). Some functions differ by platform; check the formula library.
Broker Independence
MarketXLS operates independently of any brokerage platform. You do not need Thinkorswim, Interactive Brokers, or any other trading platform running in the background. MarketXLS pulls data from its own cloud-based data infrastructure, which means:
- No system resources consumed by a background broker application
- No dependency on broker-specific login sessions
- Consistent data access regardless of which broker you use for trading
Technical Analysis Without RTD
One of the biggest gaps in Thinkorswim RTD is the absence of technical indicators. RTD can only deliver raw price and volume data. If you want RSI, moving averages, or other technical signals, you need to calculate them manually from the raw data.
MarketXLS solves this with dedicated functions:
=RSI("AAPL")                      - 14-period Relative Strength Index
=SimpleMovingAverage("AAPL", 50)  - 50-day Simple Moving Average
=SimpleMovingAverage("AAPL", 200) - 200-day Simple Moving Average
=BETA("AAPL")                     - Stock beta relative to market
Formula documentation: RSI, SimpleMovingAverage, BETA
These functions return calculated values directly, saving you the effort of building and maintaining custom calculation formulas.
Fundamental Analysis
Thinkorswim RTD provides zero fundamental data. You cannot pull PE ratios, revenue figures, dividend yields, or any other fundamental metric through RTD. MarketXLS fills this gap comprehensively:
=PERatio("AAPL")              - Price-to-earnings ratio
=Revenue("AAPL")              - Company revenue
=DividendYield("AAPL")        - Trailing dividend yield
=DividendPerShare("AAPL")     - Dividend per share (TTM)
=DividendPayoutRatio("AAPL")  - Payout ratio
=CAGR("AAPL")                 - Compound annual growth rate
Formula documentation: PERatio, Revenue, DividendYield, DividendPerShare, DividendPayoutRatio, CAGR
Side-by-Side Comparison: RTD Fields vs MarketXLS Functions
Here is a practical mapping of common TOS RTD fields to their MarketXLS equivalents, plus the additional data available only through MarketXLS:
Available in both TOS RTD and MarketXLS:
- Last price: RTD =
=RTD("TOS.RTD",,"LAST","AAPL")/ MarketXLS ==LAST("AAPL") - Volume: RTD =
=RTD("TOS.RTD",,"VOLUME","AAPL")/ MarketXLS ==Volume("AAPL") - Previous close: RTD =
=RTD("TOS.RTD",,"CLOSE","AAPL")/ MarketXLS ==PreviousClose("AAPL")
Available only in MarketXLS (not in TOS RTD):
- PE Ratio:
=PERatio("AAPL") - Beta:
=BETA("AAPL") - RSI:
=RSI("AAPL") - Moving Average:
=SimpleMovingAverage("AAPL", 50) - Sharpe Ratio:
=SharpeRatio("AAPL") - Sortino Ratio:
=SortinoRatio("AAPL") - Dividend Yield:
=DividendYield("AAPL") - Revenue:
=Revenue("AAPL") - 52-Week High:
=FiftyTwoWeekHigh("AAPL") - 52-Week Low:
=FiftyTwoWeekLow("AAPL") - Portfolio Volatility:
=PortfolioVolatility(...) - Drawdown Analysis:
=Drawdown("AAPL")
TOS RTD covers basic price fields; MarketXLS adds the analytical fields listed above.
Building an Advanced Trading Dashboard
Whether you use Thinkorswim RTD, MarketXLS, or both together, here is how to build a professional-grade trading dashboard in Excel:
Layer 1: Real-Time Price Monitor
Set up a sheet with your core watchlist. Include columns for ticker, last price, daily change, and volume. If using MarketXLS:
=LAST("AAPL")           - Current price
=PreviousClose("AAPL")  - Yesterday's close
=Volume("AAPL")         - Today's volume
Formula documentation: LAST, PreviousClose, Volume
Layer 2: Technical Signal Generator
Add technical indicator columns to generate buy/sell signals:
=RSI("AAPL")                     - RSI value
=SimpleMovingAverage("AAPL", 50) - 50-day SMA
Formula documentation: RSI, SimpleMovingAverage
Use Excel's IF function to create signal columns:
=IF(RSI_CELL < 30, "Oversold", IF(RSI_CELL > 70, "Overbought", "Neutral"))
Layer 3: Fundamental Overlay
Include fundamental data to add context to your technical signals:
=PERatio("AAPL")        - Is the stock expensive or cheap?
=DividendYield("AAPL")  - Income generation potential
=BETA("AAPL")           - Risk relative to the market
Formula documentation: PERatio, DividendYield, BETA
Layer 4: Risk Analytics
Add portfolio-level risk metrics:
=SharpeRatio("AAPL")       - Risk-adjusted return
=SortinoRatio("AAPL")      - Downside risk focus
=FiftyTwoWeekHigh("AAPL")  - Distance from 52-week high
=FiftyTwoWeekLow("AAPL")   - Distance from 52-week low
Formula documentation: SharpeRatio, SortinoRatio, FiftyTwoWeekHigh, FiftyTwoWeekLow
Layer 5: Conditional Formatting
Apply Excel's conditional formatting to visually highlight:
- Green for positive daily changes, red for negative
- Bold for stocks near 52-week highs or lows
- Yellow background for oversold RSI readings
- Orange background for overbought RSI readings
Combining Thinkorswim RTD with MarketXLS
For traders who already have a Thinkorswim account, the most powerful approach is to use both tools together:
- Use Thinkorswim RTD for streaming bid/ask data if you need tick-level price updates for active day trading (since it comes at no additional cost with your brokerage account)
- Use MarketXLS for everything else - fundamentals, technicals, risk metrics, historical data, options analysis, and portfolio-level analytics
This hybrid workflow gives you the broadest possible data coverage without unnecessary duplication. Your day trading sheets can use RTD for millisecond-level price updates, while your analysis and research sheets use MarketXLS for the deep data that RTD simply cannot provide.
Troubleshooting Common RTD Issues
RTD Formula Returns #N/A
This typically means Thinkorswim is not running or RTD is not enabled. Verify that Thinkorswim is open and logged in, check that RTD is enabled in Application Settings, restart Excel, and confirm the ticker symbol is valid.
Data Stops Updating
The RTD connection may have dropped. Press Ctrl+Alt+F5 in Excel to force a full data refresh. Check File, then Options, then Formulas to ensure iterative calculation is unchecked. If the issue persists, restart both Thinkorswim and Excel.
Excel Becomes Slow
Too many RTD formulas cause performance bottlenecks. Limit active RTD formulas to 100-200 maximum. Set Excel's calculation mode to Manual and refresh periodically with Ctrl+Alt+F5. Consider migrating to MarketXLS functions which are optimized for handling large datasets efficiently.
"TOS.RTD" Server Not Found
The RTD COM server is not properly registered. Ensure you installed the desktop version of Thinkorswim (not the web version), verify that your Excel and Thinkorswim bit versions match (both 64-bit or both 32-bit), and try reinstalling Thinkorswim to re-register the COM components.
RTD Breaks After Platform Update
Thinkorswim updates sometimes reset RTD settings or modify the COM server registration. After any platform update, re-check the RTD enable setting in Application Settings and restart both applications.
Who Should Use Thinkorswim RTD vs MarketXLS?
Choose Thinkorswim RTD If:
- You already have an active Schwab/TOS account and want basic free real-time prices
- You only need last price, bid, ask, and volume data
- You work exclusively on Windows
- You are building a simple price monitoring watchlist
- You are comfortable with the RTD formula syntax and troubleshooting COM issues
Choose MarketXLS If:
- You need comprehensive data beyond basic prices (fundamentals, technicals, risk metrics)
- You use a Mac or switch between Windows and Mac
- You want 1,000+ financial functions available in Excel
- You need technical indicators like
=RSI()and=SimpleMovingAverage()without building them manually - You prefer not to keep a broker platform running in the background
- You need portfolio-level analytics like
=PortfolioVolatility()and=SharpeRatio() - You want to share spreadsheets with colleagues who may not have Thinkorswim
Choose Both If:
- You want free tick-level RTD data for active trading plus deep analytics from MarketXLS
- You are building sophisticated multi-layer Excel trading models
- You need the broadest possible data coverage for research and analysis
Explore MarketXLS features to see how it can enhance your Thinkorswim RTD workflow, or view pricing plans to find the right option.
Download Free Excel Templates
MarketXLS access: Downloading a workbook does not include live data access. Refreshing MarketXLS formulas requires a paid MarketXLS subscription.
We have created two downloadable templates to help you get started with real-time data analysis in Excel:
Sample Workbook (Static Data) Pre-filled with sample market data, RTD vs MarketXLS comparisons, strategy frameworks, and a correlation matrix. Use this to understand the dashboard structure before connecting live data.
Live Template (MarketXLS Formulas)
Contains live MarketXLS formulas including =LAST(), =RSI(), =BETA(), =PERatio(), and more. Yellow-highlighted cells are inputs where you enter your own tickers. Requires the MarketXLS add-in to populate data.
Both templates include six sheets: How To Use, Main Dashboard, Scenario Analysis, Strategy, Portfolio Comparison, and Correlation Matrix.
Frequently Asked Questions
What is Thinkorswim RTD and how does it work?
Thinkorswim RTD (Real-Time Data) is a technology that streams live market data from the Thinkorswim trading platform into Microsoft Excel. It uses a COM-based RTD server that Thinkorswim registers on your Windows system. You write formulas like =RTD("TOS.RTD",,"LAST","AAPL") to pull specific data points. The platform must be running and logged in for data to stream.
Does Thinkorswim RTD work on Mac?
No. Thinkorswim RTD relies on Windows COM technology that does not exist on macOS. Mac users can use the MarketXLS Microsoft 365 add-in, which works in Excel for Mac with the mxls. prefix (for example =mxls.Last("AAPL")). Real-time quotes require the Advanced or Business plan; Standard quotes are 15-minute delayed.
How many RTD formulas can I use at once?
There is no hard limit, but performance typically degrades beyond 200-300 active RTD formulas. For larger watchlists, consider using MarketXLS functions which are optimized for high-volume data requests, or set Excel to manual calculation mode and refresh periodically.
Can I get technical indicators through Thinkorswim RTD?
No. Thinkorswim RTD only provides raw price and volume data (LAST, BID, ASK, VOLUME, HIGH, LOW, etc.). For technical indicators like RSI, moving averages, and beta, you need to either calculate them manually from raw data or use MarketXLS functions like =RSI("AAPL") and =SimpleMovingAverage("AAPL", 50) which return calculated values directly.
Is Thinkorswim RTD free?
Yes, Thinkorswim RTD is included at no additional cost with any active Charles Schwab (formerly TD Ameritrade) brokerage account. You need the desktop version of Thinkorswim installed and running. There are no per-query or data fees for RTD usage.
What is the difference between RTD and DDE?
RTD (Real-Time Data) and DDE (Dynamic Data Exchange) are both protocols for streaming data into Excel. RTD is newer, more reliable, and uses COM technology. DDE is a legacy protocol from the 1990s that is less stable and being phased out by most platforms. Always choose RTD over DDE when both options are available.
Summary
Thinkorswim RTD Excel integration provides a straightforward way to pull basic real-time price data into Excel spreadsheets, making it a useful tool for simple watchlists and price monitoring. However, its limitations - Windows-only compatibility, dependence on a running broker platform, limited data fields, and absence of technical indicators and fundamentals - mean that serious traders and analysts need additional tools.
MarketXLS fills these gaps with over 1,000 financial functions covering prices (real-time on the Advanced and Business plans), fundamentals, technical indicators, risk metrics, options data, and portfolio analytics. It works on both Windows and Mac without requiring any broker platform to be running. Traders with a Schwab account can use Thinkorswim RTD for free price streaming alongside MarketXLS for fundamentals, technicals, and history in the same workbook.
