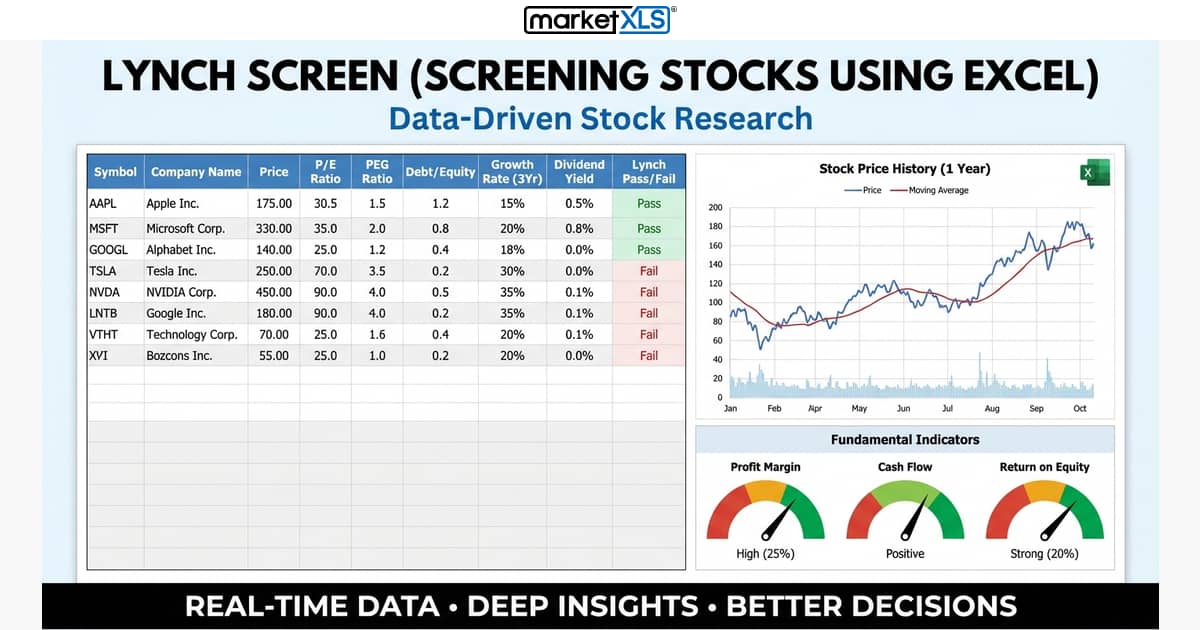
Peter Lynch screen is a growth investing strategy inspired by the approach of Peter Lynch, who looks for consistently profitable, relatively unknown, low-debt, reasonably priced stocks with high, but not excessive, growth. Peter Lynch wrote: If you stay half-alert, you can pick the spectacular performers right from your place of business or out of the */ -->
MarketXLS Blog
Expert insights on stock market analysis, investment strategies, and Excel techniques for smarter investing.
Featured Series
High volume stocks refer to the securities that investors most trade in a given period. Generally, high volume stocks are less volatile due to the high demand and, thus, less likely to see huge...
Penny stocks have had a long and exciting relationship with the stock markets. How are penny stocks different from regular stocks traded in mainstream markets?
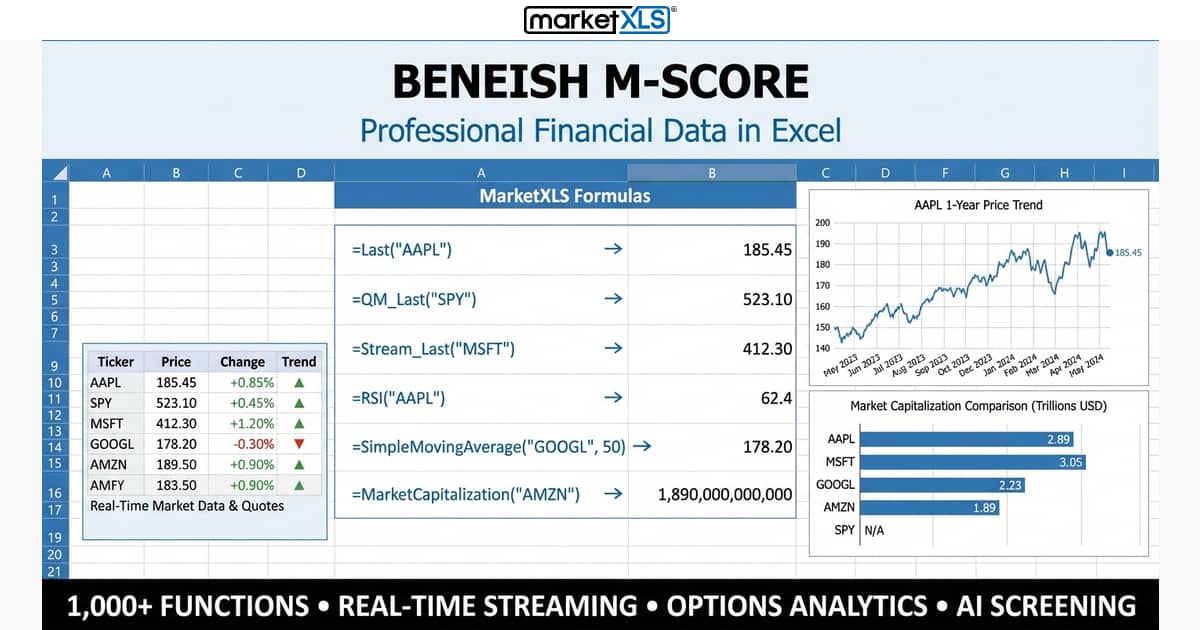
Beneish M-Score guide covering all 8 variables for detecting earnings manipulation, the complete formula, step-by-step Excel calculation, and screening strategies using MarketXLS.
Pharma penny stocks require thorough research and screening before investing. Learn how to analyze pharmaceutical small-cap stocks using MarketXLS formulas for fundamentals, revenue, and valuation.
5g penny stocks 5G is the fifth generation of cellular networks. While its predecessor 4G LTE mostly focused on high-speed video streaming, major stakeholders claim 5G to do much more than just...
As COVID-19 is forcing people to find new ways to connect, work, and live from home, tech penny stocks are finding renewed interest among the traders.
Dividends The dividend is a token of gratitude from a company to its shareholders keeping in mind the time and risk factors involved with the money they have invested.
They say, the more risk you are willing to take the more will be the reward. This is true in the case of penny stocks. You might have heard of the term at least once.
There’s more than one way to gain exposure in and profit from the stock market. Investing in stocks as the primary asset is one, and trading contract for differences or CFDs is another.
Stock volatility calculator methods explained for Excel. Learn historical vs implied volatility, annualizing returns, VIX analysis, and how to calculate volatility using MarketXLS functions.
Investing in the stock market is an excellent way to earnextra income. You can be an active trader and watch for dips and surges in themarket or be a passive investor and wait for your assets to...
What is a drawdown?A drawdown (usually understood as maximum stock drawdown) is an indicator of downside risk over a specified period of time.
Fundamental analysis of stocks explained with valuation ratios, financial statement analysis, key metrics, and step-by-step Excel tracking using MarketXLS formulas for PE ratio, revenue, market cap, and more.
How to Build an Understanding of Real Estate Stocks ! The first step to understanding real estate stocks is to try not to be intimidated by all the information you’ll find offline and online.
High Yield Dividend Stocks Searching for High Yield dividend stocks has never been easier with MarketXLS.com. Current market volatility, has driven investors to search for alternative choices.
STOP Wasting Hours on Manual Data Entry & START Making Smarter Investment Decisions
Discover how 2,500+ serious investors are saving 15+ hours every week with real-time market data directly in Excel.
✓ No credit card required • ✓ 14-day money-back guarantee • ✓ Cancel anytime