MarketXLS has added a new set of functions for analyst and earnings data. This guide provides an overview of each function and its usage. Analyst Coverage Functions These functions provide data on the number of analysts covering a stock. Example: =AnalystConsensus(AAPL) returns the number of analysts whose estimates are included in the consensus figures for */ -->
MarketXLS Blog
Expert insights on stock market analysis, investment strategies, and Excel techniques for smarter investing.
Featured Series
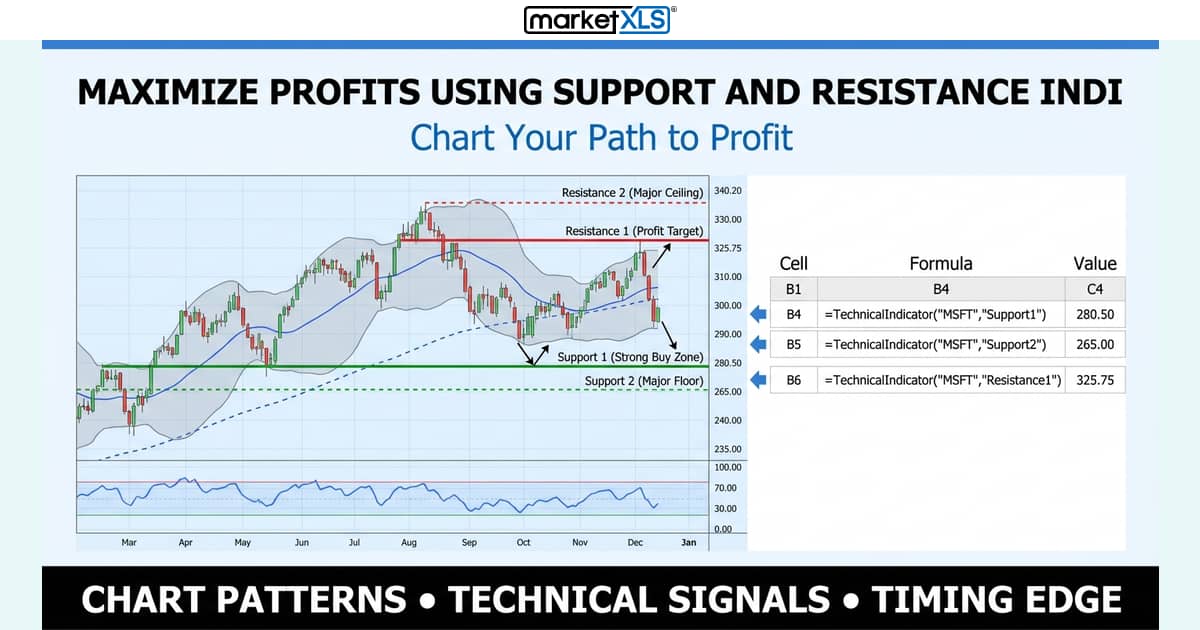
Introduction Navigating the world of trading can be complex, but understanding key concepts like Support and Resistance Indicators is crucial.
Learn how to insert real-time stock prices in Excel using built-in features, external data sources, and MarketXLS. Complete guide with step-by-step instructions for tracking multiple stocks, setting alerts, and automating updates.
Preferred stock symbols use unique ticker conventions like .P and .PR suffixes. Learn how to identify, look up, and analyze preferred shares in Excel using MarketXLS functions for dividends, pricing, and fundamentals.
Real time market data providers vary widely in cost, coverage, and integration options — this guide compares the top providers to help traders and analysts choose the best fit for their needs.
Stock Split Calculator Excel guide covering forward splits, reverse splits, cost basis adjustments, and how to track split history using formulas and MarketXLS functions.
Penny stocks under 10 Rs in the Indian market offer high risk and high potential reward. Learn how to screen, analyze, and evaluate these low-price shares using MarketXLS formulas and fundamental analysis.
S&P 500 on Google Finance uses the ticker .INX or INDEXSP:.INX. Learn how to find the S&P 500 live quote, pull it into Google Sheets, and why MarketXLS gives you deeper data with 1,000+ financial functions in Google Sheets and Excel.
Excel stock price lookup made easy — get any historical price on a specific date using STOCKHISTORY or MarketXLS functions. Works on holidays too.
Stay Up to Date With Live Stock Quotes The stock market is one of the most important sources of capital formation, and equity quotes are at the heart of understanding financial market dynamics.
Indian Stock Prices in Excel can be retrieved in real-time and historically using MarketXLS formulas. Complete guide for NSE and BSE data with step-by-step instructions for Excel 2016, 2019, and 365.
Nifty 50 Stock List explained with full sector breakdown, company details, and how to track all 50 stocks in Excel using MarketXLS formulas for price, PE ratio, market cap, and dividend yield.
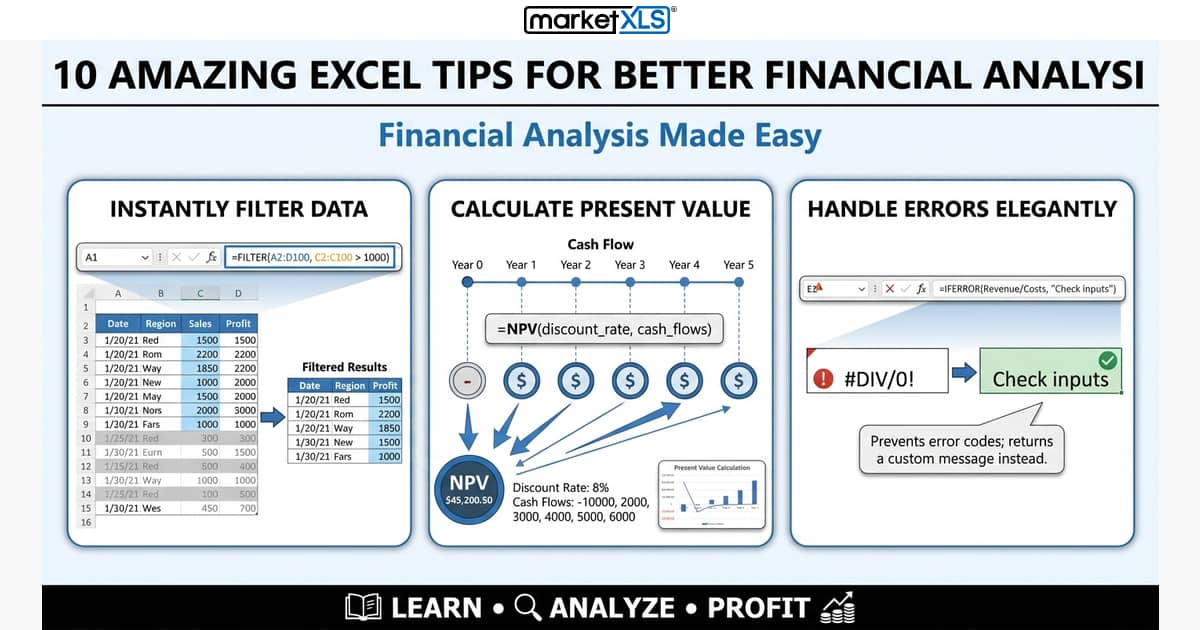
10 Amazing Excel Tips for Better Financial Analysis Excel is the backbone of financial analysis, but most users only scratch the surface of its capabilities.
Introduction to Stock Optimal Allocation Stock optimal allocation is a vital strategy for investors looking to maximize the potential of their investments.
Excel stock history formula options let you pull historical prices, calculate returns, and analyze trends directly in your spreadsheet. Learn every method with real formulas.
What are the advantages of having stock data in Excel? Excel offers a range of options to access stock data, including external data connections and stock connectors, allowing you to easily bring in...
STOP Wasting Hours on Manual Data Entry & START Making Smarter Investment Decisions
Discover how 2,500+ serious investors are saving 15+ hours every week with real-time market data directly in Excel.
✓ No credit card required • ✓ 14-day money-back guarantee • ✓ Cancel anytime