
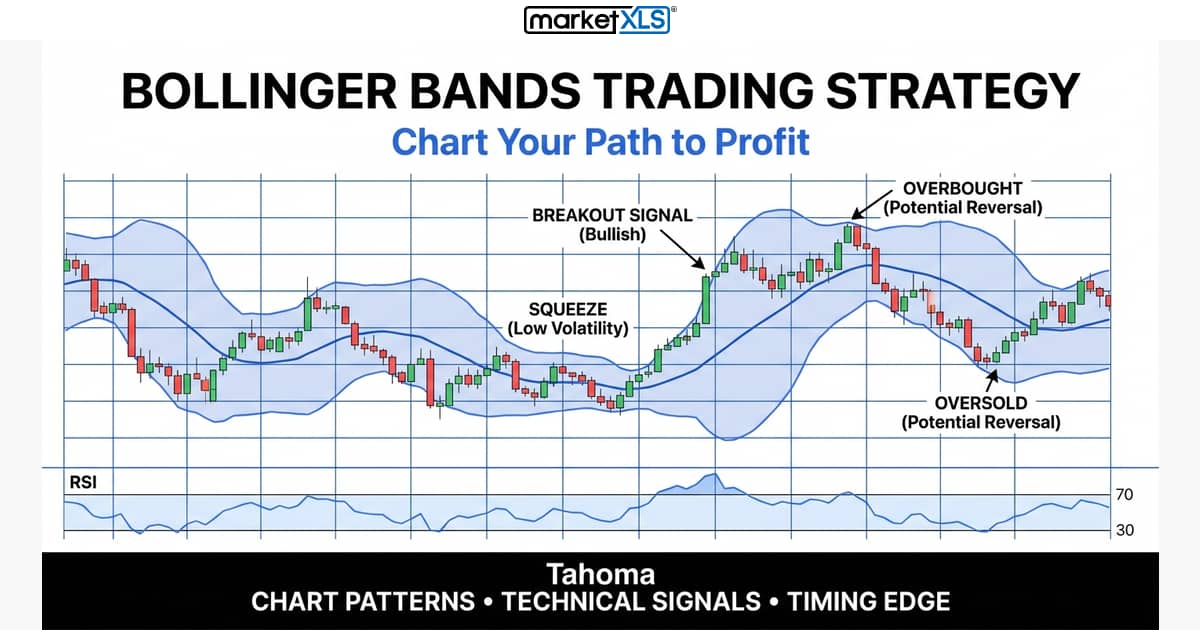
Bollinger Bands are a 20-day moving average with bands two standard deviations above and below it. Learn the squeeze, double bottom, and M top, and how to calculate them in Excel.
Stock Analysis
Expert insights on stock market analysis, investment strategies, and Excel techniques for smarter investing.
Bollinger Bands are a 20-day moving average with bands two standard deviations above and below it. Learn the squeeze, double bottom, and M top, and how to calculate them in Excel.

The dividend payout ratio is dividends per share divided by earnings per share. How to calculate and read it, with MarketXLS Excel formulas.

Margin of safety analysis compares a stock price with an estimate of value, here book value per share, to screen for shares the market may be underpricing, using Excel formulas.

How Warren Buffett built Berkshire Hathaway over its first 50 years: insurance float, wholly owned businesses, and long-term stock holdings, as described in 2014 and 2017.

An NCAV screener finds stocks priced below two-thirds of net current asset value (current assets minus total liabilities, per share), the Benjamin Graham deep value test.

Free cash flow yield is free cash flow divided by enterprise value (some analysts use market capitalization instead).

How Joel Greenblatt's magic formula ranks stocks on earnings yield and return on capital, and how to build the screen in Excel with MarketXLS formulas.

Value a stock with a free-cash-flow-to-firm (FCFF) DCF model in Excel: forecast FCFF, discount at WACC, add terminal value, subtract debt, divide by shares.

How to calculate the Piotroski F-Score in Excel: the nine pass/fail tests and the MarketXLS hf_ formulas that pull each input.

MarketXLS adds 1000+ financial-data functions to Excel and Google Sheets: quotes, price history, fundamentals, options, technical indicators, and portfolio tools.

The MarketXLS In-Depth Research screener (2016) shows 10-year trends for 150+ fundamental indicators of one stock on a single screen.

The MarketXLS Comparing Stocks screener charted one fundamental metric, such as EBIT, over 10 years for several companies side by side.
Discover how 2,500+ serious investors are saving 15+ hours every week with real-time market data directly in Excel.
✓ No credit card required • ✓ Cancel anytime