

MarketXLS 9.1 (June 2020) added a function Search and Help button, ETF holdings functions, historical volatility functions, and streaming improvements.
Platform & Product News
Expert insights on stock market analysis, investment strategies, and Excel techniques for smarter investing.
MarketXLS 9.1 (June 2020) added a function Search and Help button, ETF holdings functions, historical volatility functions, and streaming improvements.
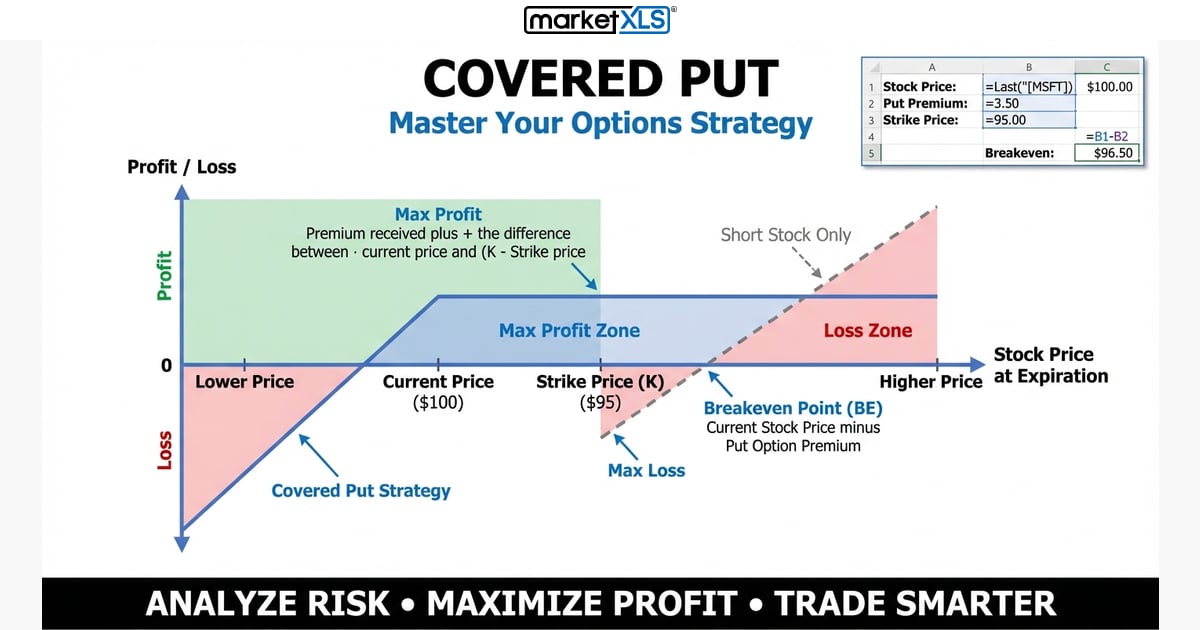
Learn about the covered put options strategy, how it works, and when to use it for income generation.

To buy stocks online: open an account with a broker, choose common or preferred shares, decide how many shares to buy, and place a market or limit order.

Portfolio beta calculator tools help investors measure systematic risk, understand market sensitivity, and optimize portfolio allocations using Excel formulas and automated analysis.
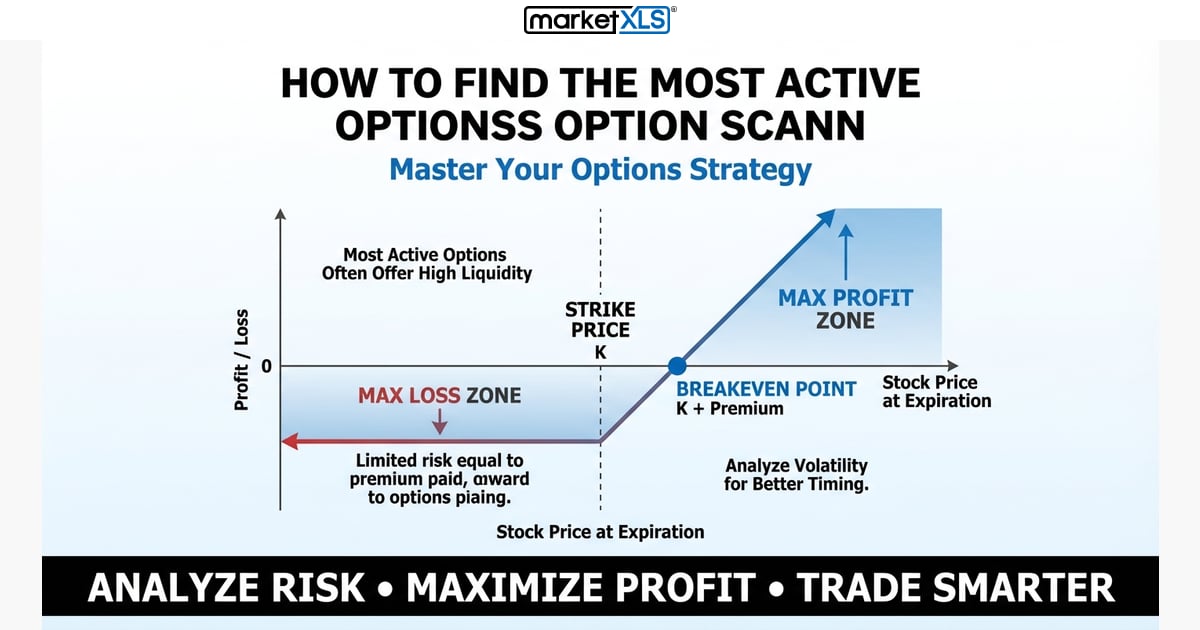
Find the most active options on your stock list in Excel with the MarketXLS Options Scanner (sort by contract volume) or =QM_GetOptionChainActive.

A stock drawdown is the percentage fall from a peak to a later trough. How to calculate maximum drawdown and use MarketXLS drawdown functions in Excel.

Fundamental analysis of stocks explained with valuation ratios, financial statement analysis, key metrics, and step-by-step Excel tracking using MarketXLS formulas for PE ratio, revenue, market cap, and more.

Historical option prices data enables traders to backtest strategies, analyze implied volatility patterns, and make informed trading decisions using Excel-based tools and real market data.

Get mutual fund NAVs into Excel with MarketXLS: =MF_Price("BIAGX") returns the latest NAV, plus yield, expense ratio, holdings, and price history.
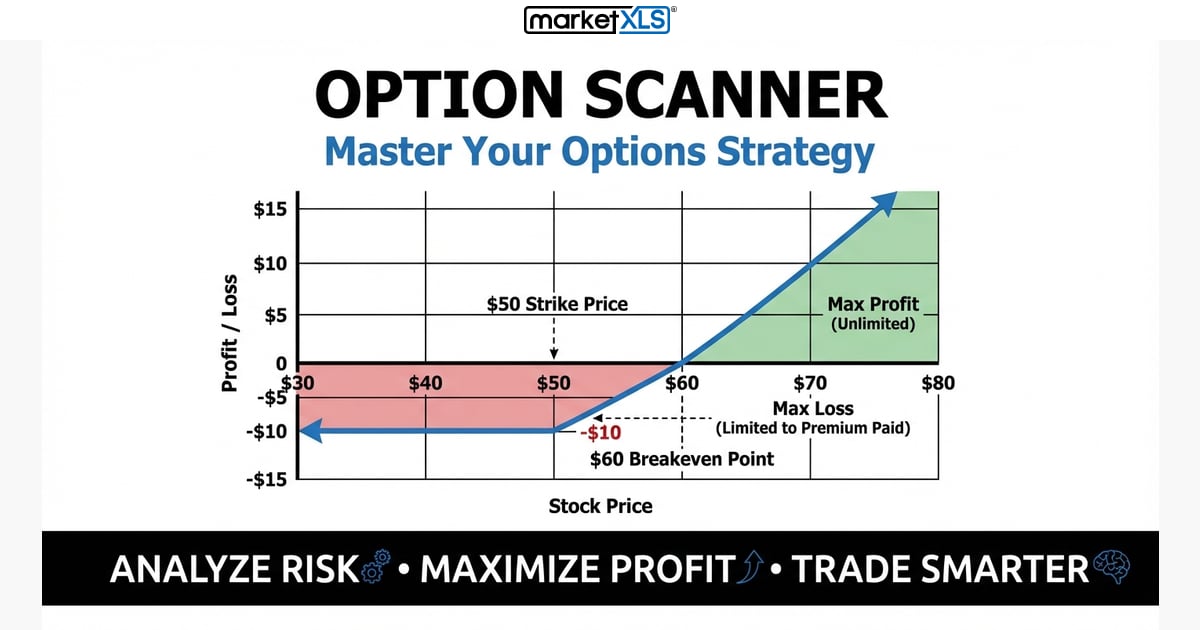
Use the MarketXLS Option Scanner to pull option chains for up to 50 stocks, filter by volume, spread, IV, delta and expiry, and send the results to Excel.

Real estate stocks are shares of companies that own, operate, develop, or finance property, most commonly REITs. How REITs work and what to check before investing.

What to check before buying high yield dividend stocks (payout ratio, dividend growth, P/E, company size), plus a January 2019 list of high-yield large caps.

Compare cash-secured puts by annualized return: (bid - fees) / strike x 365 / days to expiration. A worked Walmart example using a MarketXLS option chain in Excel.

Excel calculates the time value of money with FV, PV, NPV, IRR, PMT, NPER, and RATE. Syntax and worked examples for each function.

How to price stock options in Excel: Black-Scholes and binomial models, plus MarketXLS formulas for option chains, Greeks and streaming prices, and which plan is real-time.

Monthly dividend stocks pay every month instead of quarterly. Three examples from 2017 (Realty Income, Main Street Capital, Gladstone Commercial) and how to check yields in Excel.
Discover how 2,500+ serious investors are saving 15+ hours every week with real-time market data directly in Excel.
✓ No credit card required • ✓ Cancel anytime