
ETFs, Funds & Alternatives

An ETF expense ratio is the annual fee a fund deducts from its assets. Learn what a good expense ratio is by fund type, compare popular funds, and track fees in Excel.

How bond ETFs work: index baskets with no maturity, rate risk measured by duration, six main types, taxes, and how to compare BND, AGG, TLT and more in Excel.

ETFs trade all day and are usually more tax efficient; mutual funds price once a day at NAV. Compare cost, alpha, and benchmark fit for two funds in Excel with MarketXLS.

For investment professionals, understanding what an ETF fund is means having a methodology to deconstruct any fund, quantify its components, and determine portfolio suitability using Excel.
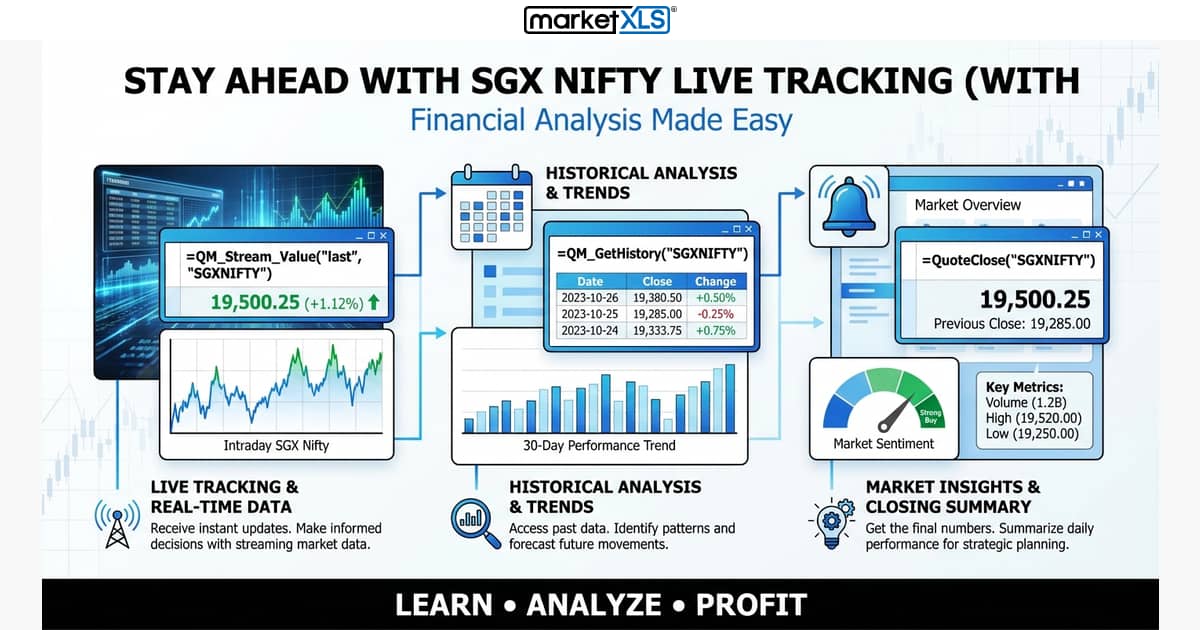
SGX Nifty was the Singapore-traded Nifty 50 futures contract; since July 2023 it trades as GIFT Nifty on NSE International Exchange. How it differs from the Nifty and how to track Nifty in Excel.

How to chart S&P 500 E-mini futures in Excel with MarketXLS streaming formulas, a data table, an Excel line chart, and a refresh or logging macro.
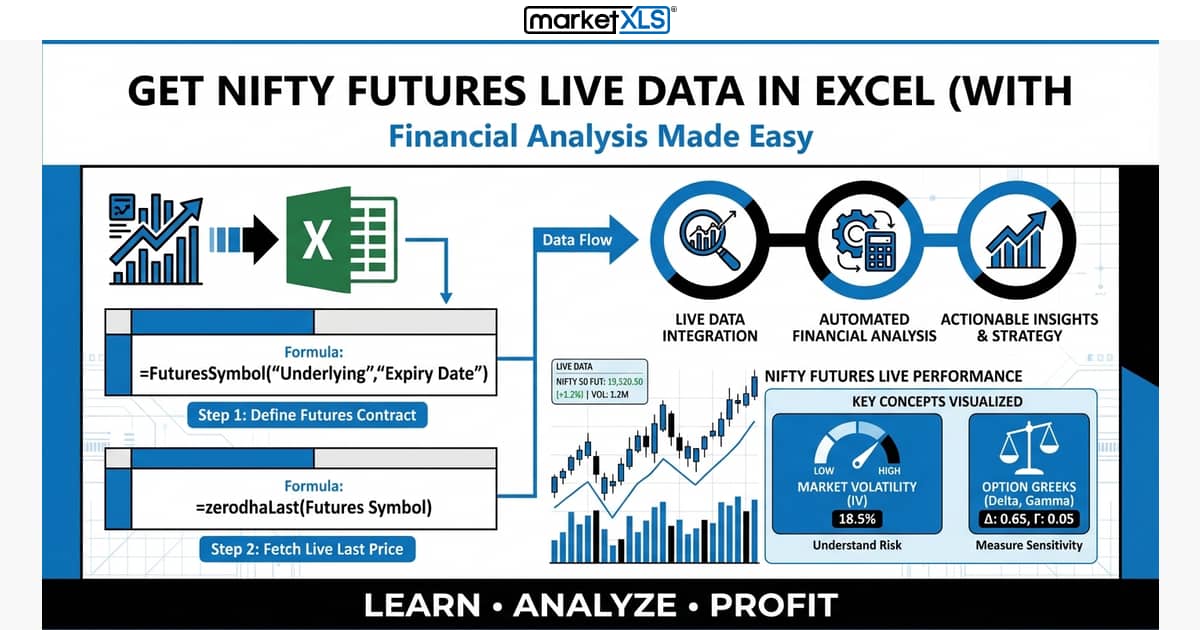
Get live Nifty futures prices in Excel with MarketXLS India: build the contract with =FuturesSymbol, then pull the price with =zerodhaLast through your Zerodha connection.
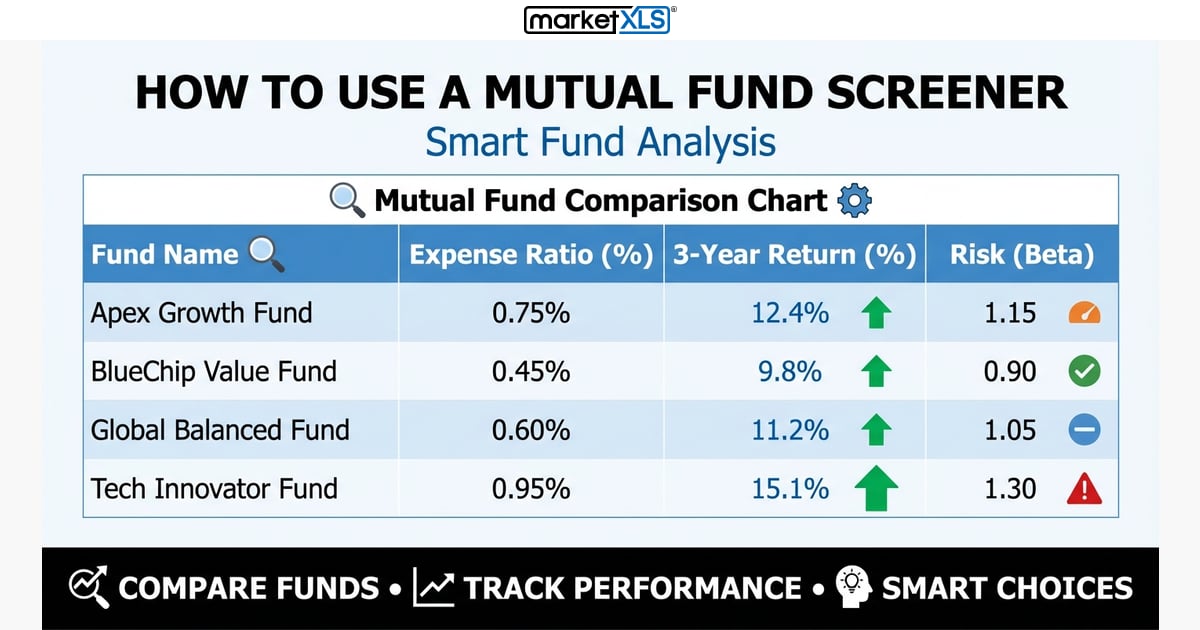
To use a mutual fund screener, set your hard limits first (category, max expense ratio), then filter on risk and multi-year returns, then compare the shortlist.
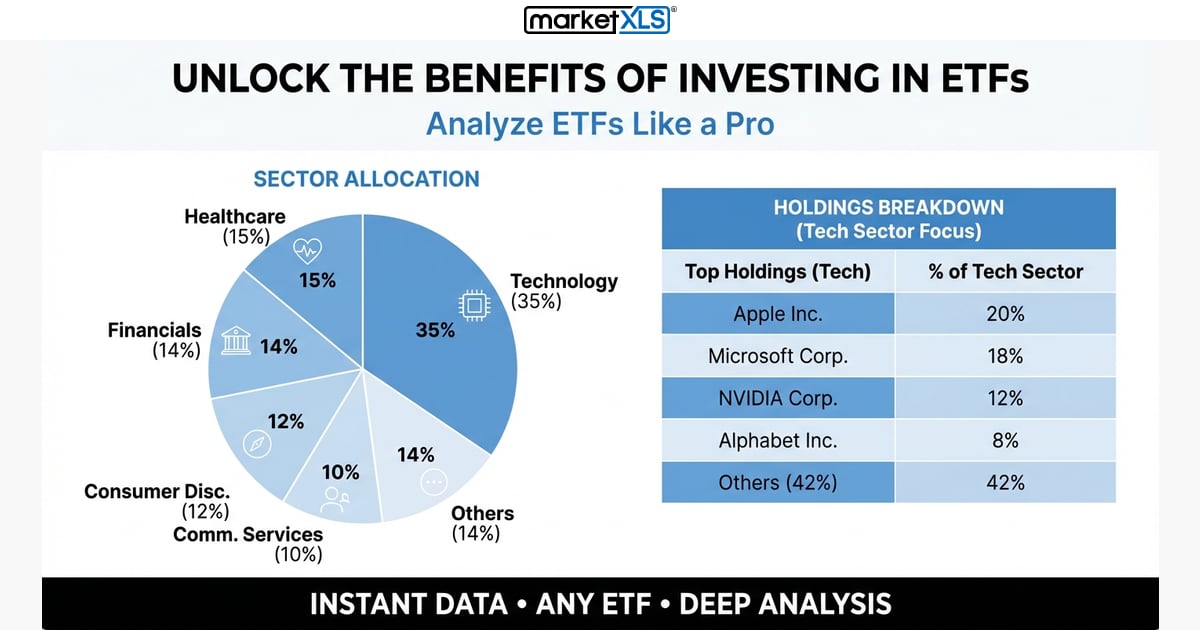
The main benefits of ETFs: instant diversification, low costs, intraday trading, access to many asset classes, and tax efficiency, plus the limits to keep in mind.
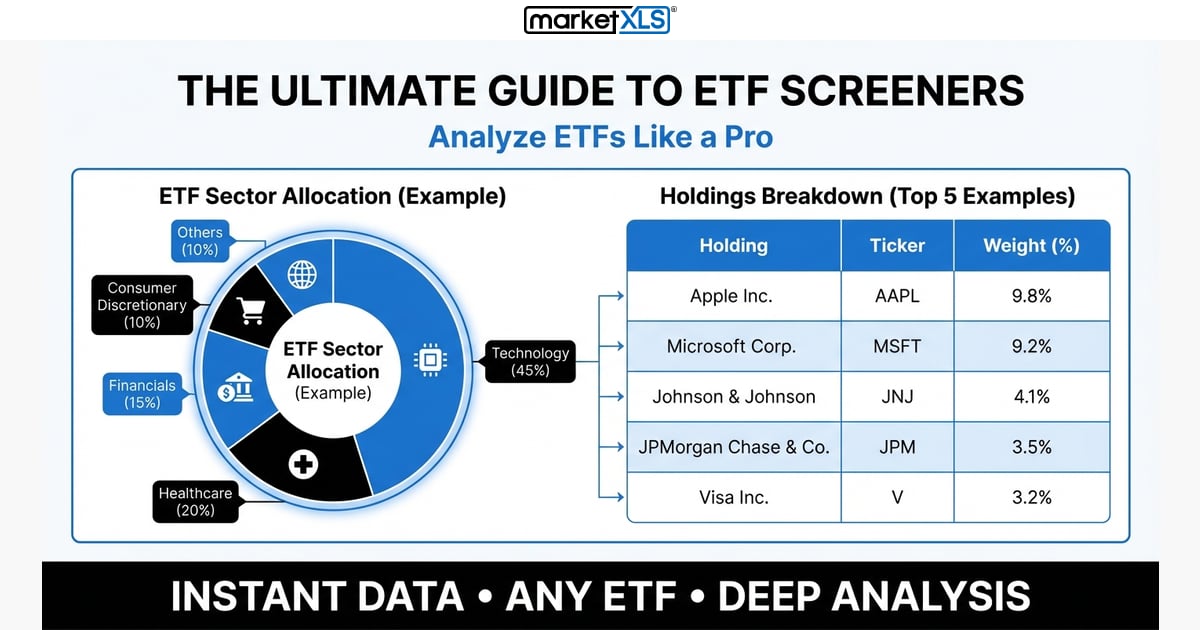
An ETF screener filters exchange-traded funds by criteria such as expense ratio, assets, liquidity, returns, volatility and holdings. What to screen on and how to use the MarketXLS ETF screener and Excel functions.
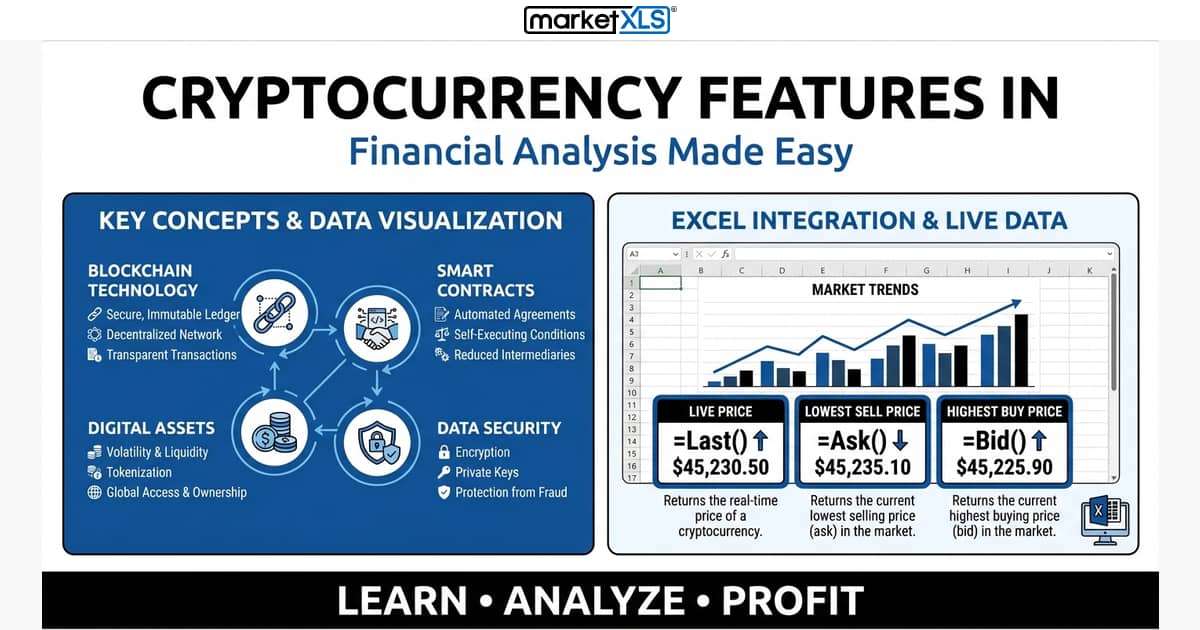
Get crypto prices in Excel with MarketXLS: add the exchange to the symbol (BTCUSD:BINANCE) or use :DEFAULT, then use Last, Bid, Ask, history, and indicator functions.

Get mutual fund NAVs into Excel with MarketXLS: =MF_Price("BIAGX") returns the latest NAV, plus yield, expense ratio, holdings, and price history.