
Investment Strategies

Data center REIT screener Excel - score EQIX, DLR, IRM, AMT, CCI, and SBAC against live MarketXLS data, run rate scenarios, and build a digital-infrastructure REIT sleeve with one workbook.

Free Excel CAPE ratio dashboard: Shiller PE history since 1881, sector valuation heatmap, and 10-year mean-reversion return scenarios for the S&P 500, with live MarketXLS formulas.
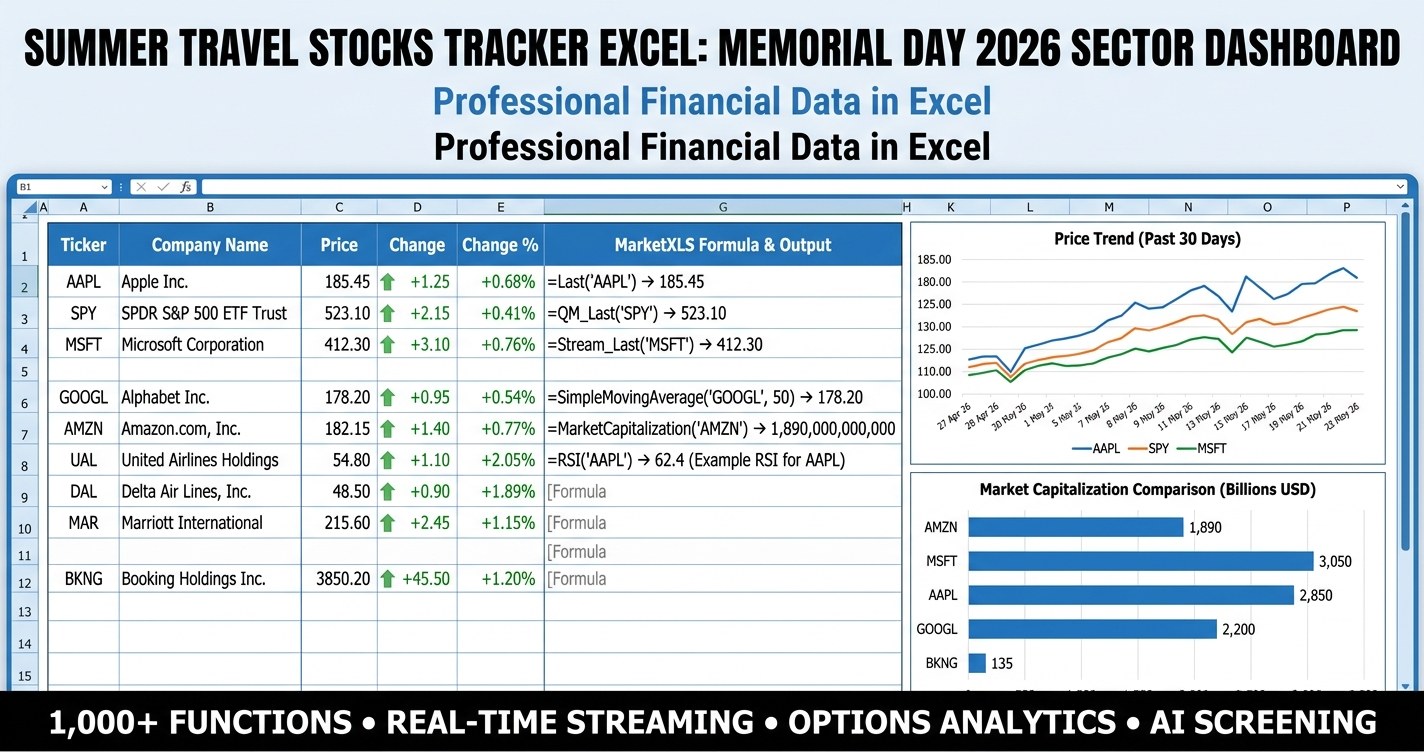
Summer travel stocks tracker excel for Memorial Day 2026 - 25 airline, cruise, hotel, OTA, and experience names in one live dashboard with sub-sector medians, scenario analysis, and allocation model.
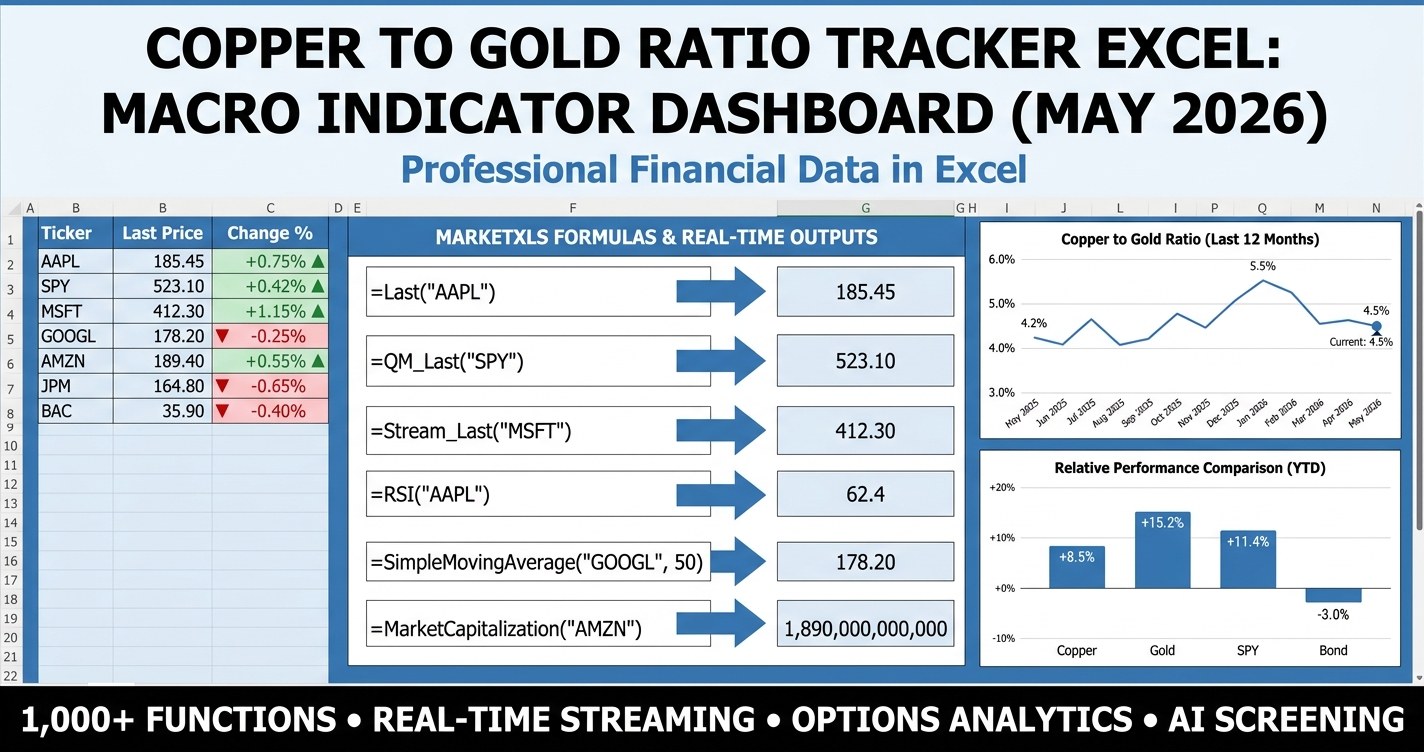
Copper to gold ratio tracker Excel - a live MarketXLS dashboard that prints the copper-to-gold ratio, compares it to the 10-year Treasury yield, screens 12 copper and gold miners, and tilts a portfolio between risk-on and risk-off based on the regime band.
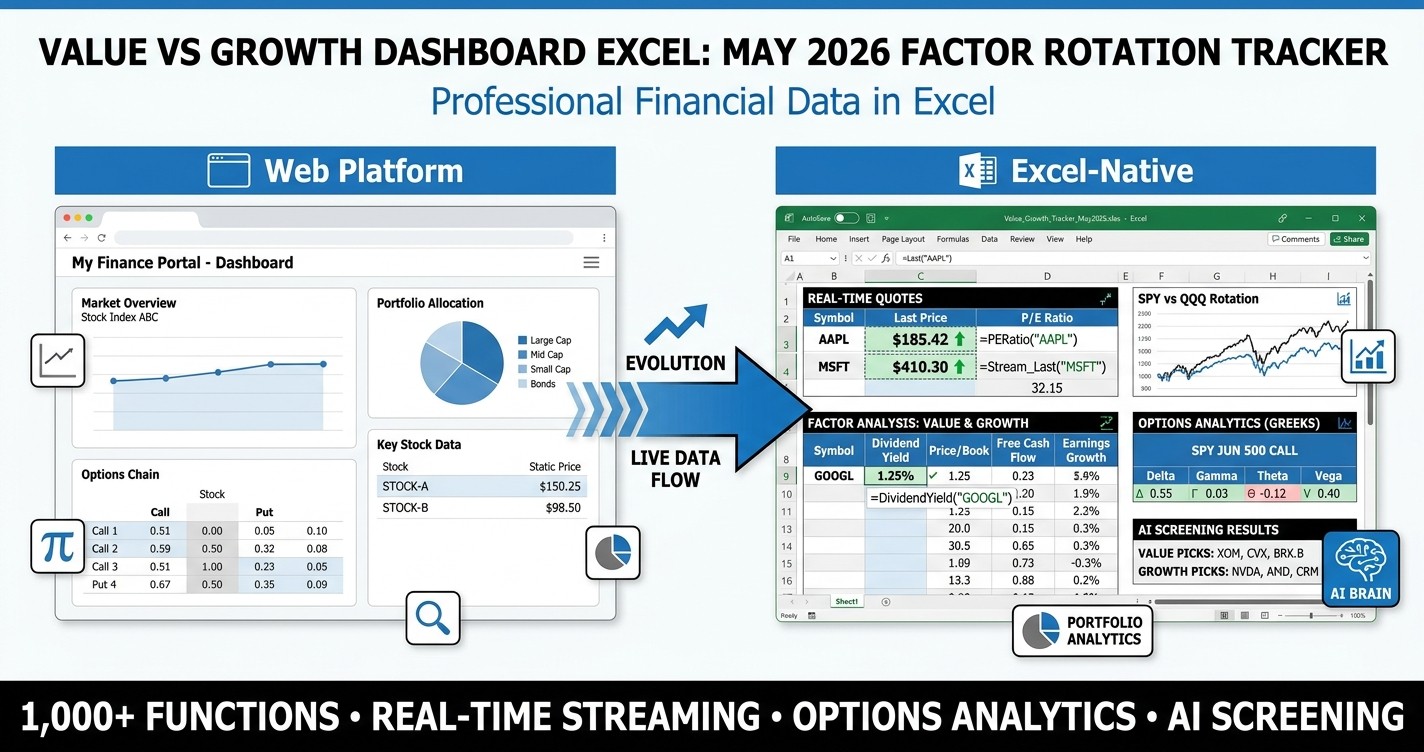
An Excel dashboard comparing 15 value and 15 growth mega-caps on P/E, price to book, yield, ROIC, and revenue growth, with scenario analysis across five macro regimes.
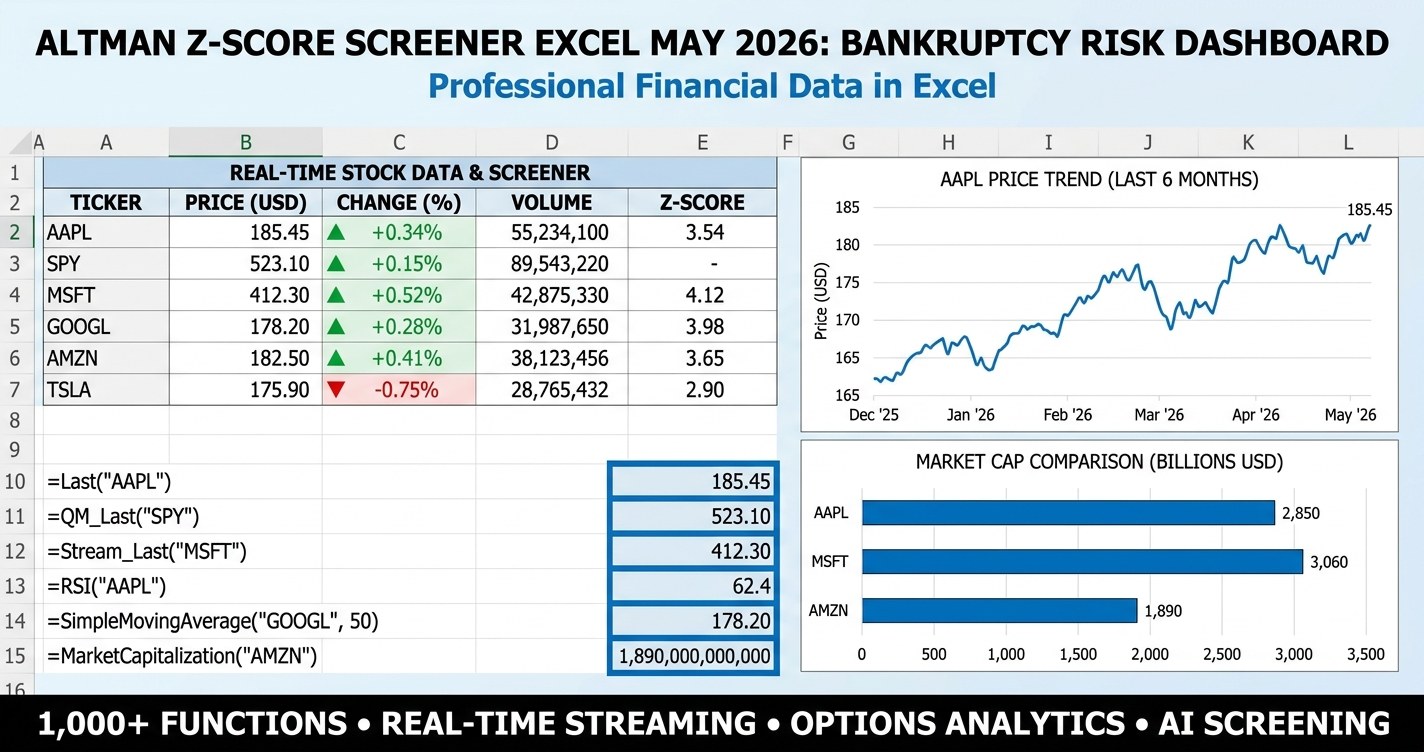
Build an Altman Z-Score screener in Excel: =AltmanZScore("AAPL") or the five ratios, Safe/Grey/Distress zones, recession stress tests, and a free template.

13F filings tracker excel - build a live Q1 2026 hedge fund holdings dashboard in Excel using MarketXLS formulas, with consensus picks and sector allocation.
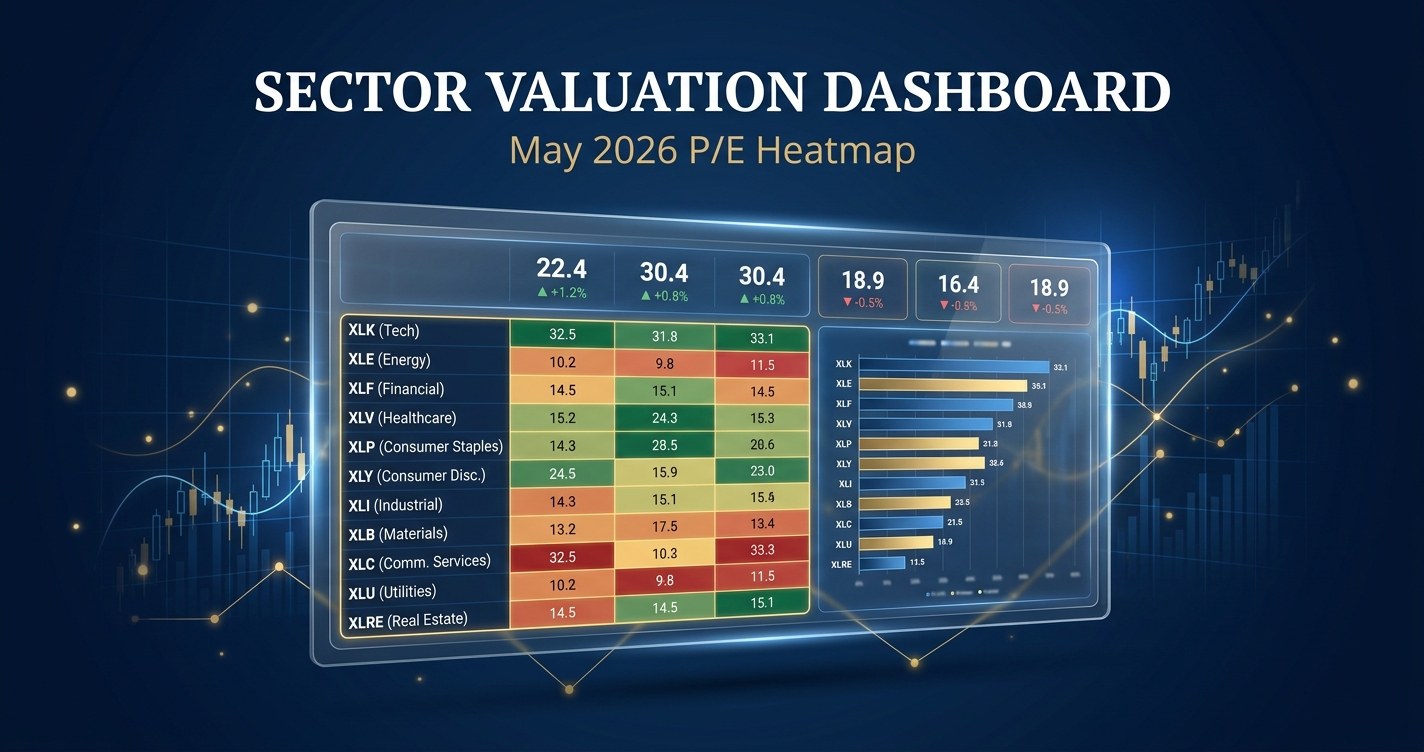
Sector valuation dashboard Excel template for May 2026 - dashboard-style heatmap of S&P 500 sector P/E ratios, premium-discount vs 5-year averages, KPI tiles, scenario analysis, and live MarketXLS formulas across all 11 GICS sectors.
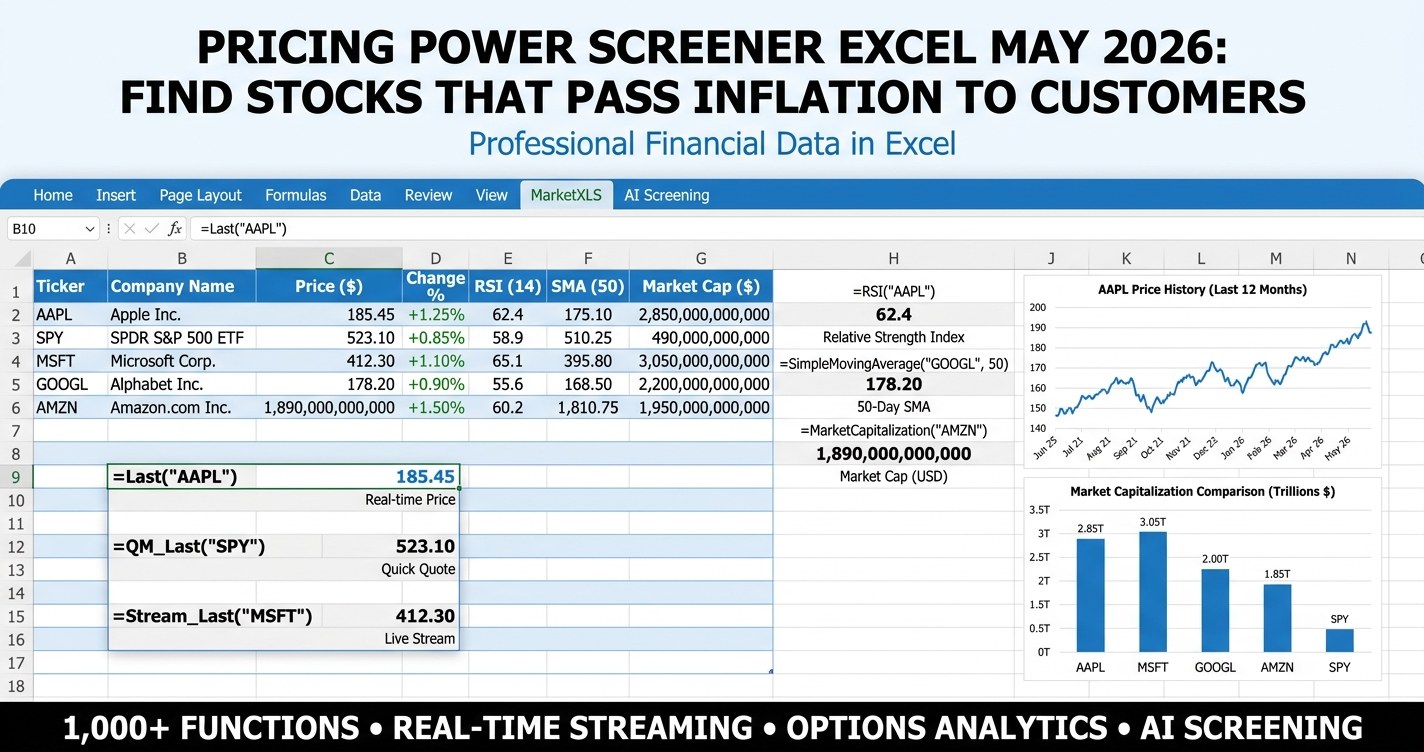
Pricing power screener Excel template that ranks 28 large-cap candidates on gross margin, operating margin, revenue growth, and ROE, with a composite Pricing Power Score for May 2026.
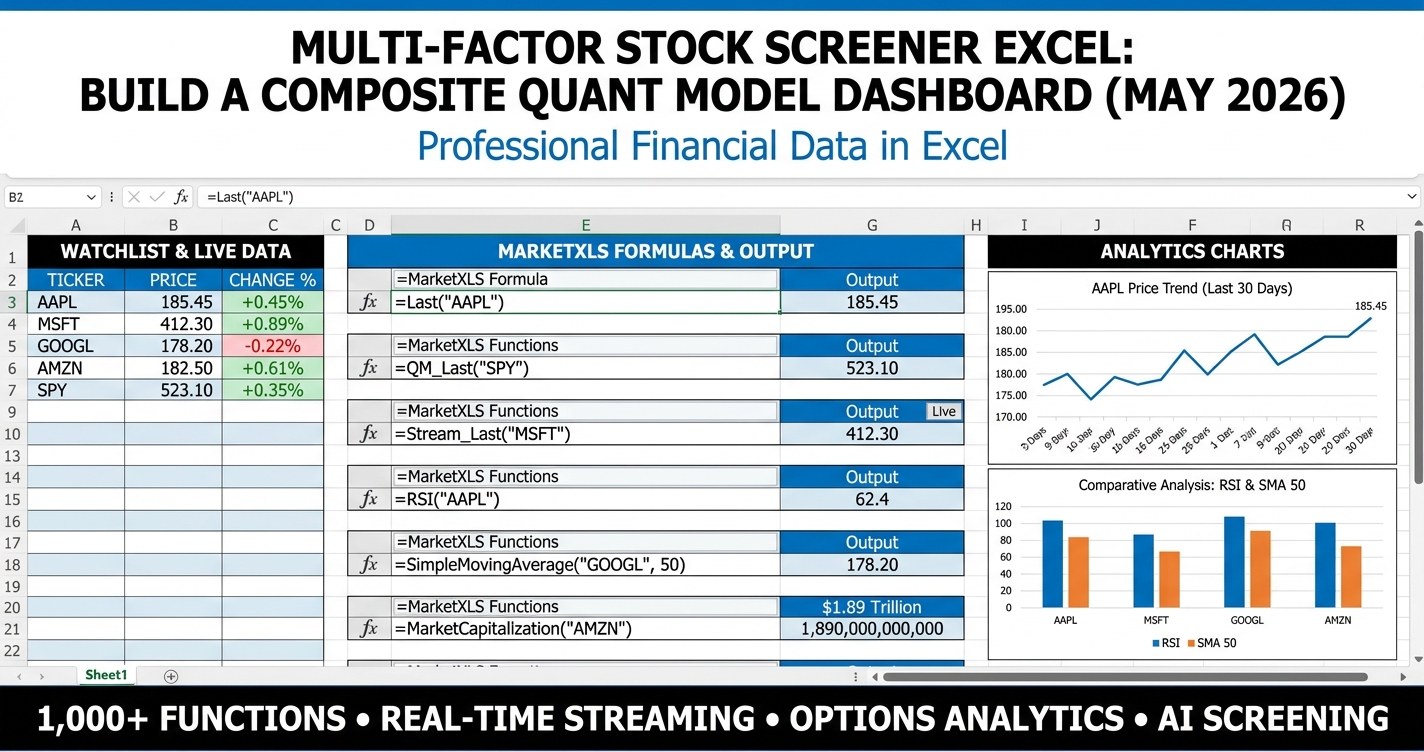
Multi-factor stock screener Excel template with composite scoring across value, quality, momentum, low volatility, and growth - dashboard-style with KPI tiles, charts, and live MarketXLS formulas.
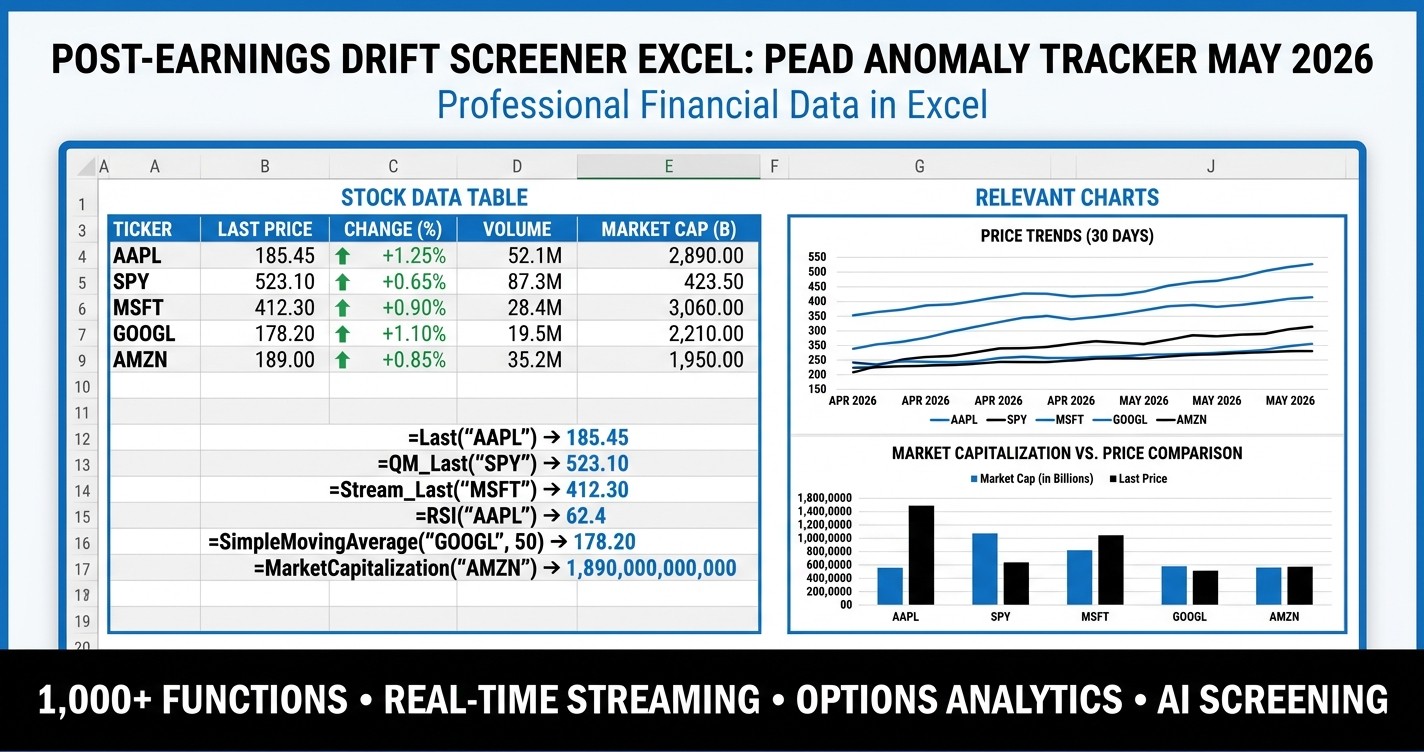
Post-earnings drift screener Excel template for the Q1 2026 reporting season. Rank S&P 500 names by EPS surprise size, confirm the drift with month-to-date returns and momentum filters, and size positions inside one MarketXLS workbook.
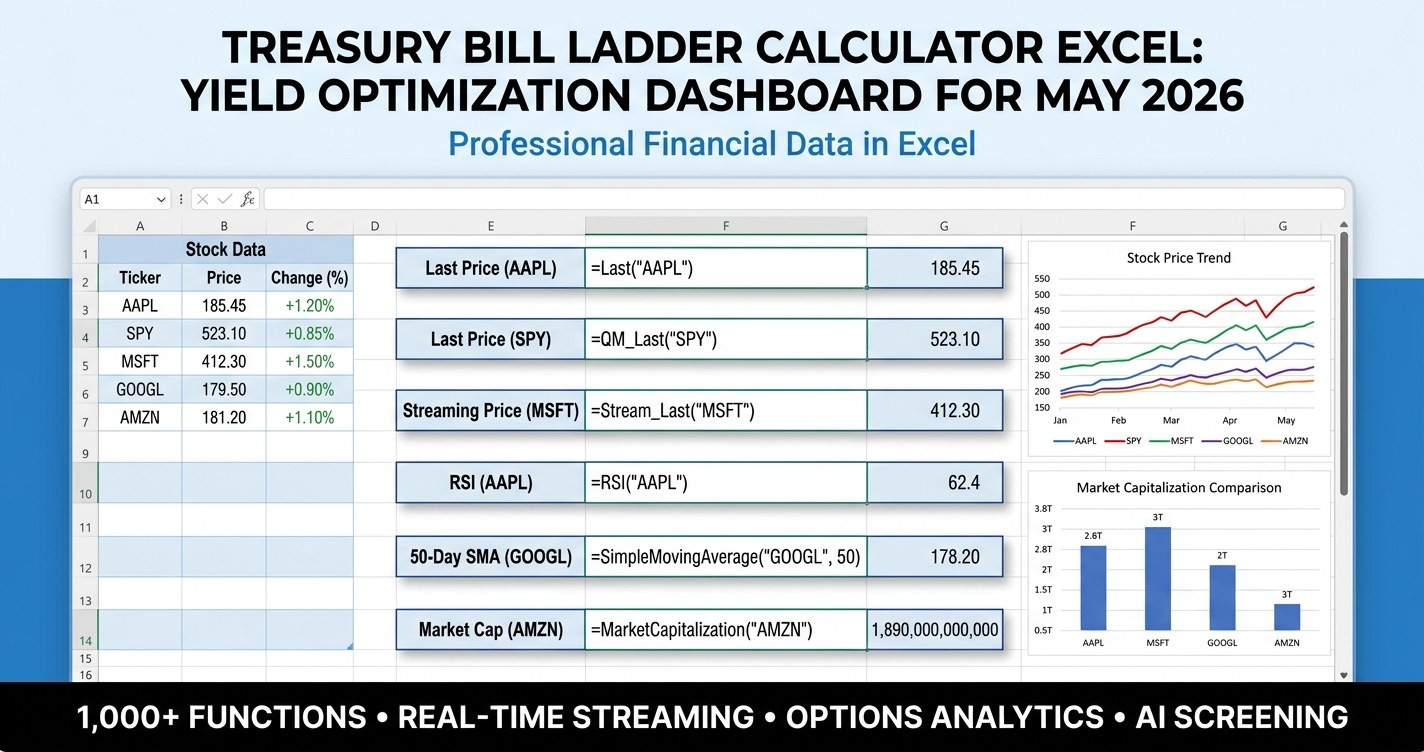
Treasury bill ladder calculator excel - an illustrative dashboard that models 12 Treasury rungs against the U.S. Treasury curve, shows scenario yields under Fed cuts and hikes, and compares the ladder to CDs, money market funds, savings, I-bonds, and corporate bonds.
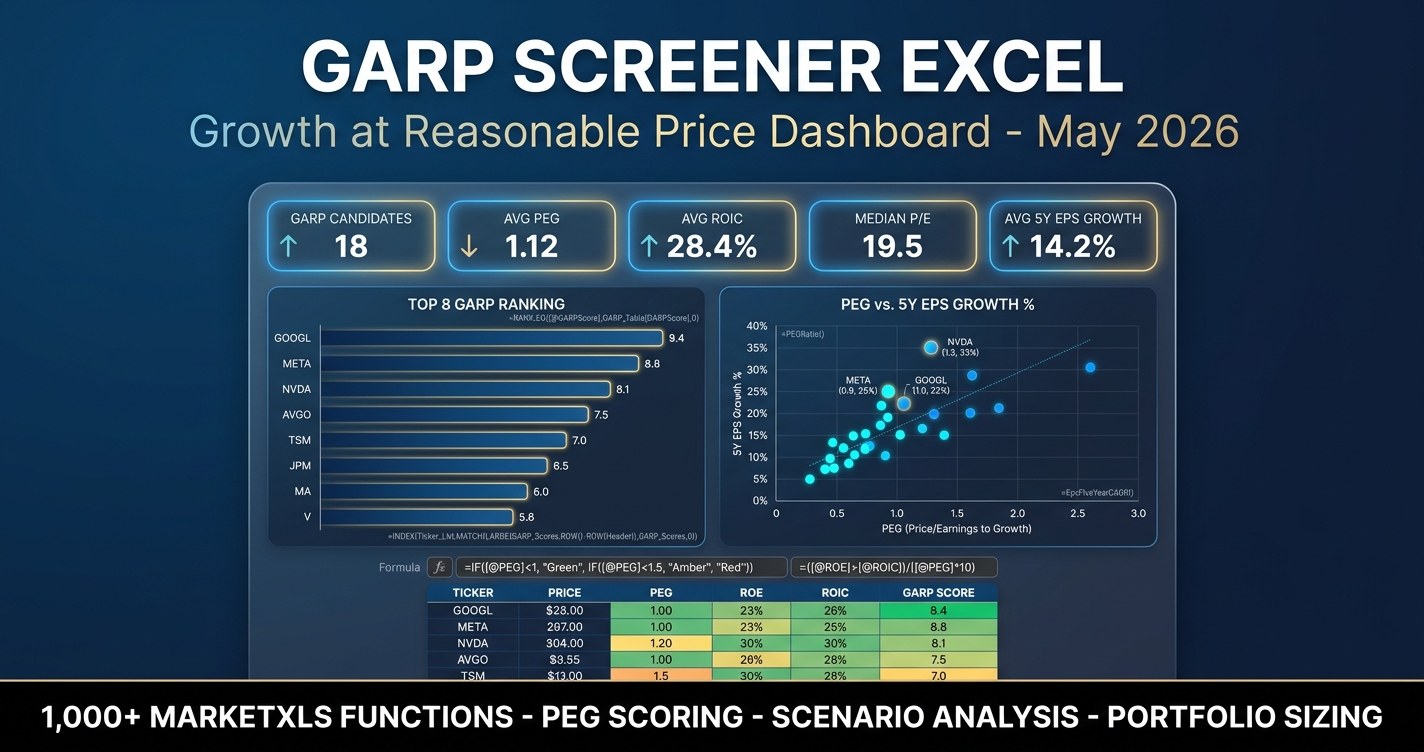
GARP screener excel - rank S&P 500 names by growth quality and valuation discipline using PEG, ROIC, and 5-year EPS growth in one premium Excel dashboard.
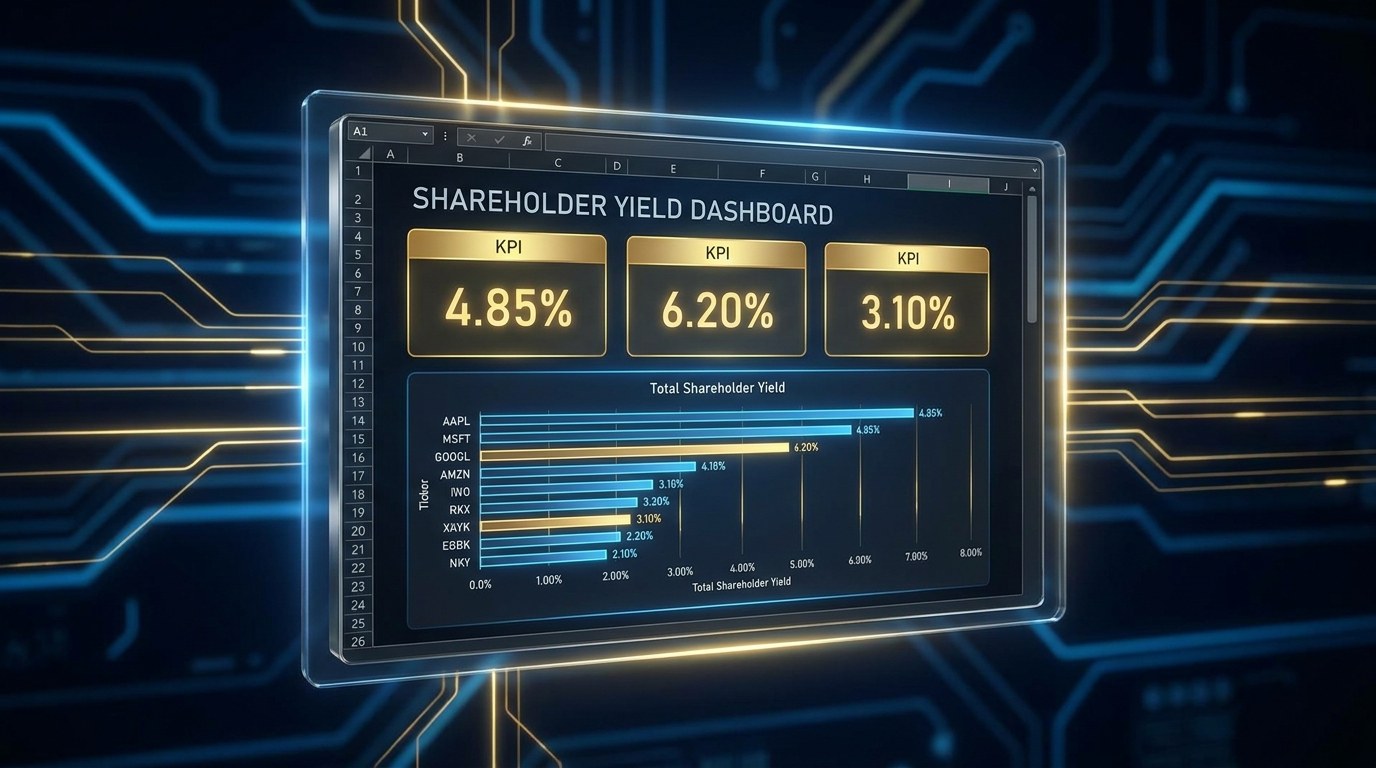
Shareholder yield dashboard excel - a premium-grade screener that combines dividend yield, net buyback yield, and net debt paydown yield into one composite for 27 large-cap S&P 500 names.
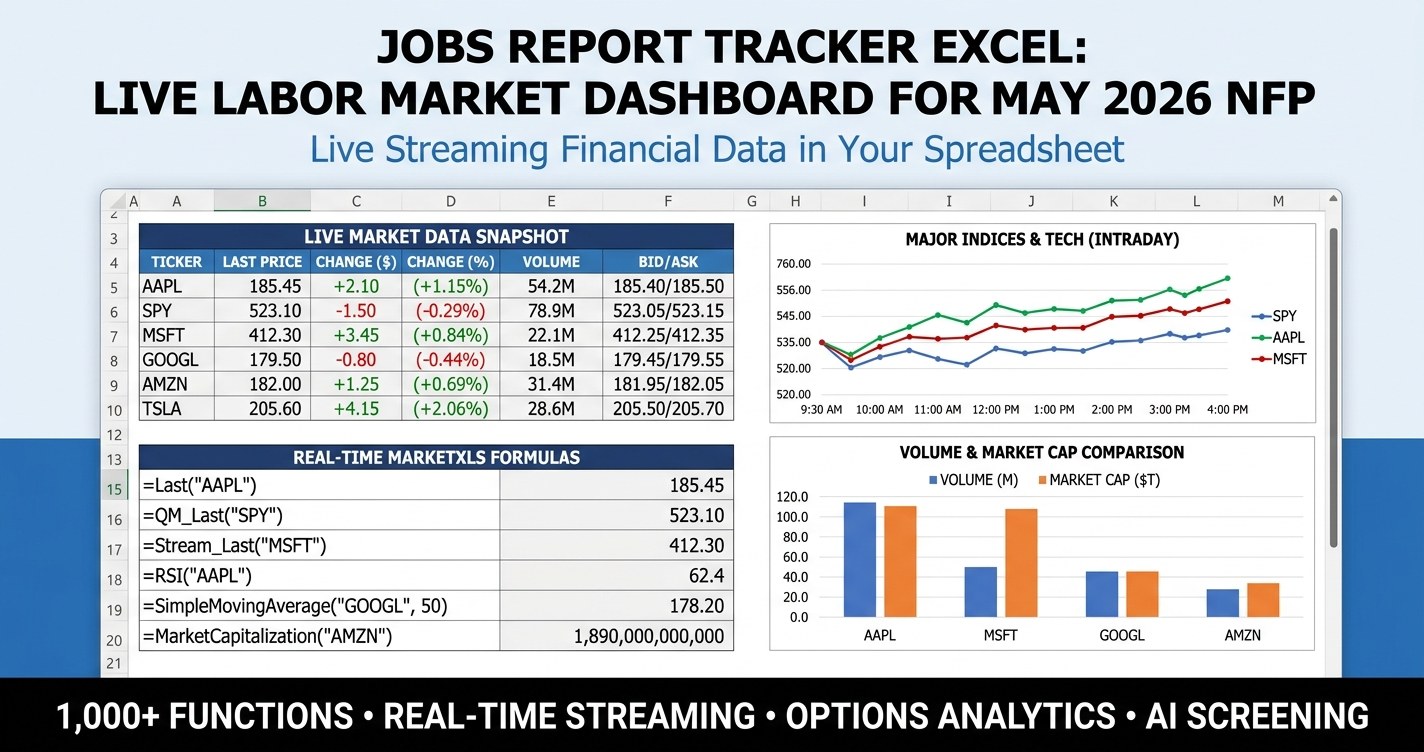
Jobs report tracker excel dashboard built with MarketXLS - track unemployment rate, NFP, JOLTS, initial claims, wages, and rate-curve reactions live for the May 2026 jobs print.
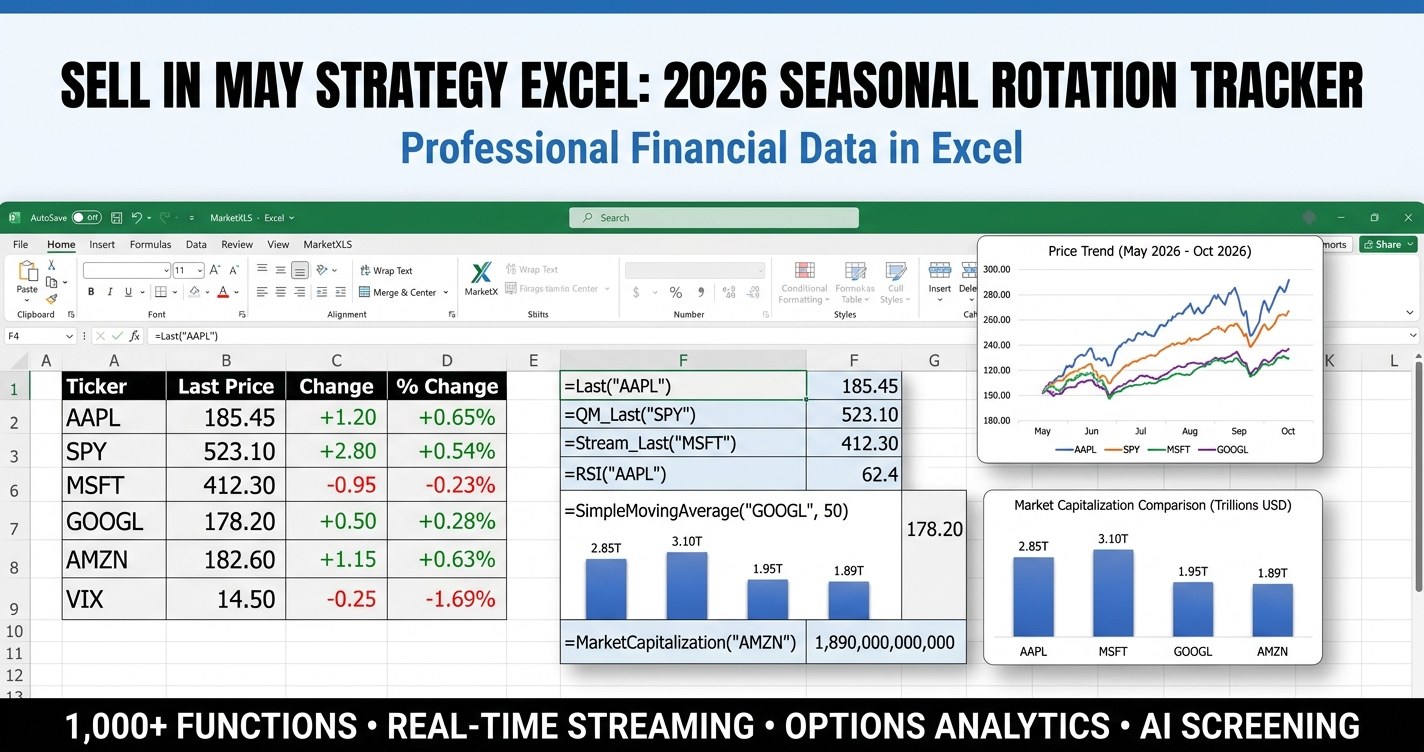
Sell in May strategy Excel template helps you compare a classic seasonal rotation against a defensive sleeve, hedges, and a stay-invested baseline using live MarketXLS formulas for May through October 2026.