
Investment Strategies
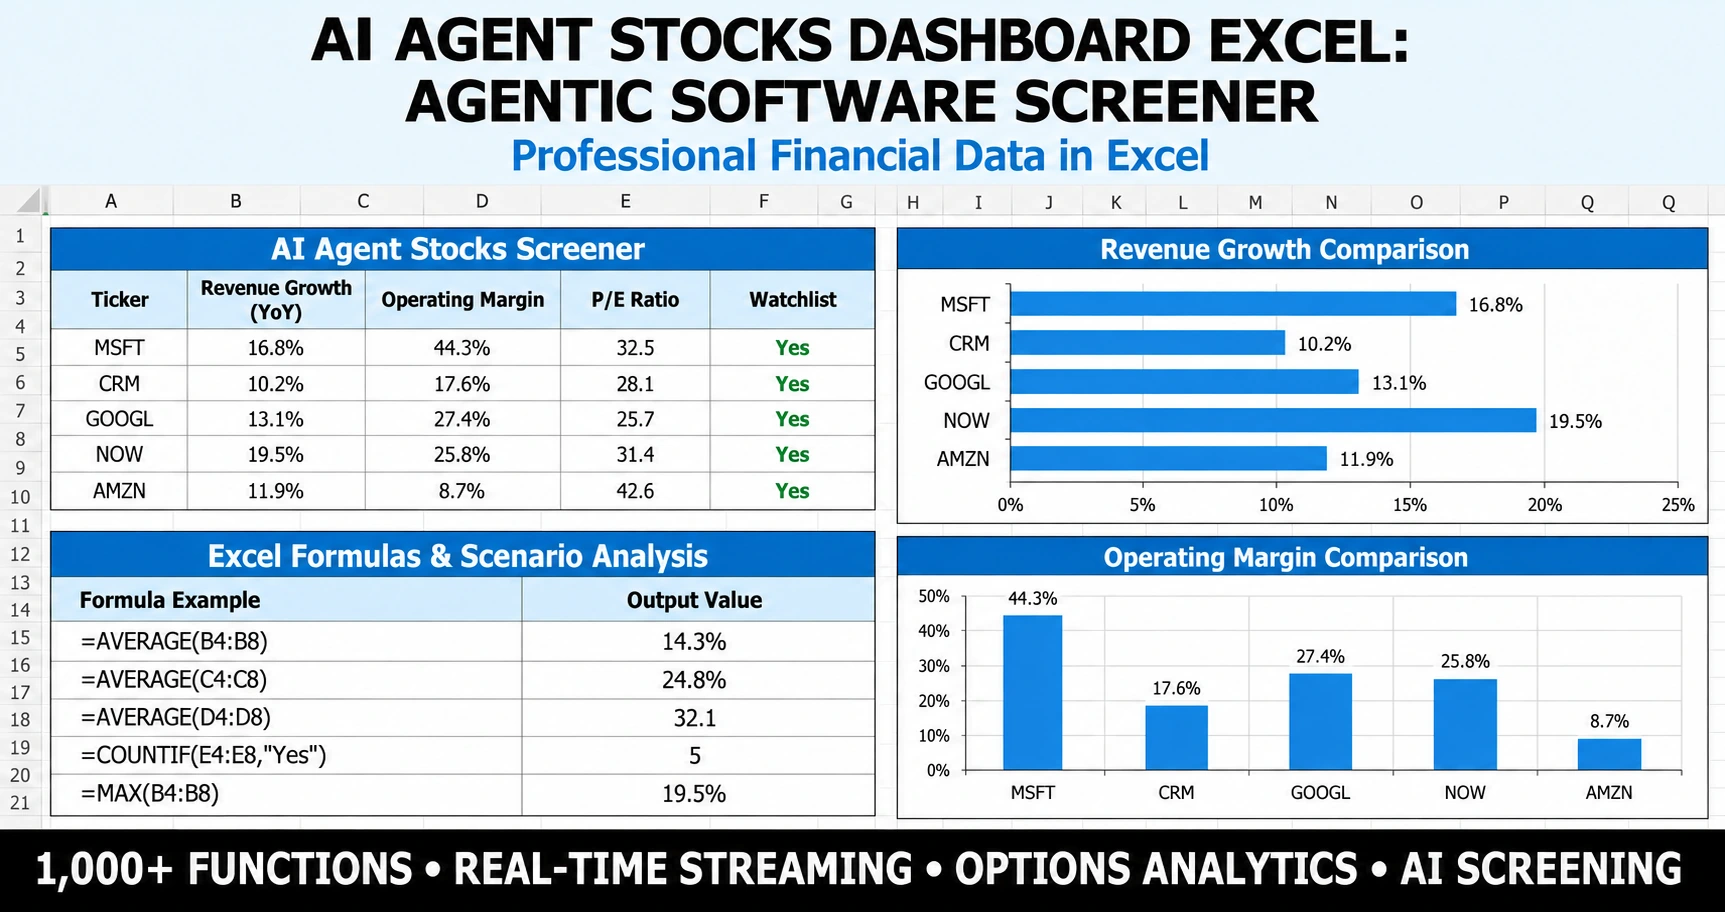
Free Excel dashboard that ranks 12 AI agent software stocks (CRM, NOW, PLTR, MSFT and more) on growth, valuation, margins, and an agentic AI score, with live MarketXLS formulas.
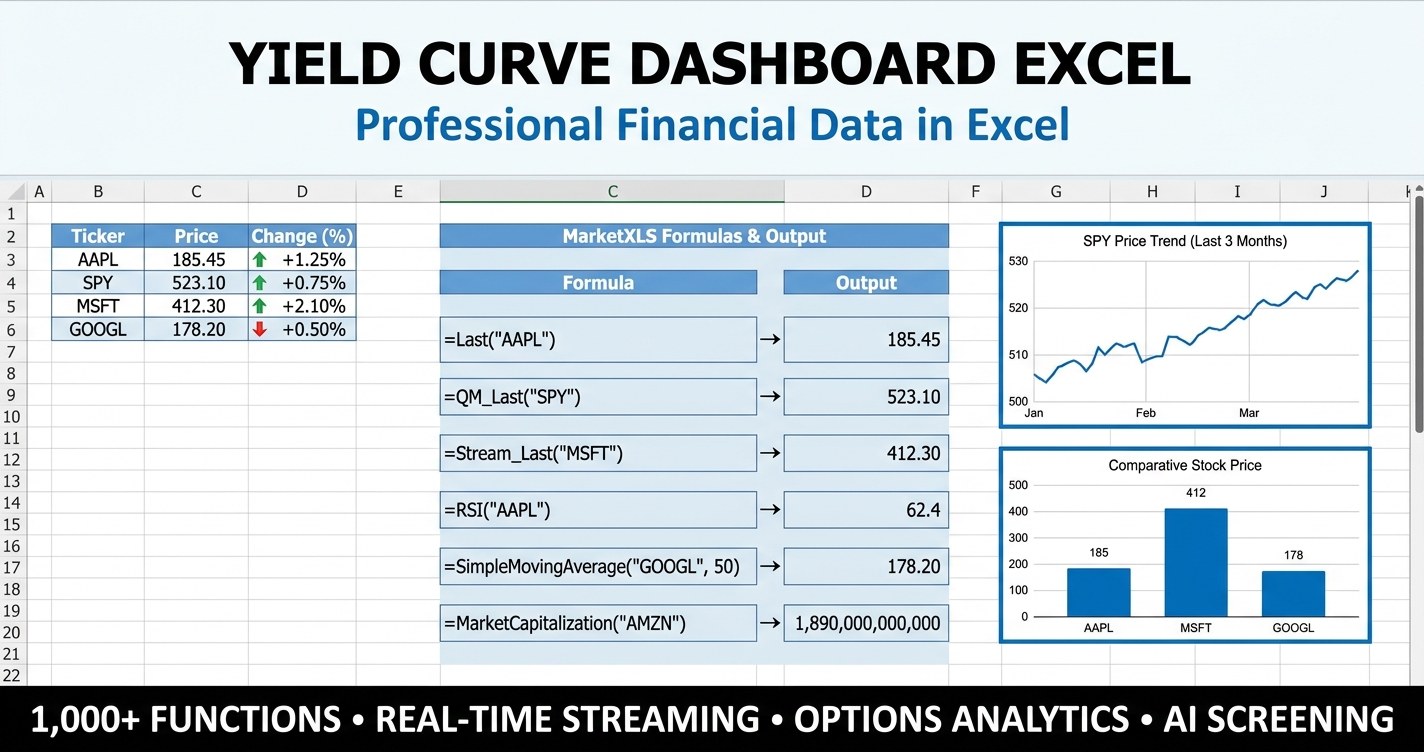
Free yield curve dashboard for Excel: Treasury yields 3M to 30Y, 10Y-3M and 10Y-2Y recession spreads, a bond ETF screener, and duration scenarios.
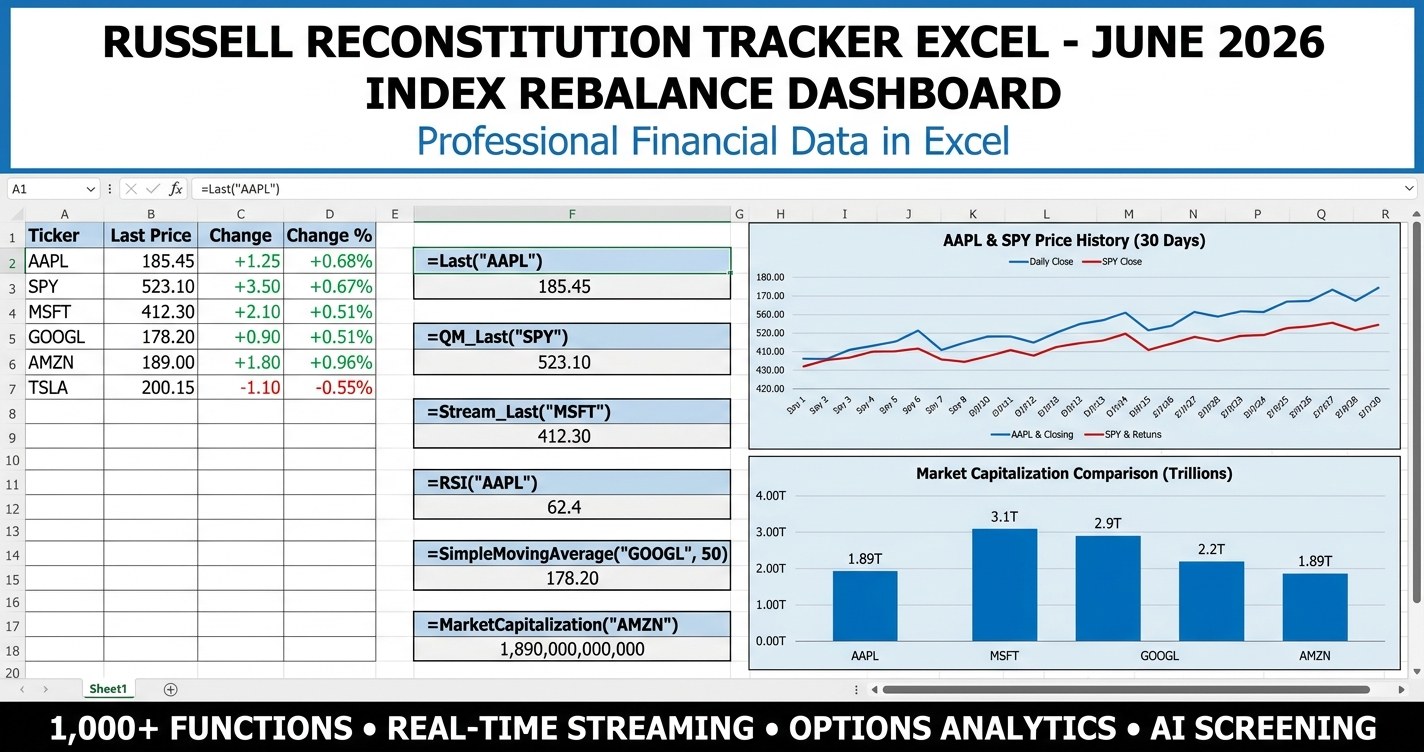
Russell reconstitution tracker Excel - a premium, dashboard-style template for the June 26, 2026 FTSE Russell rebalance with KPI tiles, migration analysis, conditional formatting, and live MarketXLS formulas.

Stock drawdown screener Excel - track distance from all-time high, 52-week high, and recovery percentage across 30 large-cap stocks with a premium June 2026 dashboard template.
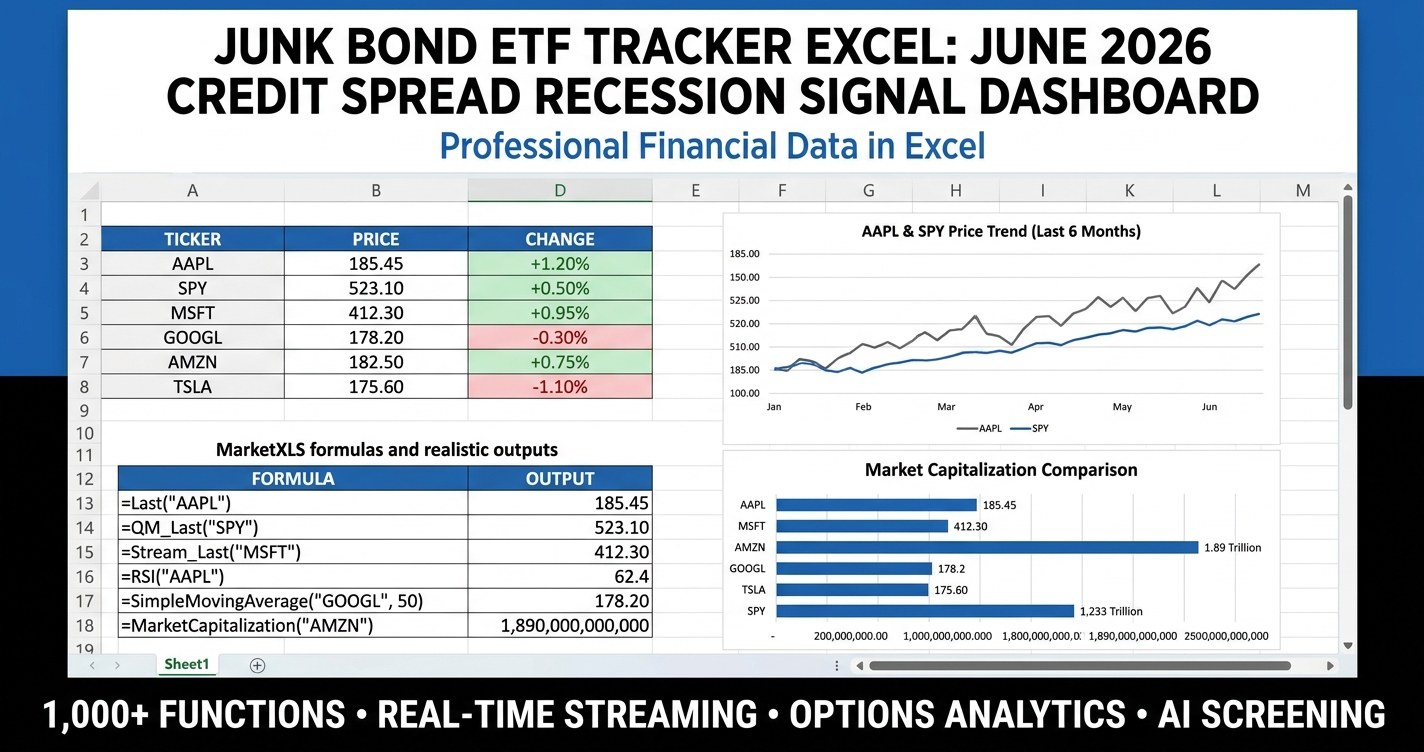
Junk Bond ETF Tracker Excel - track HYG, JNK, USHY, ANGL, and live BAA-Treasury credit spreads in one dashboard. Free template for advisors and self-directed investors monitoring high yield as a recession signal in June 2026.
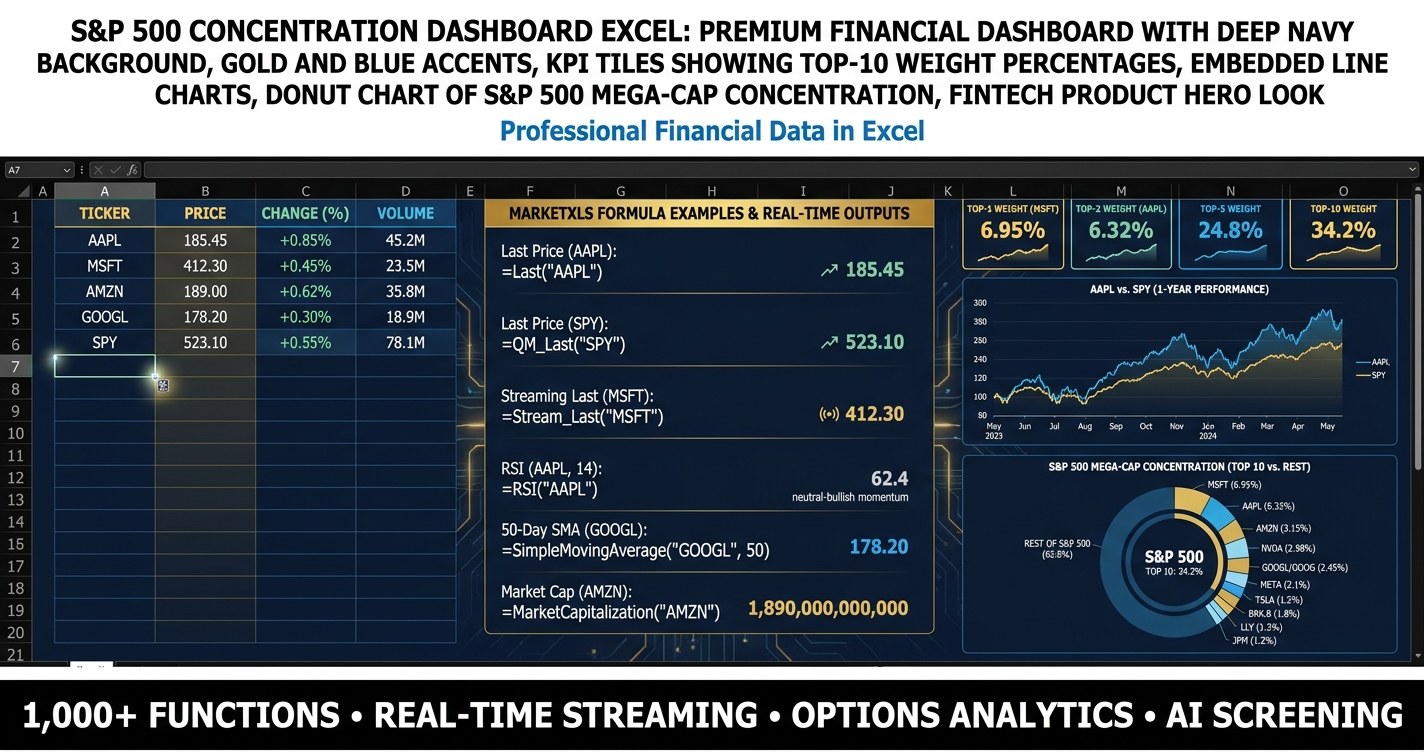
The S&P 500 top 10 weight is about 37.5% (June 2026). A free Excel dashboard to track top 10 weight, sector weights, HHI, and SPY vs RSP.
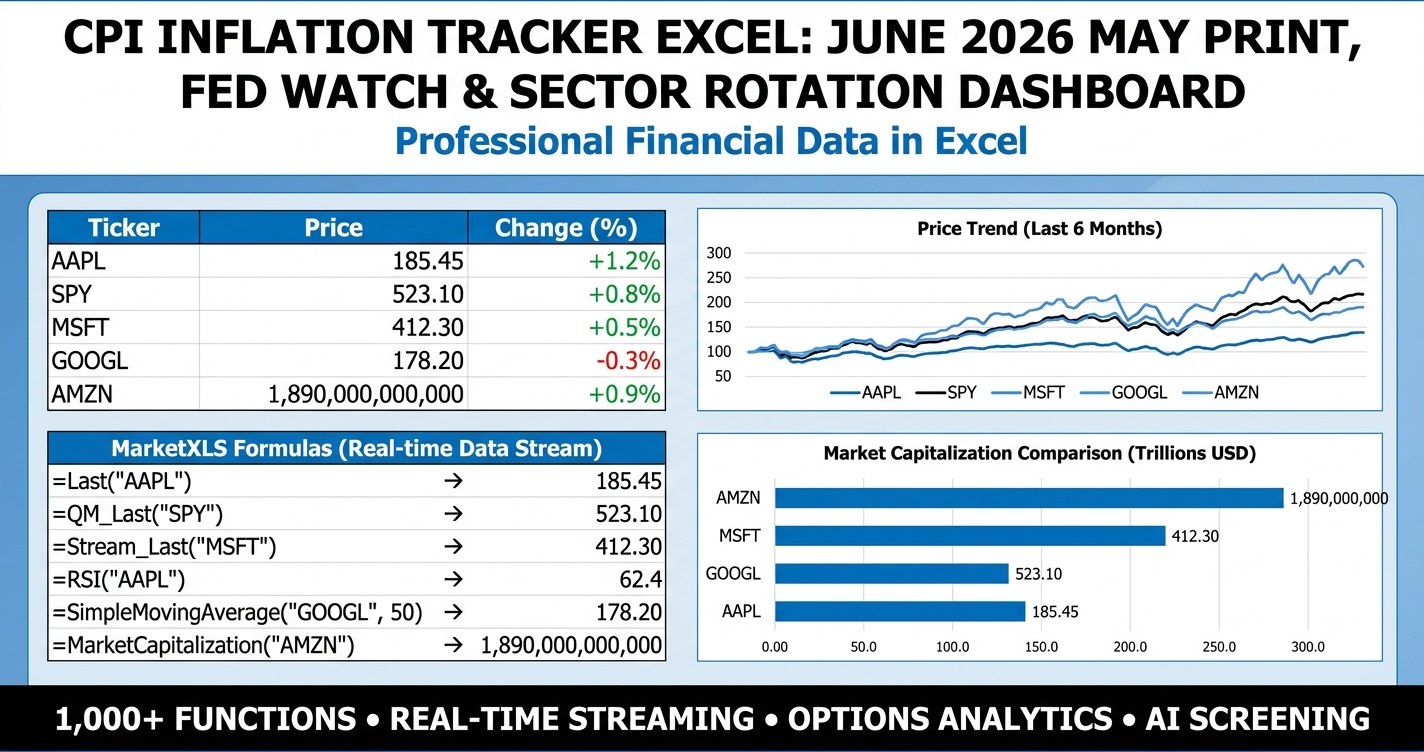
CPI inflation tracker Excel - map the May 2026 CPI release, Fed cut probability, TIPS breakevens, and sector reactions into one MarketXLS-powered workbook ahead of the June 17-18 FOMC meeting.

PEG Ratio Screener Excel for June 2026 - dashboard-style workbook with KPI tiles, conditional formatting, scenario analysis, and a live MarketXLS template that screens 25 mega-cap stocks for Growth-At-Reasonable-Price setups.
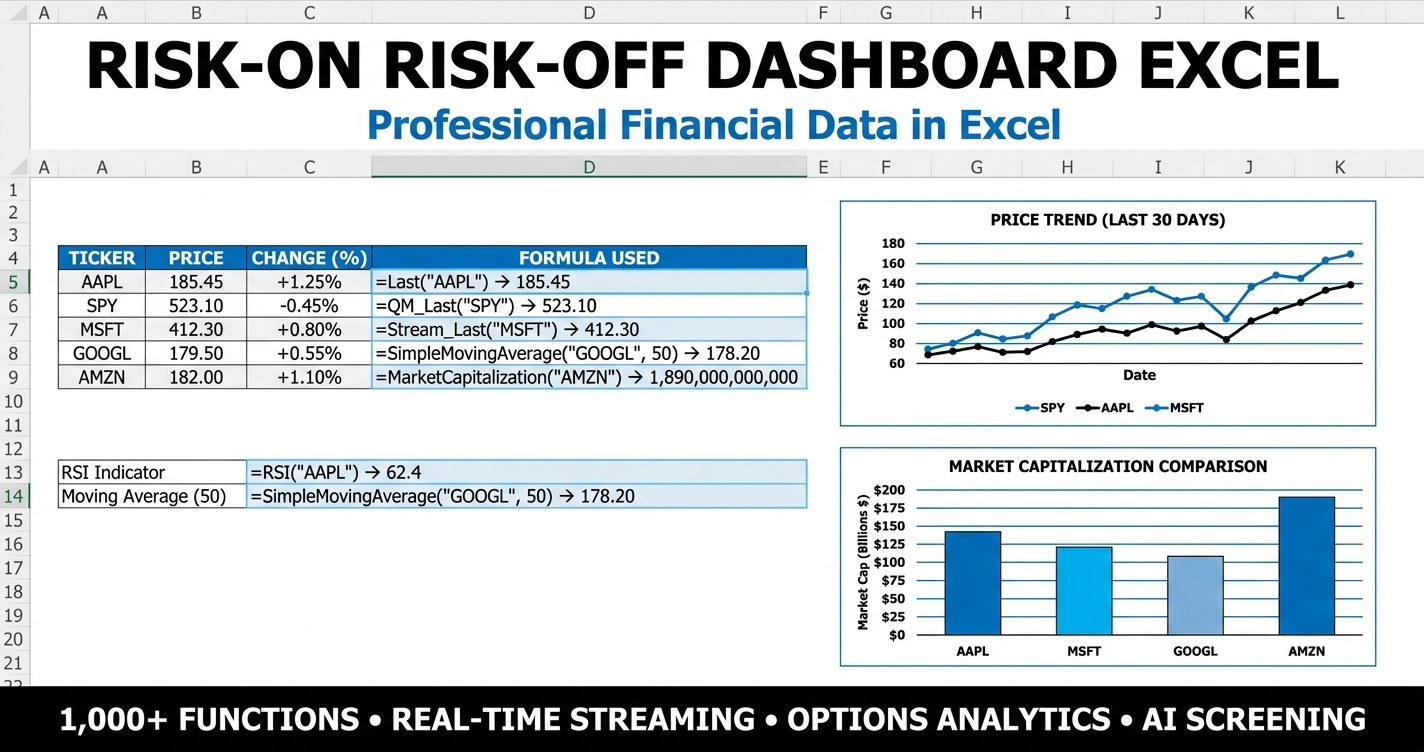
Risk-On Risk-Off Dashboard Excel - track 8 intermarket ratios, score the market regime, and rotate cyclical vs defensive sleeves with a premium June 2026 template powered by live MarketXLS formulas.

A free Excel screener that scores 27 Russell Midcap stocks on ROE, ROIC, free cash flow margin, and leverage, with seven preset quality screens and three weighting methods.
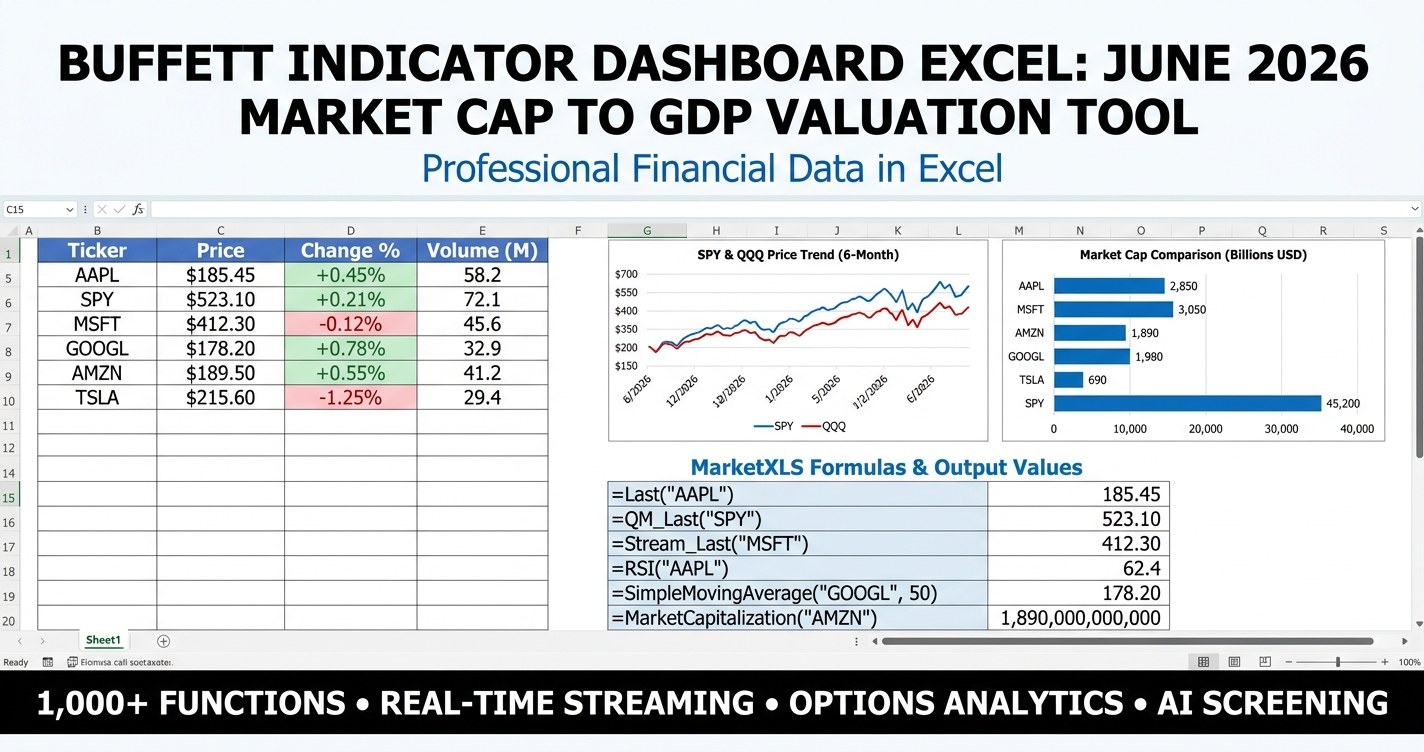
The Buffett Indicator (US market cap / GDP) was about 200% in June 2026. An Excel dashboard to calculate it, chart 30 years of history, and run 10-year reversion scenarios.
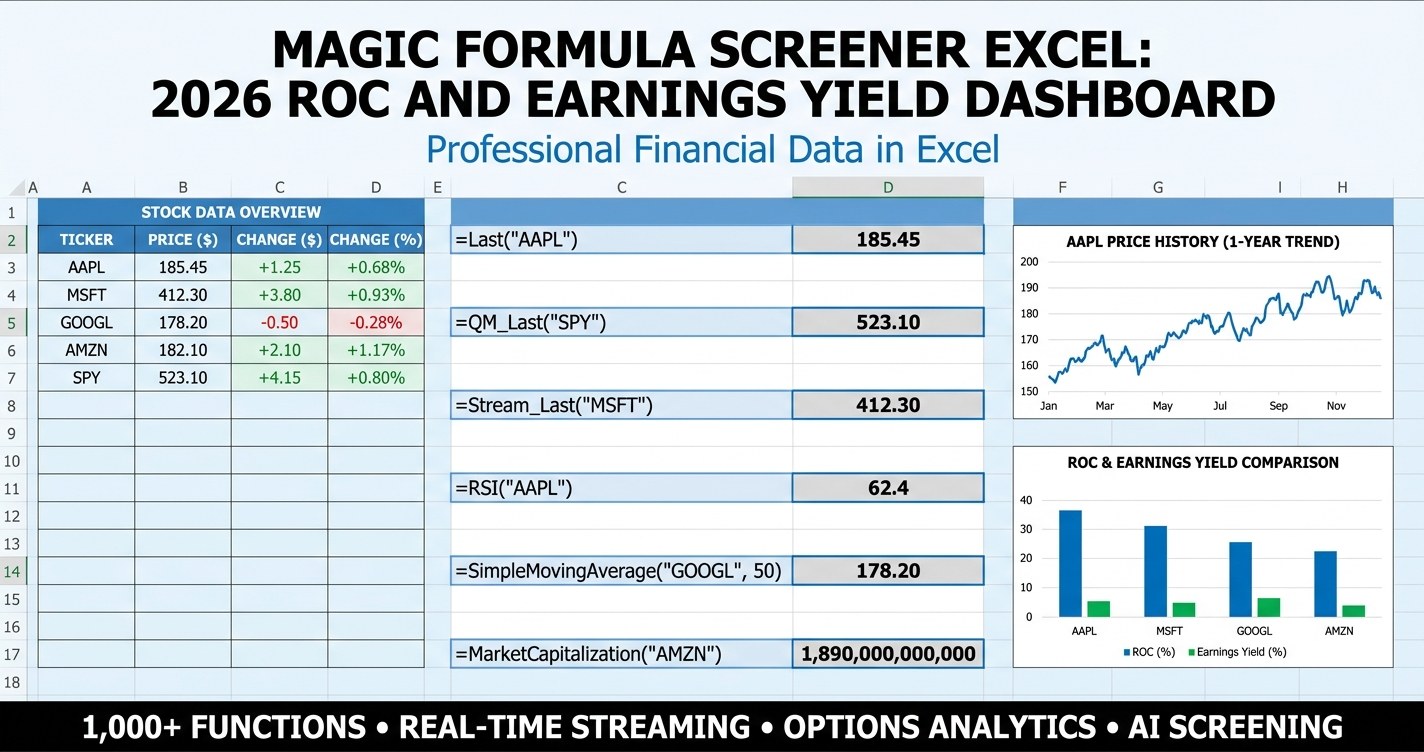
An Excel template that ranks a 30-stock universe on Greenblatt's Return on Capital and Earnings Yield, with a top-10 watchlist, four blend modes, and MarketXLS formulas.
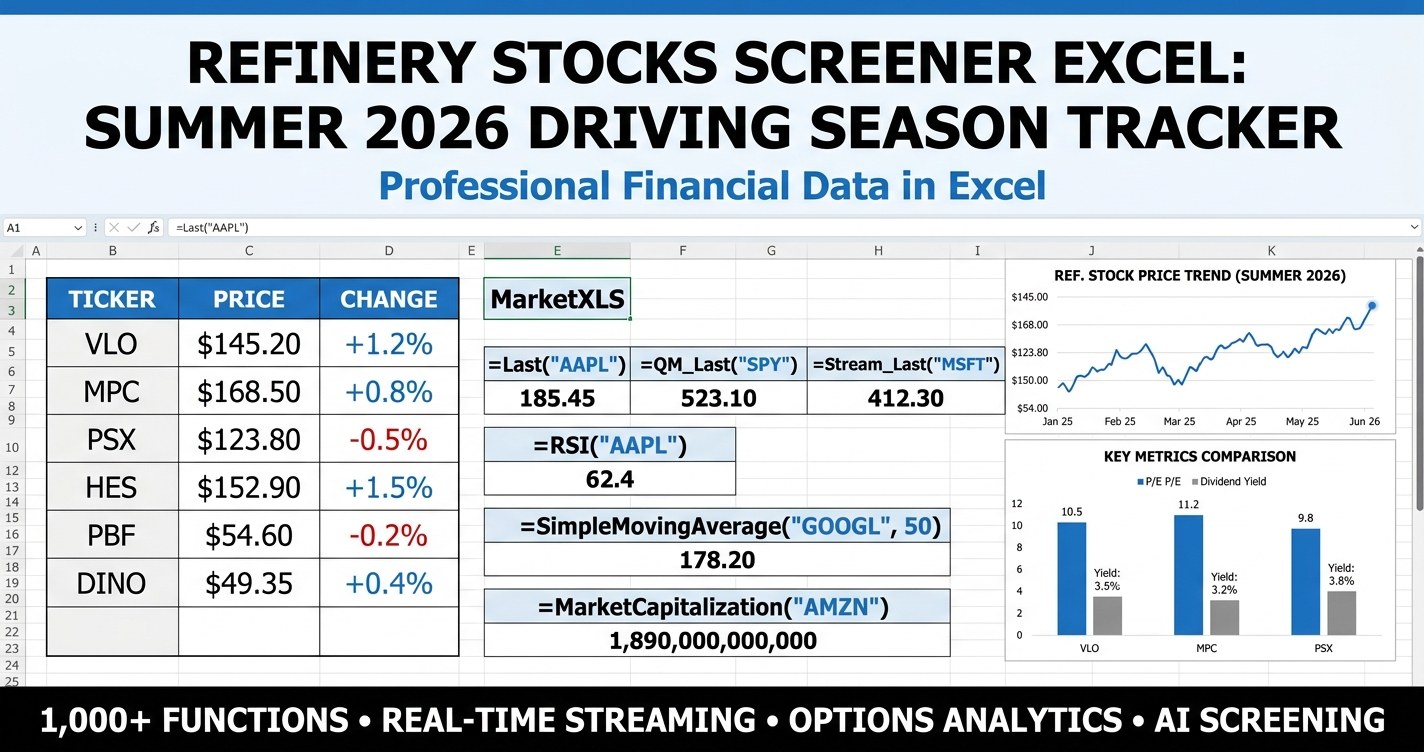
Refinery stocks screener in Excel: track the 8 US refiners (VLO, MPC, PSX, DINO, DK, PBF, CVI, PARR) through summer 2026 driving season with a crack spread sensitivity model, dividend calendar, and live MarketXLS formulas.
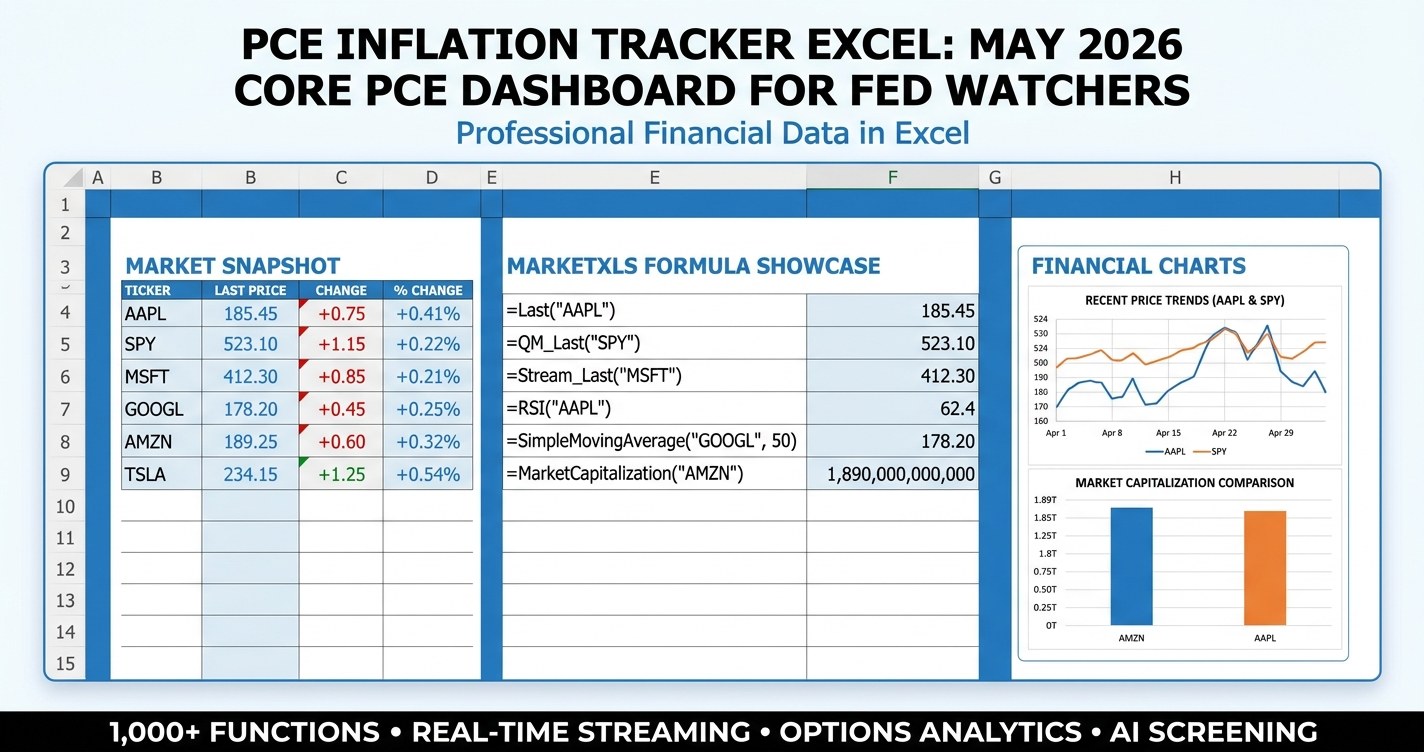
PCE inflation tracker Excel - map the Fed's preferred inflation gauge, super-core trend, and inflation-hedge sectors into one MarketXLS-powered workbook ahead of the May 30, 2026 release.

A free six-sheet Excel FOMC tracker: index and sector ETF dashboard, six rate-decision scenarios, a sector heatmap, a rate-beneficiary watchlist, and a yield-curve sheet.
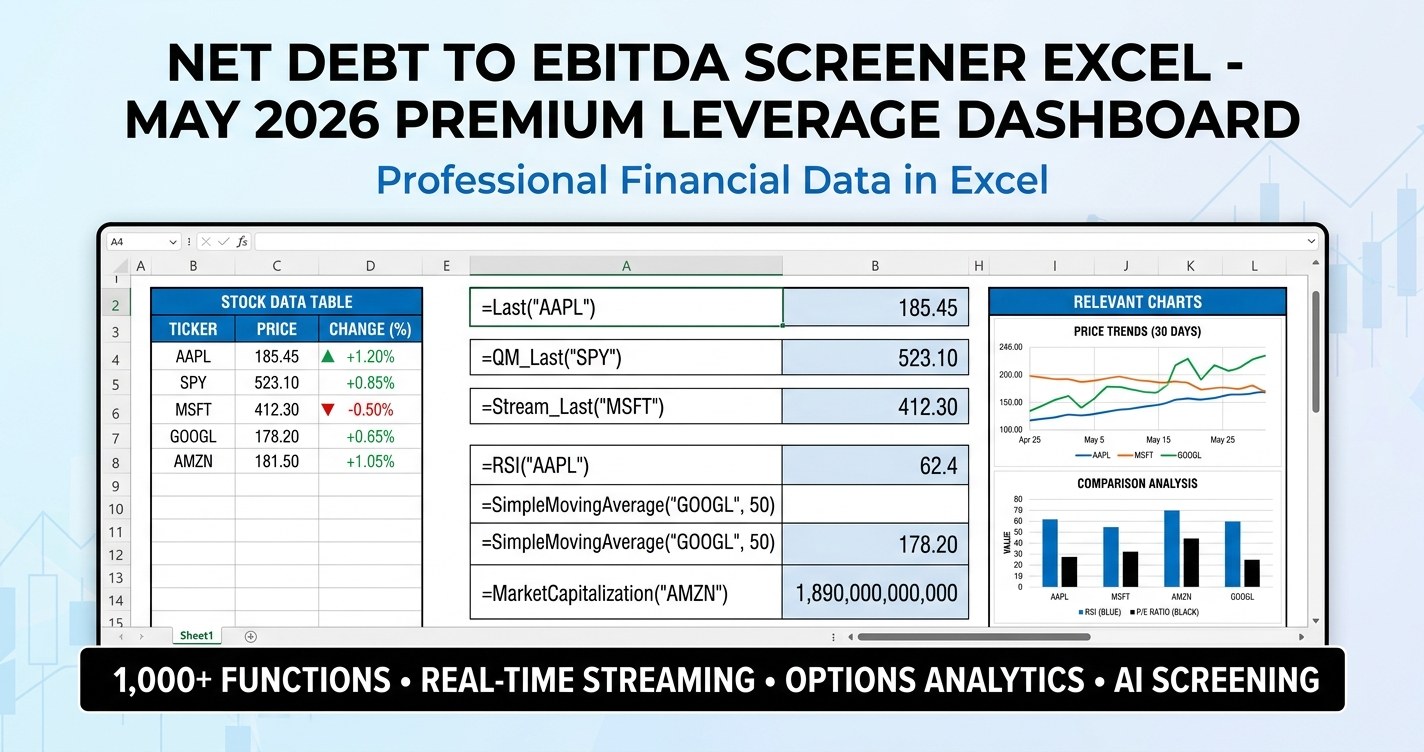
Net Debt to EBITDA screener Excel for May 2026 - a dashboard-style premium template that ranks 25 large-cap names by leverage, applies stress scenarios, and rolls leverage up by sector with live MarketXLS formulas.