MarketXLS Charts – Candlestick Charts
Create professional candlestick charts with OHLC data and volume for technical analysis.
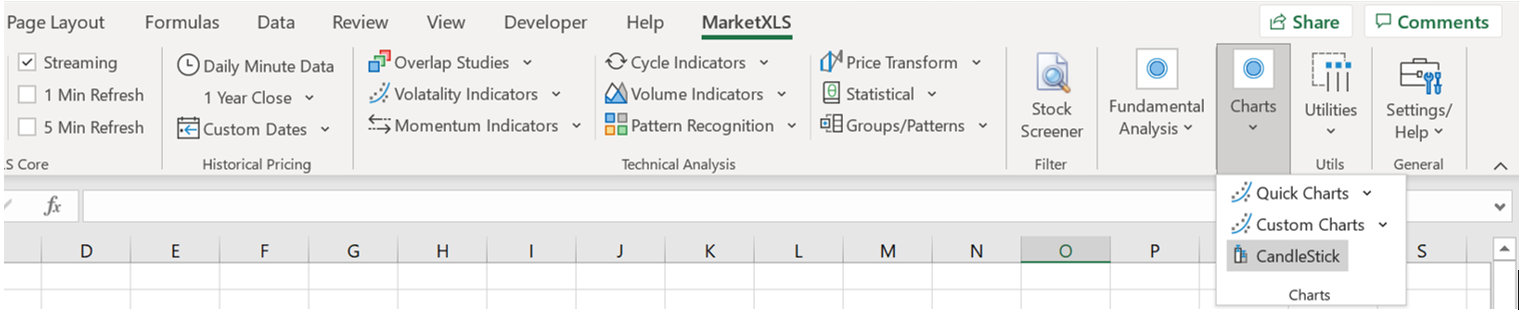
To create a candlestick chart click on the candlestick chart button on the menu and provide OHLC and Volume Data.
MarketXLS Candlestick Charts Tutorial
Advanced Features
You can also right-click on the chart to add any number series and annotate patterns on the candlestick charts. It's pretty self-explanatory overall and MarketXLS will prompt you to select series with annotations and patterns.
Pattern Series
Chart Capabilities
OHLC Data Visualization
Display Open, High, Low, Close prices in traditional candlestick format for easy technical analysis.
Volume Integration
Include volume data alongside price information for comprehensive market analysis.
Pattern Annotations
Add technical pattern indicators (100 for bullish, -100 for bearish) to highlight chart patterns.
Additional Series
Right-click to add moving averages, indicators, or other data series to your candlestick chart.
Full Screen Mode
Maximize charts to full screen with automatic date and scale adjustments.
Example Chart
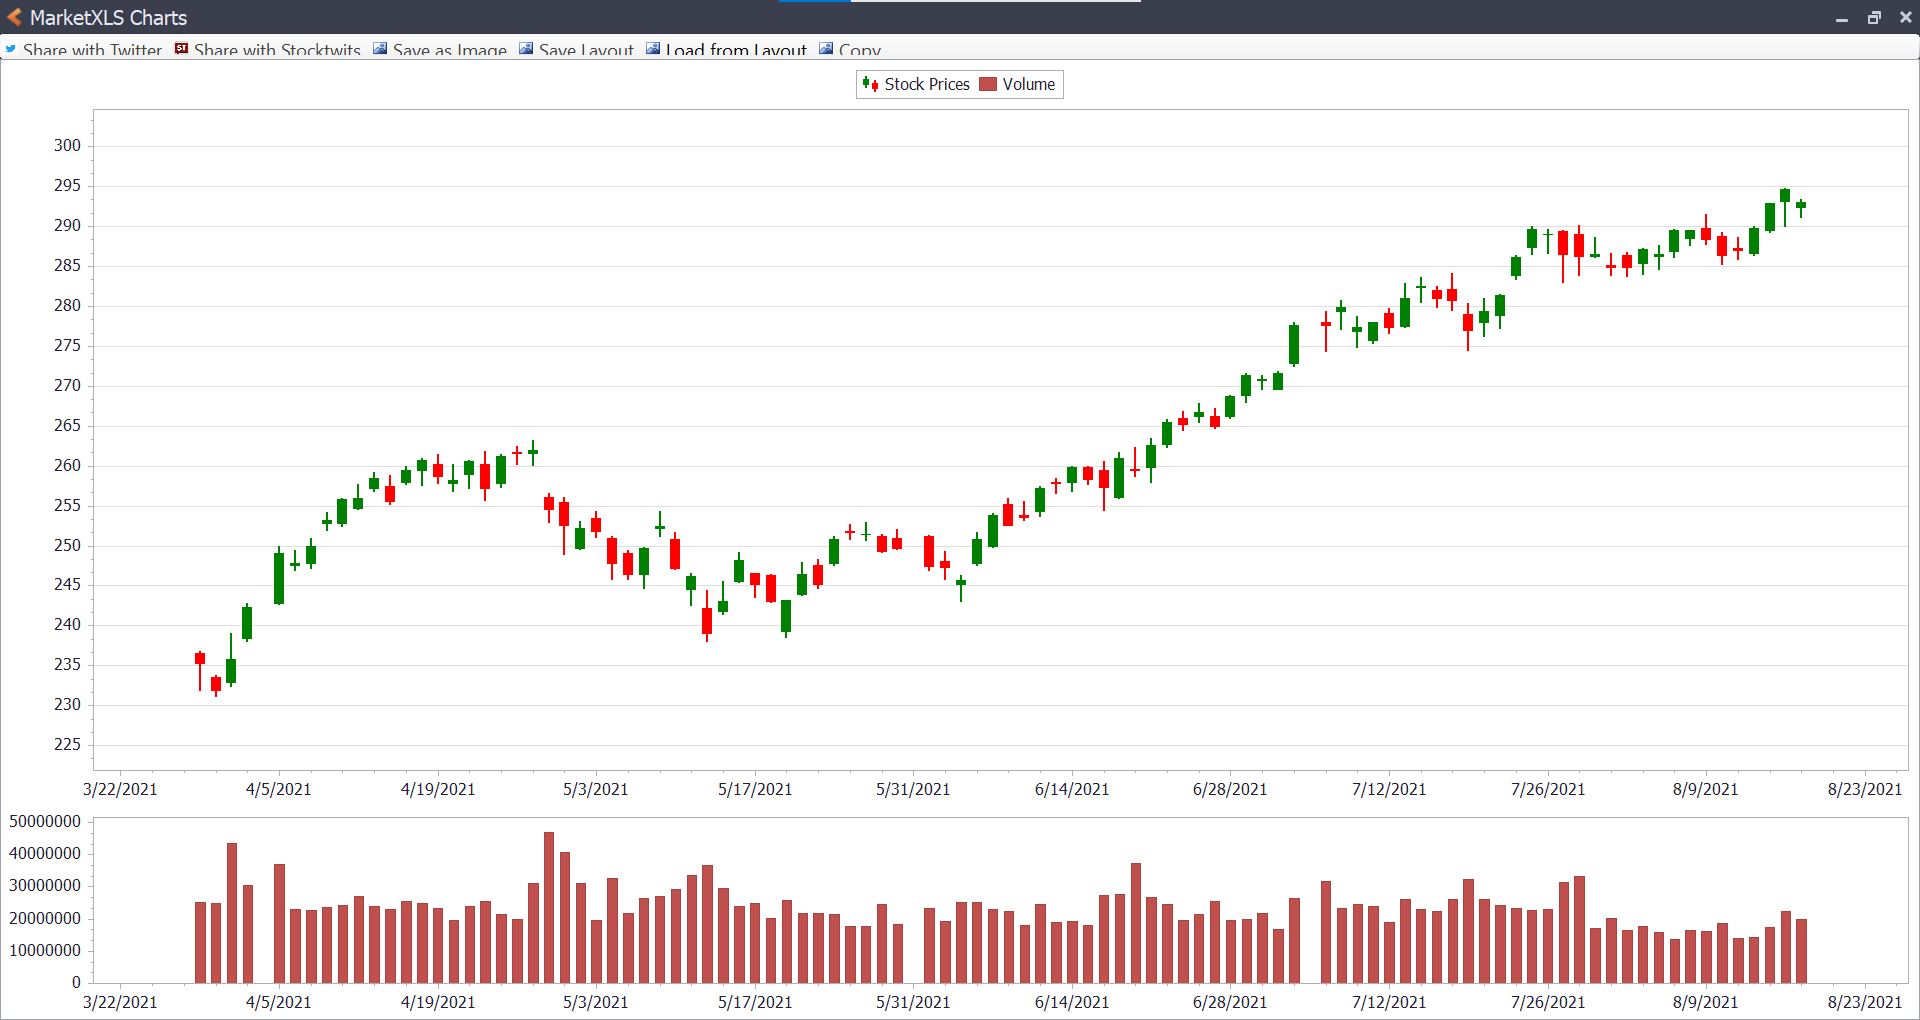
Professional Technical Analysis
Key Benefits
- Easy Creation: One-click chart generation from OHLC data
- Interactive: Right-click menus for adding series and annotations
- Pattern Support: Binary pattern indicators for technical signals
- Flexible Display: Automatic scaling and full-screen mode
- Volume Integration: Include volume bars for complete analysis