Quick Stock and Currency Charts in Excel with MarketXLS
Create stunning, interactive charts for stock and currency data with just a few clicks.
MarketXLS allows you to build stunning, interactive charts for stock and currency data. For ease of use, we've categorized the charts as quick charts and custom charts. In this article, we will look at how to make use of the quick stock and currency charts in excel.
The quick charts allow you to create interactive charts in excel by just knowing the symbol of the stock or the currency. Let's learn how to create a quick chart in excel using MarketXLS:
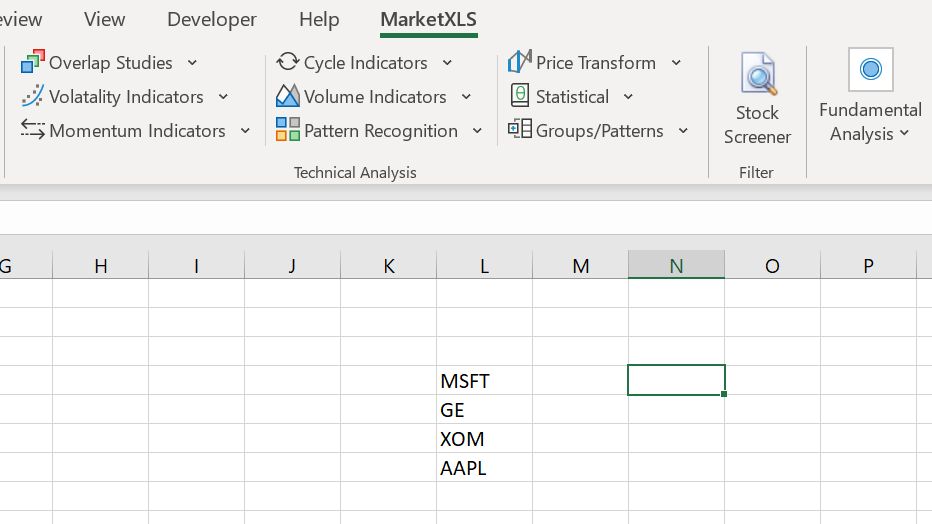
Select your Stocks
Let's say you want to plot the chart for these four stocks: MSFT, GE, XOM, and YHOO. The first thing you need to do is enter these stock symbols in an excel column, as shown below:
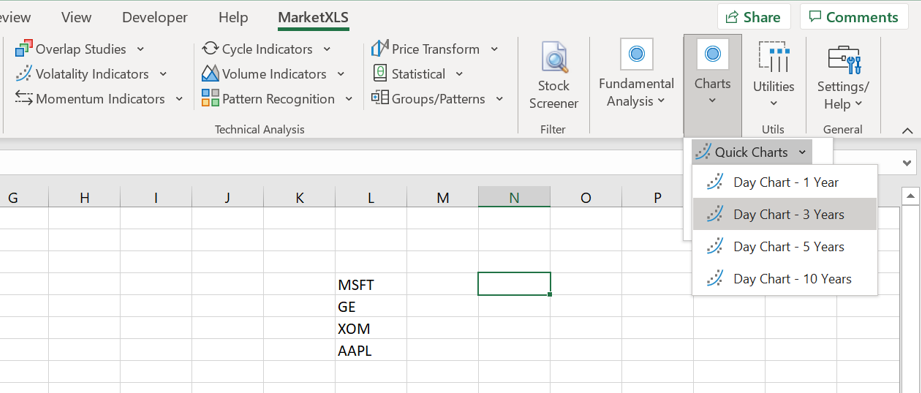
Select the Chart Type
To plot the charts, select all the cells for which you want to plot the stock data, and then select the appropriate chart type from MarketXLS > Charts > Quick Charts. You can select from the minute chart, a choice of day charts, price comparison chart, and quick candlestick chart.
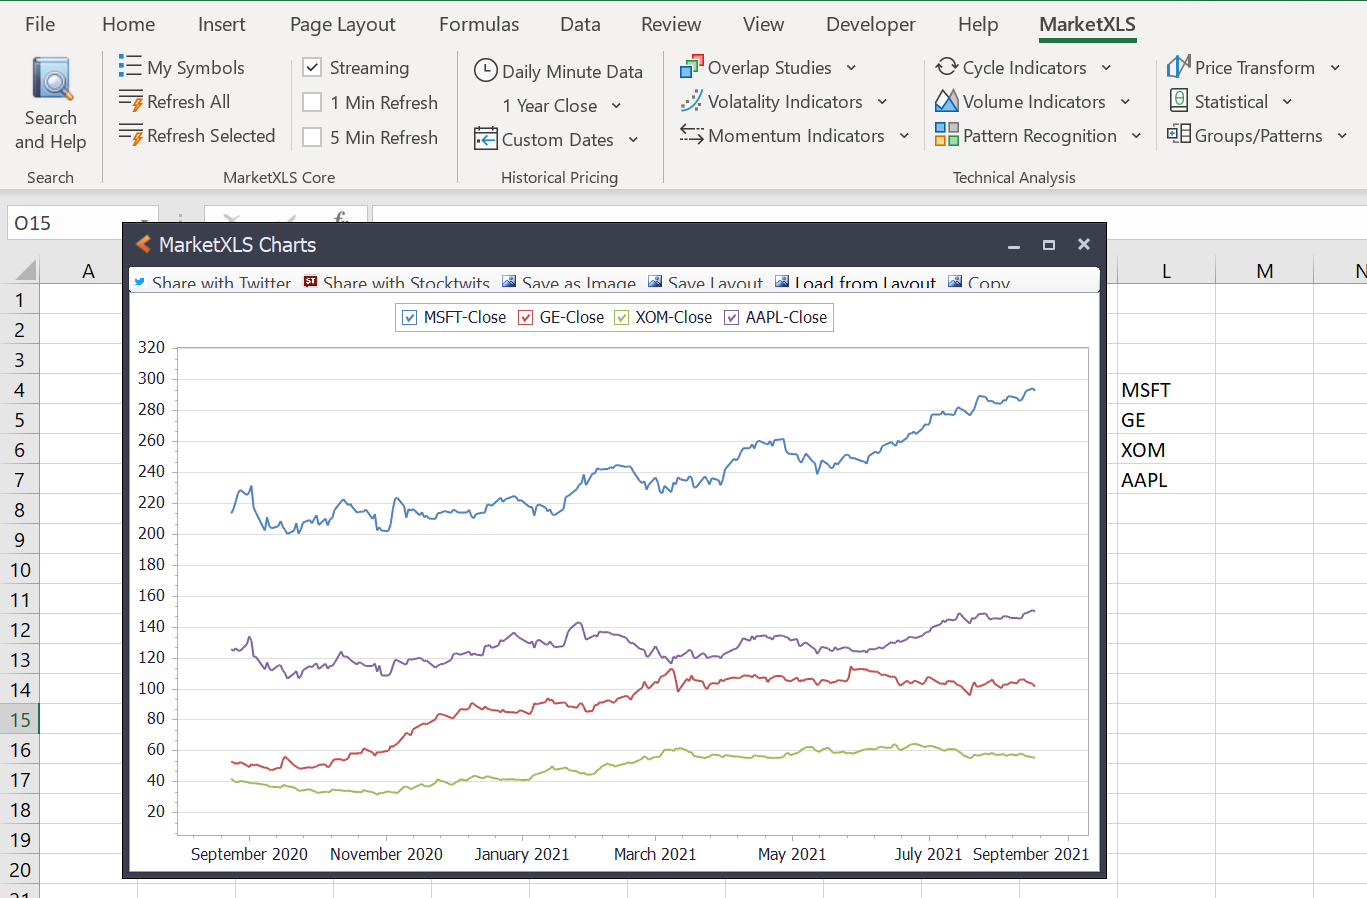
View the Chart
Once you select a chart type, the desired chart will open in a new window within seconds. In our example, I chose to select the 1 Year Day Chart, which will plot the daily closing price of the stocks for the past 1 year. The chart is shown below:
Available Quick Chart Types
Minute Chart
Displays intraday minute-by-minute price movements for selected stocks.
Day Charts (Multiple Periods)
Plot daily closing prices over various time periods (1 month, 3 months, 6 months, 1 year, etc.).
Price Comparison Chart
Compare multiple stocks side-by-side on the same chart for relative performance analysis.
Quick Candlestick Chart
Display OHLC (Open, High, Low, Close) data in traditional candlestick format.
Key Benefits
- Instant Creation: Charts appear within seconds of selection
- Interactive Display: Zoom, pan, and inspect data points with crosshairs
- Multi-stock Support: Plot multiple stocks on the same chart for comparison
- Currency Charts: Also supports currency pair charting
- No Configuration Needed: Just enter symbols and click the chart type