Getting Historical Stock Prices in Excel
MarketXLS allows you to easily get historical stock prices for multiple time periods.
The options for getting historical pricing are available in the main MarketXLS panel as shown below:
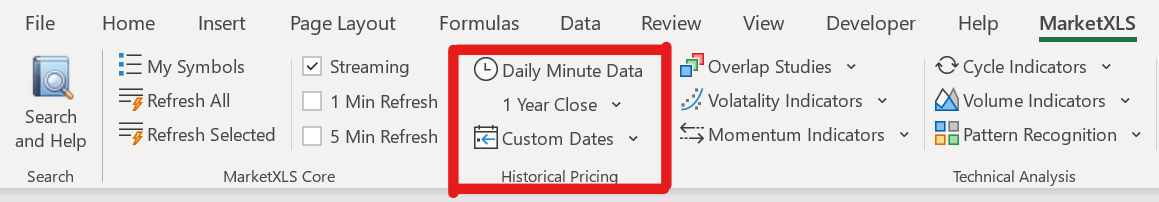
To use these options, simply select up to 10 cells with valid stock symbols and click on these buttons.
- Daily Minute Data: This will get the minute by minute pricing on today's date
- 1 Year Data: This will get the daily end of the day close prices of selected stocks for one year period
- Custom Date: This allows you to select the dates from when you want the data. This data is EOD daily. The data is available for all US stocks for 20 Years. And is updated daily in our database.
Key features of the historical data are as follows:
- Covers all stocks trading on NASDAQ, AMEX, NYSE, and ARCA.
- Includes unadjusted and adjusted open, high, low, close, volume.
- Includes dividend history and split history.
- Updated at or before 5 pm on all trading days
The historical data will be nicely formatted and indexed on a date with each column representing a symbol for easier comparison and further analysis.
Historical data also includes Dividends and Splits.
More about Custom Dates
When you use custom dates to retrieve historical stock prices, you have many options for the periodicity for which you want to get the data. You can choose to retrieve daily, weekly, monthly, or quarterly stock prices.
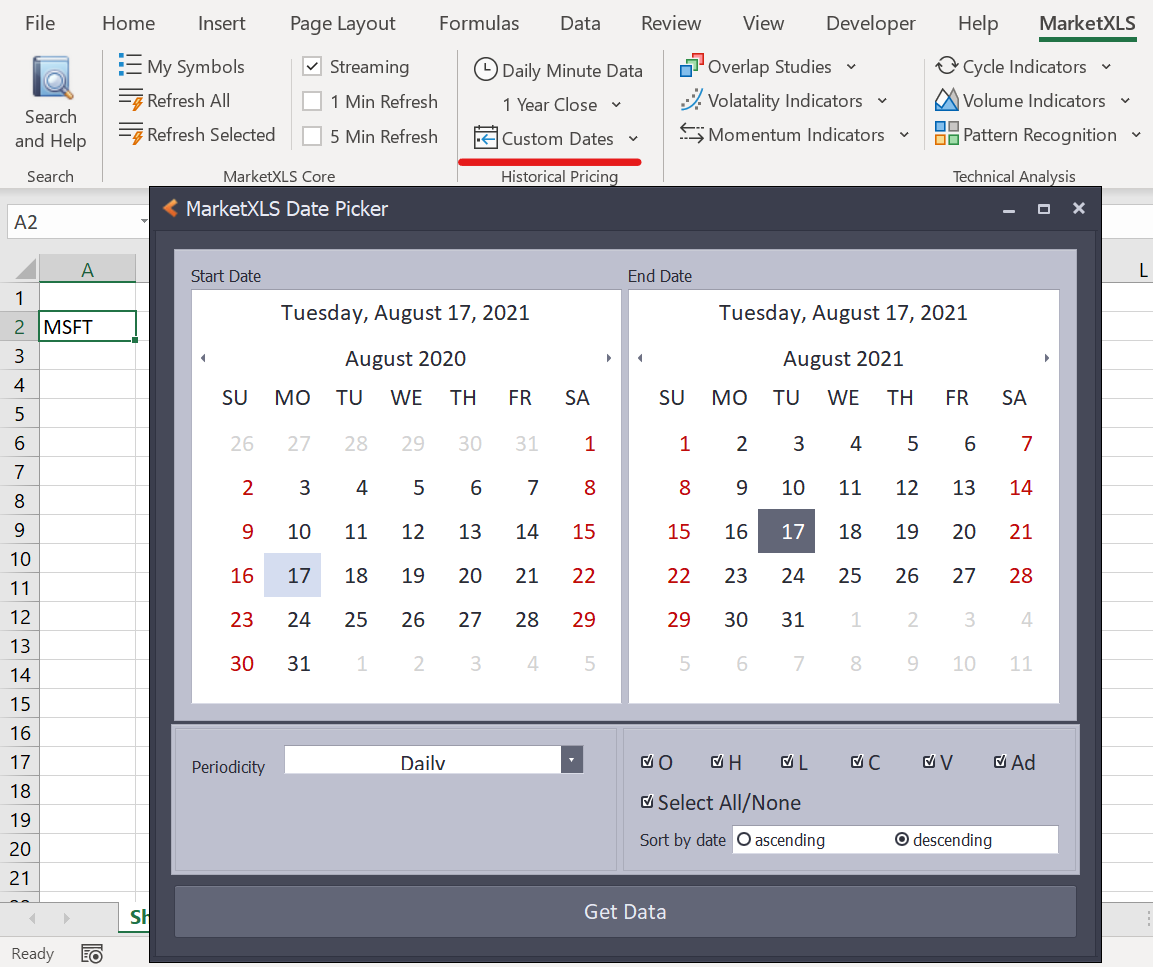
Let's say you want to retrieve stock prices for Google. Enter the stock symbol in a cell in the spreadsheet (MSFT). Once you've entered the stock symbol, click the 'Custom Dates' button in the menu. You will be presented with a custom date selection popup window. In this window, select the date range for which you want to get the stock prices. Along with that, you can also change the periodicity to Weekly, Monthly, or Quarterly (default is daily). Now press the 'Get Data' button and the stock prices will be presented in a new sheet. I selected the time period of 17th August 2020 to 17th August 2021 and weekly periodicity. The results are shown below:
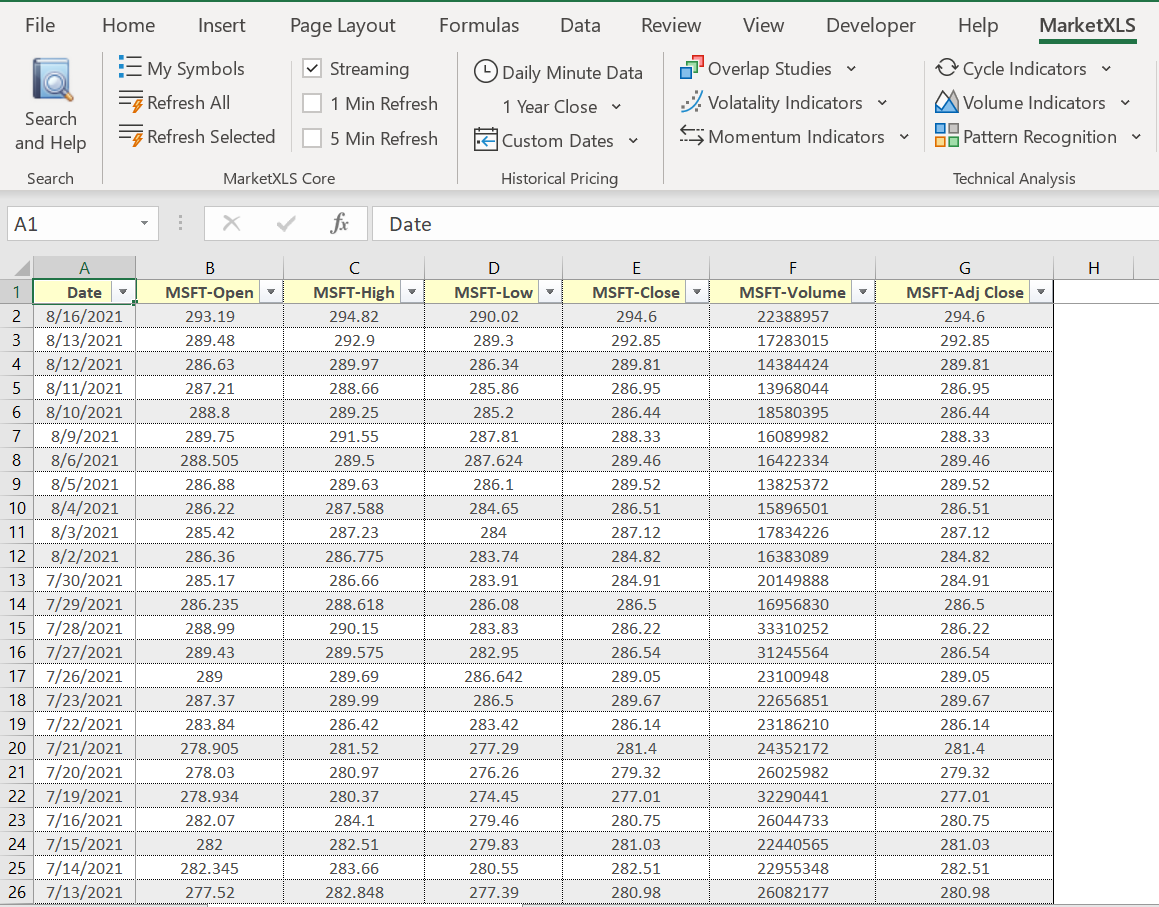
As you can see, you now have the weekly historical stock prices for Microsoft's stock. You can even select multiple stock symbols and the resulting table will contain all the information for all the selected stocks (maximum 10). To present to you the weekly, monthly, and quarterly data, we resample the daily data to the new periodicity.