
Historical stock data in Excel


What historical data MarketXLS puts in Excel
Prices, intraday bars, dividends, splits, and historical fundamentals
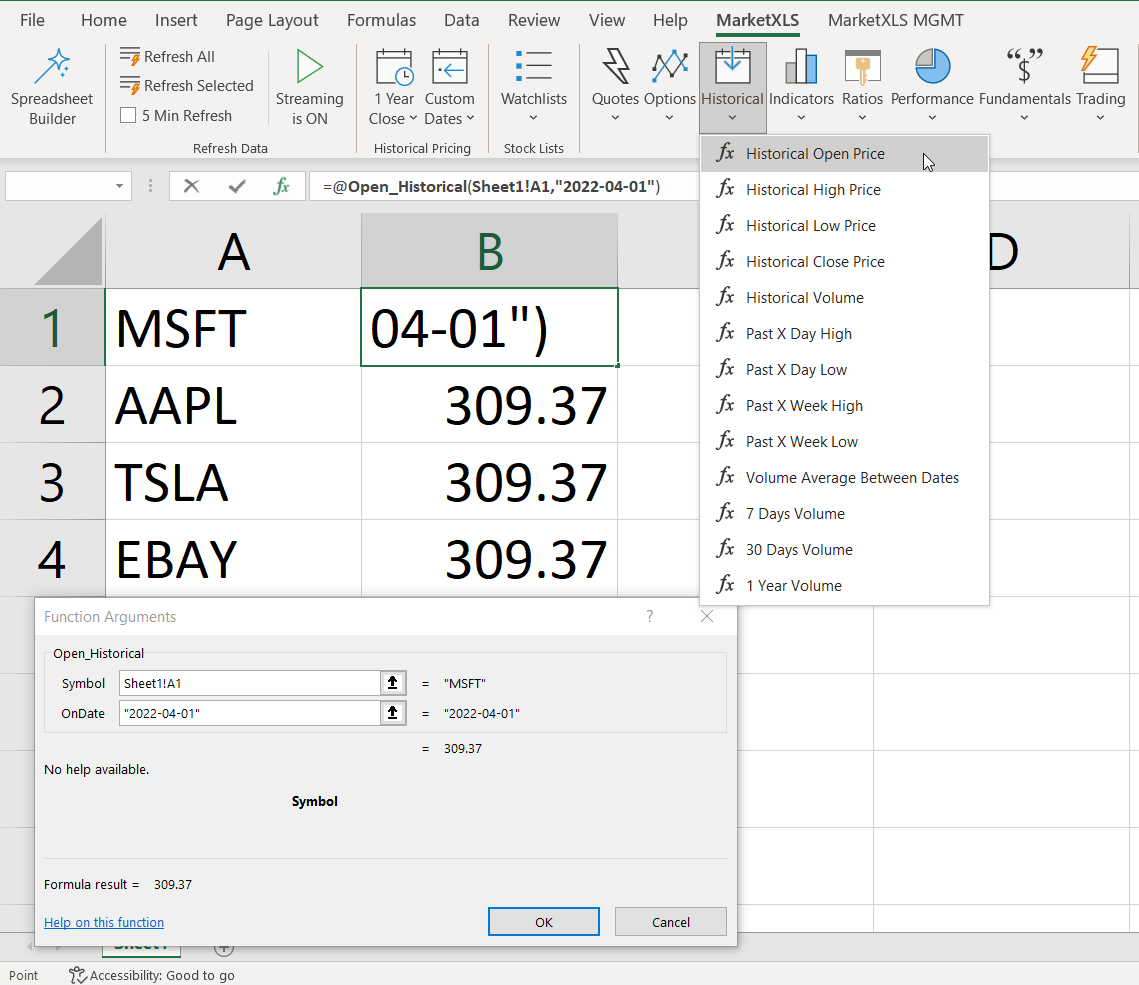
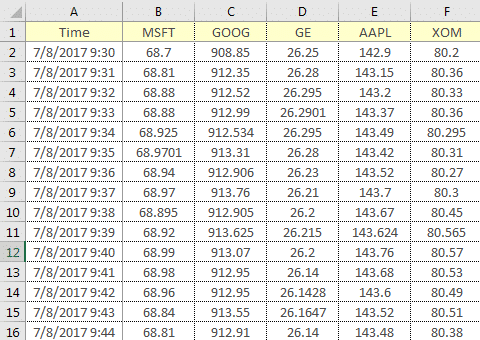
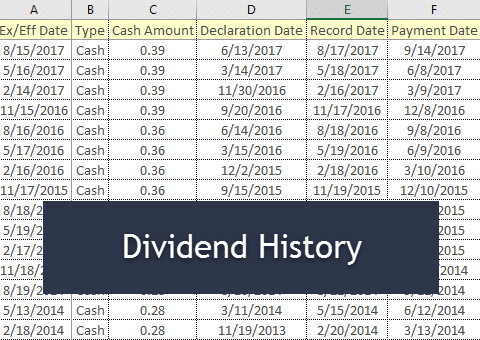
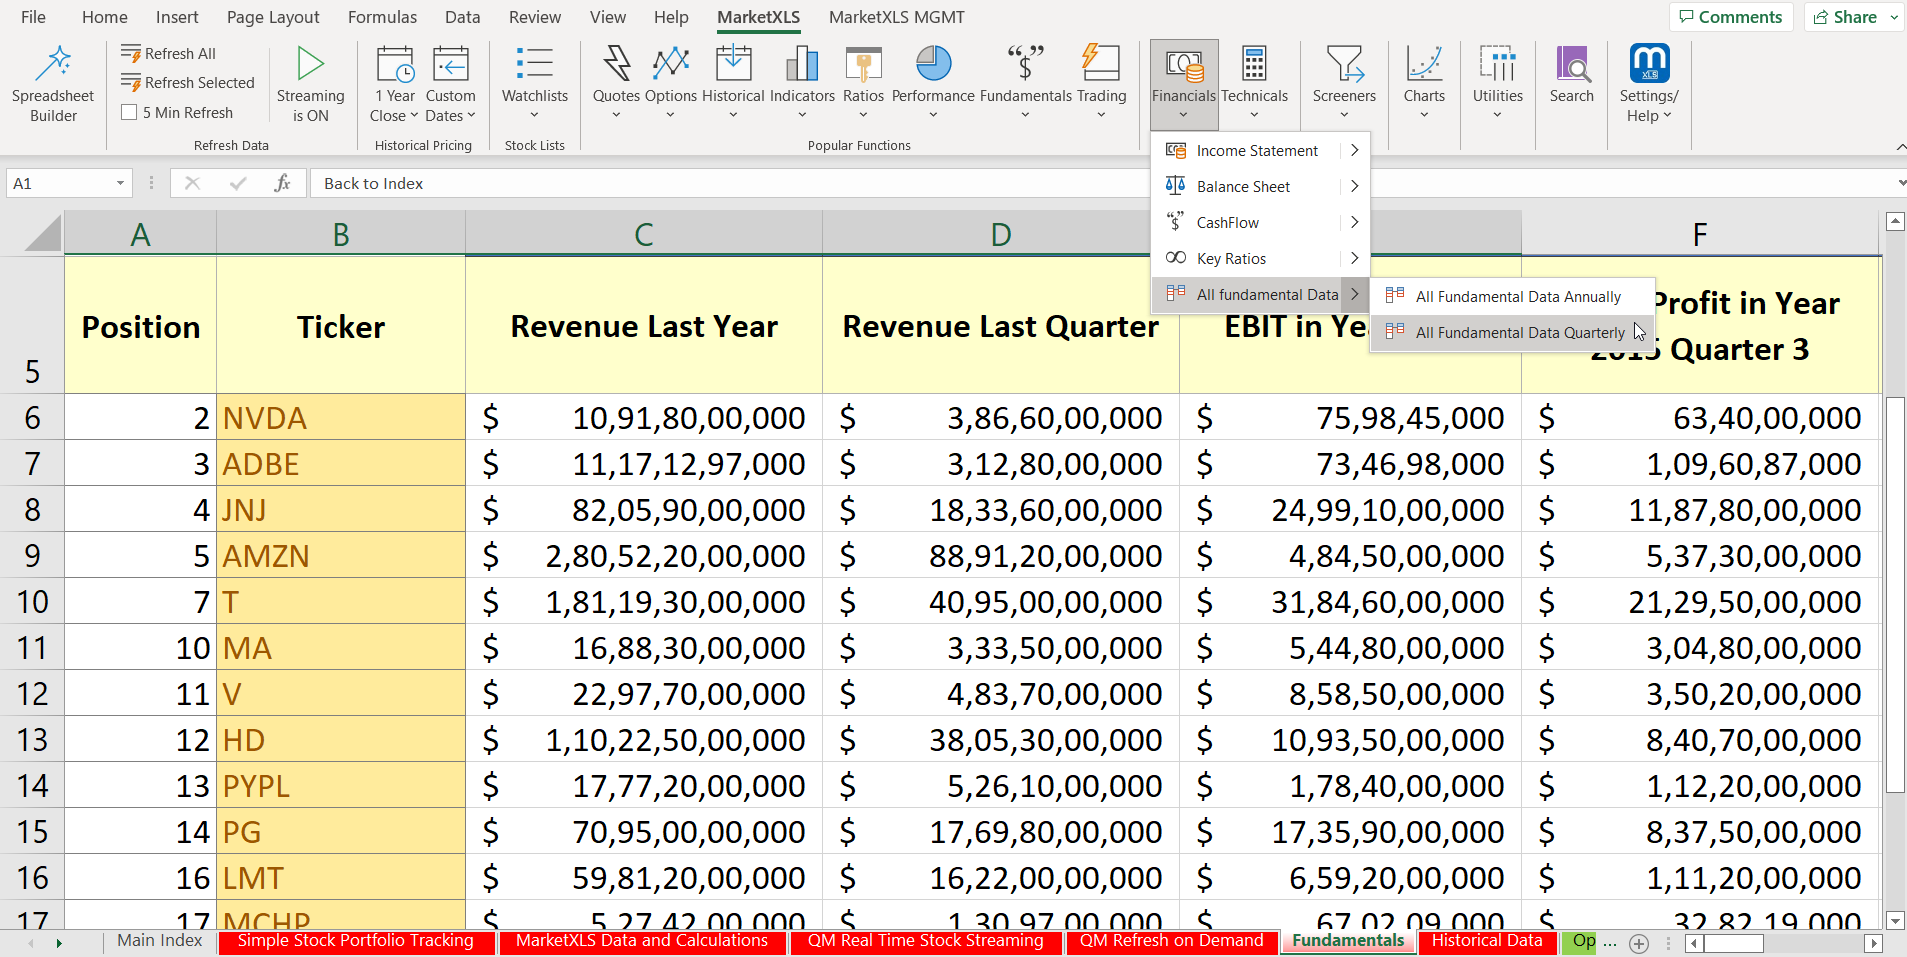
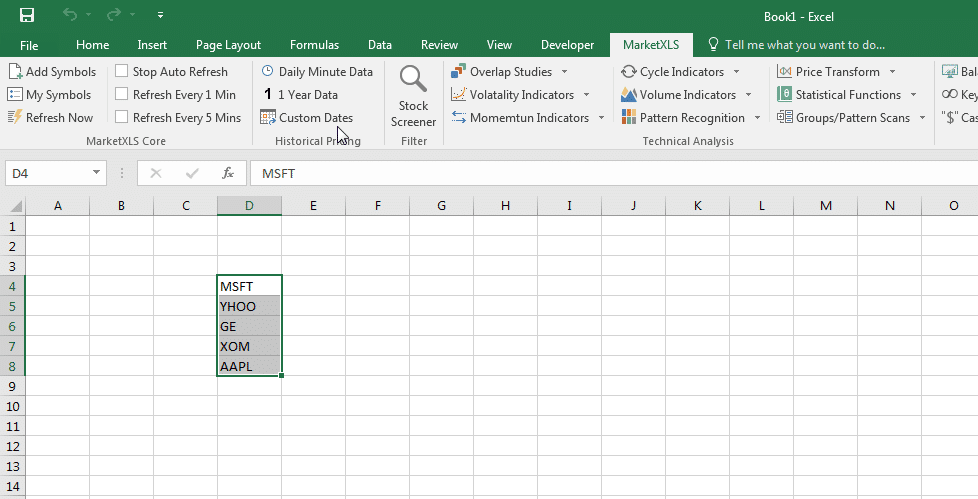
How to get historical stock data in Excel without formulas

Frequently asked questions
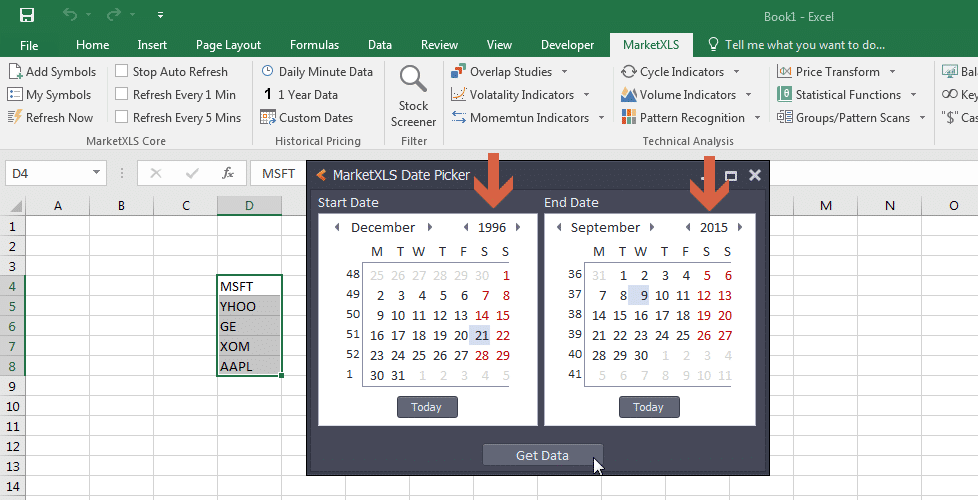
Install MarketXLS and type =Close_Historical("MSFT", TODAY()-20) for the closing price on one date, or =QM_GetHistory("MSFT") for a table of historical prices. You can also use the Custom Dates button on the MarketXLS ribbon to pick a ticker, a date range, and daily, weekly, or monthly bars.
Yes. =Adjusted_Close_Historical("MSFT", DATE(2024,1,2)) returns the split- and dividend-adjusted close for one date. The Custom Dates button returns adjusted close prices as a table, sorted ascending or descending, at daily, weekly, or monthly frequency.
No, not for stocks and ETFs. Historical price functions and the Custom Dates button work with all MarketXLS subscriptions. A Barchart subscription is only needed for data from exchanges such as CME, COMEX, CBOT, and ICE Canada. Intraday historical data is not included on every plan, so check the pricing page.
Streaming functions such as =QM_Stream_Last("MSFT") update automatically while streaming is on; real-time streaming needs the Advanced or Business plan. On-demand functions such as =QM_Last("MSFT") return a snapshot that updates when you click refresh on the MarketXLS ribbon or Excel recalculates.
Use single-field functions such as =Open("MSFT") for the open price. MarketXLS has similar functions for high, low, close, bid, ask, volume, and change.

Book a demo with our team to explore the features and workflows relevant to your research.