

Introduction
Are you using Excel to track stock prices or manage your investments? You’re in luck! Excel stock functions offer powerful tools that make it easy for users to keep tabs on their investments. Whether you’re a financial analyst or an individual investor, Excel’s stock functions can simplify your stock market analysis. This guide will help you understand how to use Excel’s stock functions and introduce you to tools like MarketXLS, which expand the capabilities of your financial analysis right from your spreadsheet. Let’s dive in and explore how you can start using Excel to monitor stock prices, historical data, and much more!
Is there a stock function in Excel?
Yes, Excel has a stock function. It allows users to track stock prices and related information. You can access it via the “Stocks” data type. This feature pulls real-time stock data from online sources. First, select the cells with your stock symbols. Then, click on the “Data” tab and choose “Stocks.” Excel will automatically convert these symbols into stocks and provide updated metrics. You can display details like current price, market cap, and more. This makes it easy to monitor investments directly within your spreadsheet. The stock function is especially useful for financial analysts and individual investors.
What is the formula for stock in Excel?
In Excel, the formula to track stock prices is the “STOCKHISTORY” function. This function allows users to retrieve historical data for a specific stock. You can enter the ticker symbol, start date, end date, and interval to get the desired data. For example, entering “=STOCKHISTORY(“AAPL”, “2022-01-01”, “2022-01-31″, 0, 1, 1, 1, 1)” will provide Apple’s stock prices for January 2022. The first parameter is the ticker symbol. The subsequent parameters set the date range and data frequency. The function is particularly useful for financial analysis and investment tracking. If you need real-time data, Excel also supports the “STOCKS” data type for live updates. This versatile tool streamlines stock market analysis right in your spreadsheets.
How do you use Excel to stock take?
Using Excel for stock taking involves a systematic approach to record and manage inventory. First, create a spreadsheet with columns for item names, categories, quantities, and other relevant details. Ensure each row represents a unique item. Regularly update the sheet to reflect additions or deductions in inventory. Use formulas to automate calculations, such as total stock value and reorder points. Employ filters to quickly sort and find specific items. Pivot tables can summarize large amounts of data efficiently. Finally, regularly back up your Excel file to prevent data loss. This method helps in accurate tracking and efficient management.
How do I automatically update stock prices in Excel?
To automatically update stock prices in Excel, you can use the built-in “Stock” data type feature available in Excel 365 or Excel 2019. Start by entering the list of stock ticker symbols in a column. Select the cells containing the ticker symbols, then go to the “Data” tab and click on the “Stocks” button in the “Data Types” group. Excel will then convert the symbols into rich data types linked to online data sources. Hover over a cell and click on the icon that appears to fetch detailed stock information. You can also add columns to display different information like current price, change, and more. If you set your workbook to update automatically, these values will refresh periodically, ensuring you have the latest data. For older versions, you may need to use external tools or add-ins like Yahoo Finance or Google Finance.
What is MarketXLS?
MarketXLS is a powerful financial analysis tool for Microsoft Excel. It integrates seamlessly with Excel, making it easy to analyze financial data. Users can access real-time stock quotes, historical data, and financial ratios. The tool is ideal for traders, investors, and financial analysts. It also offers portfolio management features. With MarketXLS, users can automate complex calculations and streamline their workflow. It supports importing data from various stock exchanges globally. The platform is user-friendly and customizable. Additionally, it provides advanced charting capabilities to visualize data trends. This makes it a valuable tool for making informed investment decisions.
Why MarketXLS is a better and more premium alternative to default Excel stock functions?
MarketXLS stands out as a premium alternative to the default Excel stock functions due to its extensive features, comprehensive data coverage, and advanced analytical capabilities. Here are several key reasons why MarketXLS is superior:
1. **Enhanced Data Sources and Coverage **:
– MarketXLS provides data not just for stocks but also for cryptocurrencies, offering a unique methodological approach to pull in crypto data from various exchanges like Binance and BitMEX, or a default method when not listed.
– Extensive datasets including intraday prices, historical data, technical indicators, and other analytical metrics such as drawdown and stock returns, make MarketXLS’s data coverage superior to standard Excel functionalities.
2. Advanced Analytical Functions:
– MarketXLS includes a variety of functions tailored for investment research, such as Guru Screen functions based on strategies from famous investors. These functions allow users to screen stocks according to predefined parameters without needing complex setups.
– The software also introduces unique functions such as StockReturn for calculating stock returns considering both price appreciation and dividends, Close_Historical that allows retrieving historical stock prices considering market holidays, and various options-related functions that are not available in default Excel.
3. Templates and Customization:
– MarketXLS offers numerous premium templates for different strategies like options, stock valuation, and more. These templates save users time and effort by providing ready-made solutions that can be customized according to specific needs.
4. Efficiency and Speed:
– The “Refresh-On-Demand” functionality has been optimized for speed, making data retrieval significantly faster than previous versions, enhancing user productivity.
5. Additional Utilities and Tools:
– MarketXLS includes a wide range of utilities like option symbol converters, option chains, and stock ranking tools that offer comprehensive functionality for stock market analysis that goes beyond what default Excel features can provide.
– An advanced portfolio optimization tool called “Portfolio Efficient Frontier Chart” which helps in financial planning by displaying different portfolio strategies based on user-defined parameters.
6. Integration and Expanded Functionalities:
– MarketXLS integrates with trading platforms such as Tradier to allow users to execute trades directly from Excel, which adds considerable convenience for active traders.
7. Continuous Improvement and Support:
– Regular updates ensure MarketXLS evolves with new features and optimizations. For example, recent improvements have added capabilities such as obtaining split histories and calculating potential profit/loss from options trading strategies.
– MarketXLS is widely supported with resources such as a comprehensive knowledge base, a YouTube channel with strategy videos, and dedicated customer support.
In summary, MarketXLS enhances the default Excel experience by offering superior data, advanced analytics, extensive templates, optimized performance, and integrations with trading platforms, making it an invaluable tool for serious investors and analysts.
Here is the template you might want to checkout and MarketXLS has 100s of templates to get you started easily and save you time.
How can you track historical stock prices in Excel with MarketXLS?
To track historical stock prices in Excel using MarketXLS, you can utilize several built-in functions provided by MarketXLS to fetch historical data. Here are some steps and functions you can use:
MarketXLS Functions for Historical Data
1. Historical Open Price–Function: Open_Historical(Symbol, OnDate As Date)
– Description: This function returns the stock’s opening price for a specified date.
– Example Usage:
=Open_Historical("MSFT", "2020-11-19")=Open_Historical(A1, TODAY() - 1)
– Replace A1 with the cell containing your stock symbol and TODAY() - 1 to get yesterday’s data.
2. Historical Close Price–Function: Close_Historical(Symbol, OnDate As Date)
– Description: This function returns the stock’s closing price for a specified date.
– Example Usage:
=Close_Historical("MSFT", "2020-11-19")=Close_Historical(A1, TODAY() - 1)
– If the specified date was a holiday, the function returns the last trading day’s price.
3. Historical Adjusted Close Price–Function: Adjusted_Close_Historical(Symbol, OnDate As Date)
– Description: Returns the stock’s adjusted closing price for a specified date, accounting for any corporate actions.
– Example Usage:
=Adjusted_Close_Historical("MSFT", "2020-11-19")=Adjusted_Close_Historical(A1, TODAY() - 1)
– This is useful for analysis that considers corporate actions like stock splits.
4. Historical High Price–Function: High_Historical(Symbol, OnDate As Date)
– Description: Returns the stock’s highest price for a specified date.
– Example Usage:
=High_Historical("MSFT", "2020-11-19")=High_Historical(A1, TODAY() - 1)
– Provides insight into the highest trading price on a given date.
5. Historical Low Price–Function: Low_Historical(Symbol, OnDate As Date)
– Description: Returns the stock’s lowest price for a specified date.
– Example Usage:
=Low_Historical("MSFT", "2020-11-19")=Low_Historical(A1, TODAY() - 1)
– Useful for understanding the price floor on a given date.
Using MarketXLS Menu
– Historical Pricing Section:
– **1 Year Close **: Quickly pull a one-year history of prices for a ticker.
– Custom Dates: Control the custom timeframe for historical data. Select a ticker or group of tickers in Excel, choose your dates, and click on “Get Data” to create a new sheet with all the historical data.
By using these functions and the MarketXLS menu, you can efficiently track and analyze historical stock prices directly within Excel, allowing for better investment decisions and data analysis.
Here is the template you might want to checkout and marketxls has 100s of templates to get you started easily and save you time.
Monthly Returns Tracking Template
How does Excel’s STOCKHISTORY function work? How does it compare against MarketXLS StockHistory functions?
Sure, let’s dive into the comparison between Excel’s built-in STOCKHISTORY function and MarketXLS’s stock history functions. Both of these tools offer extensive capabilities for retrieving and working with historical stock price data, but there are differences in their functionalities and how they can be used.
Excel’s `STOCKHISTORY` Function
The STOCKHISTORY function in Excel is designed to fetch historical financial data for a given stock. Here’s an overview of its key features and usage:
– Syntax:
=STOCKHISTORY(stock, start_date, */ -->, */ -->, */ -->, */ -->, ...)
– stock: The ticker symbol of the stock (e.g., “MSFT”).
– start_date: The start date for the historical data.
– end_date: (Optional) The end date for the historical data. If omitted, it defaults to the current date.
– interval: (Optional) The interval of the data. Possible values are 0 (daily), 1 (weekly), and 2 (monthly).
– header: (Optional) Indicates whether to include headers for the data. Possible values are 0, 1, or 2.
– ** property1, …**: (Optional) Additional properties to include, such as the stock open, high, low, close prices, volume, etc.
– Example:
=STOCKHISTORY("MSFT", DATE(2022,1,3), TODAY(), 0, 1, 0, 2, 3, 4, 1)
This script retrieves Microsoft’s historical data from 3rd January 2022 to today, on a daily interval, and includes headers.
MarketXLS Stock History Functions
MarketXLS offers more specialized and potentially more flexible functions for retrieving historical stock data. Here are some key functions and their usages:
– **QM_getHistory Function **:
– Retrieves historical data similarly to Excel’s STOCKHISTORY but can also include today’s streaming data.
– Example:
=QM_getHistory("MSFT", "2022/01/03", "2022/01/07")
This will pull data for Microsoft from January 3rd to January 7th, 2022.
– Other Specific Functions:
– Close_Historical: Fetches historical closing price.
=Close_Historical("MSFT", "2020/11/19")
– Adj_Close_Historical: Fetches adjusted closing price considering stock splits.
=Adj_Close_Historical("MSFT", "2020/11/19")
– Open_Historical: Fetches historical opening price.
=Open_Historical("MSFT", DATE(2020, 11, 19))
– Low_Historical: Fetches historical lowest price.
=Low_Historical("MSFT", DATE(2020, 11, 19))
– High_Historical: Fetches historical highest price.
=High_Historical("MSFT", DATE(2020, 11, 19))
Advantages of MarketXLS Over Excel STOCKHISTORY:
1. Real-Time Data Integration: With MarketXLS, you can not only get historical data but also integrate real-time data into your spreadsheet, something the STOCKHISTORY function does not support.
2. Flexibility and Specificity: MarketXLS functions allow for more targeted data retrieval, such as fetching opening, closing, high, low, and adjusted prices with specific functions.
3. Additional Options and Data: MarketXLS offers more specialized data retrieval options, including intraday data, volatility, corporate actions, option data utilities, and more .
4. Dynamic Updates: Functions like QM_ListDynamic allow the data to be dynamically updated, ensuring you always work with the latest information without needing to refresh the entire dataset manually .
Comparison Summary:
– Automation: Both solutions support pulling historical data automatically, but MarketXLS provides greater flexibility in terms of the data points and intervals you can retrieve and incorporate into your analysis.
– Real-Time Data: MarketXLS includes functionality for real-time data, a major advantage if you need up-to-the-minute data updates.
– ** Functionality**: Excel’s STOCKHISTORY is quite straightforward and useful for simple historical data retrieval, while MarketXLS offers more advanced and varied functionalities which might be more beneficial for in-depth analysis and dynamic data needs.
In conclusion, if your needs are basic historical data lookups, Excel’s STOCKHISTORY is quite handy and easy to use. However, for more advanced, real-time, and specialized data analysis, MarketXLS functions offer superior capabilities and flexibility .
Here is the template you might want to checkout and MarketXLS has 100s of templates to get you started easily and save you time.
• Stock Portfolio Tracking Spreadsheet**
Get the template using the link below:
• [Stock Portfolio Tracking Spreadsheet – MarketXLS](https://marketxls.com/marketxls-templates/469/stock-portfolio-tracking-spreadsheet)\*\*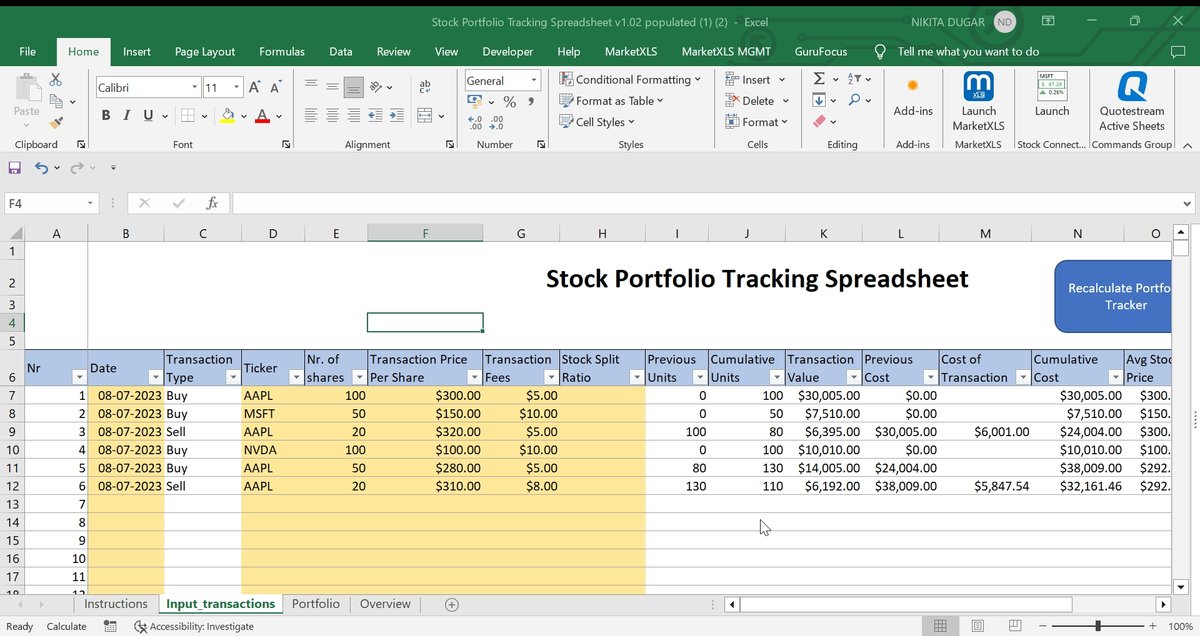
Are there any templates available for stock tracking in Excel?
Yes, MarketXLS provides several templates for stock tracking in Excel. You can download these templates directly from the MarketXLS Tool Panel on the right sidebar within the Excel application. Here are some details:
1.**Watchlist Template **: A stock watchlist allows you to save your list of stocks and easily export them to an Excel sheet.
2. Individual Tracking Template: This template showcases stocks’ 52-week highs, lows, returns, Simple Moving Average (SMA), returns against the market’s return, and more by changing the stock ticker.
3. ** Popular Template Bundles**: MarketXLS offers several bundles of templates designed for various tasks like options strategy, portfolio analysis, and stock valuation.
These templates are helpful for stock tracking, analysis, and comparison among multiple stocks. To access these templates, open the Search and Help bar found on the top left of the MarketXLS Menu, click on templates, and download the ones you need.
Here is the template you might want to checkout and marketxls has 100s of templates to get you started easily and save you time.
Stock Portfolio Tracking Spreadsheet

Stock Portfolio Tracking Spreadsheet
Summary
Excel helps you manage and analyze stocks using built-in functions. The “Stocks” data type in Excel provides real-time stock data.
To track stock prices in Excel, use the “STOCKHISTORY” function for historical stock data. For example, `=STOCKHISTORY(“AAPL”, “2022-01-01”, “2022-01-31”, 0, 1, 1, 1, 1)` retrieves Apple’s stock prices for January 2022.
For inventory, create a spreadsheet with item names, categories, and quantities. Regular updates ensure accurate tracking.
MarketXLS is an advanced Excel tool that provides real-time data, financial ratios, and extensive stock information, enhancing Excel’s default capabilities. MarketXLS includes templates for portfolio tracking and financial analysis.
MarketXLS functions like `Open_Historical`, `Close_Historical`, and others offer tailored data retrieval, providing flexibility and real-time integration compared to Excel’s STOCKHISTORY function.
To update stock prices automatically in Excel, use Excel 365’s “Stock” data type or consider MarketXLS for more features.
MarketXLS templates help save time. You can track historical prices, view returns, and analyze stocks effectively using these tools.
