Margin Of Safety Analysis Of Stocks With Formula In Excel (With Marketxls)
")
Let us find out if there is a fast and easy way to screen stocks that are underpriced by the market using margin of safety analysis of stocks.
Margin of safety analysis of stocks
Key Concepts
Before we get down to the analysis, let us understand the key concepts we will use to perform this margin of safety analysis.
- Book value per share: If you assume that a company liquidates as on today, then what will be the value of one share. That means if you are a shareholder of the company and you own one share how much money you will get if the company shuts down today. So as the name suggests, this is the value of your share as per the books of the company.
- Margin of safety: Let us assume that the book value per share of a company is $10, but the market price of one share is $20. The difference between the market price and the book value is the margin of safety. Remember that the market price of a share may not always represent the value of that share. So in this scenario, even though we know for a fact that the value of one share of this company is $10 but still the market price of one share of the company’s $20. So, we may conclude that the market price is higher than the value of that share. Which means that the stock is possibly overvalued by the market.
What we want to do with our analysis is find out, if there are some stocks where book value is higher than the market price. And also look to establish a relationship between the book value and the market price by looking into the historical data of some stocks. This analysis will make us more confident when we actually make our decision to recommend or buy an undervalued stock with this approach.
Using MarketXLS Formulas
MarketXLS has inbuilt functions to get the historical book value per share and also to get the historical close prices of the stocks. Below is the syntax that we will use to get these values.
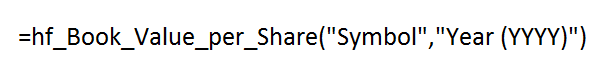
This function will get the book value per share of any symbol in the history.
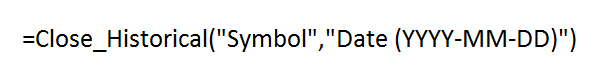
This function will get the historical close price of any symbol in the history on a specific date.
And this function will get the last price of the stock. The last price in the current price at which this stock is trading.
Analyze one stock
So before we do this analysis for the whole of the S&P 500, let’s value one stock. As you can see below I have collected the book value and the price of Microsoft in 2016. Now you may wonder what price point we will take as a representative of the whole year of close prices. For this analysis, we have taken the close price at the last trading day of a year.
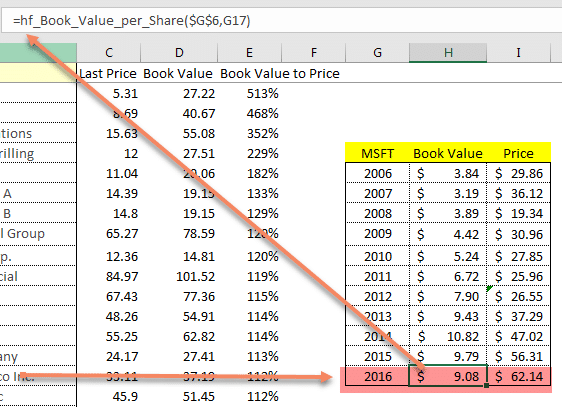
So the value $9.08 the is the book value of Microsoft and the period ending 2016 and the price $62.14 is the close price on the last day of trading in 2016.
The difference between the market price and the book value per share is the margin of safety. The higher this difference the higher the market perceives its value to be. However, as we understood earlier markets may not represent the real value of the stocks at all the time.
So, what if the market price of the stock is exactly same as its book value? In that case, we may say that the stock price is fairly valued by the market.
Now let’s look at what is the situation today as on July 7, 2017. We can simply use the formula like shown below. Instead of looking at each number we can calculate the ratio of the book value to the last price. This ratio shows us, that book value is x percent of the stock price.
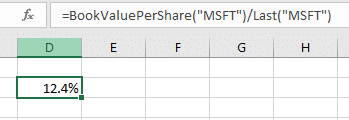
When this ratio is 100% it means that the stock is fairly priced by the market and the sentiments do not play a big role in the price. In other words, the price is based on facts and not the opinion of the traders and speculators. When this value is 0% it means, that in reality there is no value in this company but still the market is assigning a value to it.
Screen the whole market for margin of safety analysis of stocks
So now we will do this margin of safety analysis of stocks for the whole of S&P 500 and find out the ratio of the book value to the stock price. So, we calculate the ratio and then sort the table in descending order of the ratio.
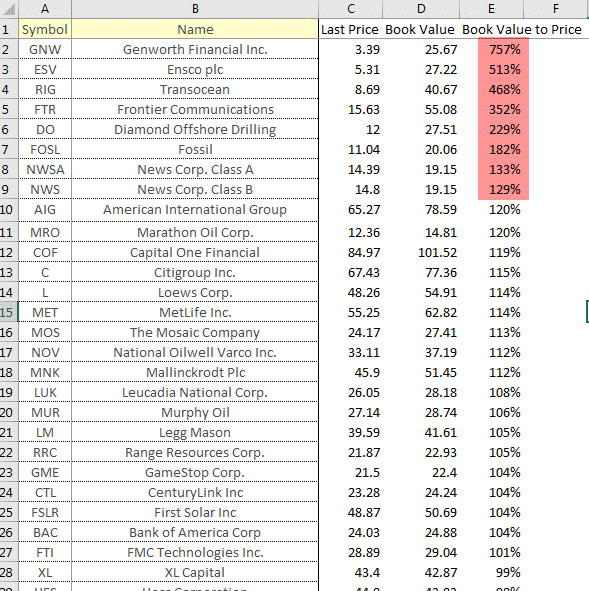
After doing this analysis we find a few stocks in S&P 500 which seems to be undervalued by the market. This analysis definitely provides us with some good candidates for further exploration.
Validations with historical data of multiple stocks
In an ideal world, the more the book value the more should be the share price. And if the book value per share of the stock is growing over the years its price should also increase. That means the book value per share will normally have or should have a direct relationship with the price of the share.
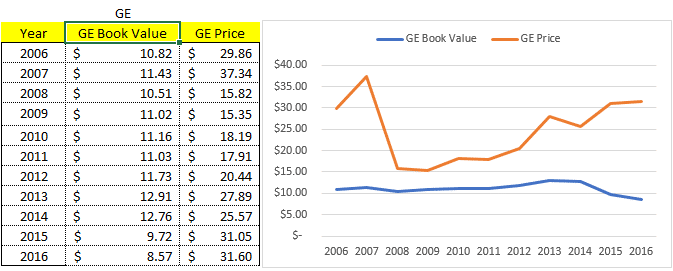
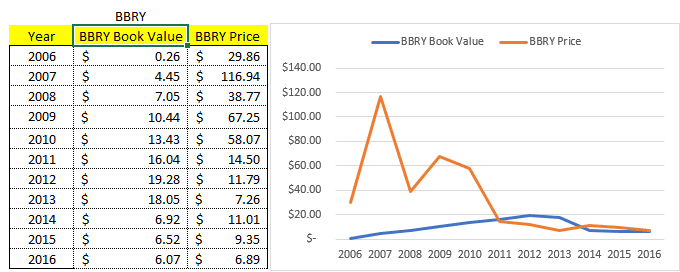
I have charted below the relationship between the book value and the price of various stocks to validate this.

When looking at the book value and the price with the time perspective, we can now some very interesting observations. For example, in the case of Blackberry, market initially started to be very optimistic about the company. But as the years passed the price settled near the Book Value.
In all these charts you would notice that the orange line is above the blue line. So, the price is mostly above the book value per share. But in the interesting case of GNW (Genworth Financial, Inc. (NYSE)) the book value is higher than the current trading price. So, we should look at this for our further analysis in our conquest of finding undervalued stocks.
Perform margin of safety analysis of stocks with MarketXLS with more than 300 inbuilt stock market formulas.
[thrive_leads id=’5213′]

I invite you to book a demo with me or my team to save time, enhance your investment research, and streamline your workflows.