Technical Indicators For Swing Traders (Using Marketxls)
")
Meet The Ultimate Excel Solution for Investors
- Live Streaming Prices Prices in your Excel
- All historical (intraday) data in your Excel
- Real time option greeks and analytics in your Excel
- Leading data in Excel service for Investment Managers, RIAs, Asset Managers, Financial Analysts, and Individual Investors.
- Easy to use with formulas and pre-made sheets
Swing trading is a market strategy where positions are held for longer than one day. Most fundamentals traders tend to be swing traders because changes in the fundamentals of a corporation usually take several days or sometimes even weeks. This means that they have to hold their positions longer in order to profit significantly from price movements.
Essentially swing traders aim to profit from smaller price moves within a wider trend. They use the principle that price movements are rarely linear and it tends to oscillate. Swing traders use these oscillations to make profits for themselves.
Like day trading, swing traders also aim to make profits from both the positive and negative price actions.
The key difference between swing traders and day traders is that swing traders aren’t required to close their positions at the end of the day; they can hold trades for as long as they believe the momentum will last.
Swing trading indicators are technical analysis tools that are used by traders to identify opportunities for momentum in the markets. These technical indicators can further be divided into five categories: trend, mean reversion, relative strength, volume and momentum. Let us look at a few in more detail.
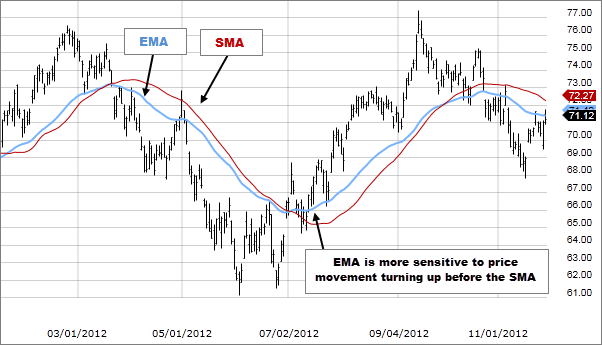
Moving Averages
Moving Averages(MA) are lagging trend indicators because they look back over past price action. Trend indicators analyse the movements of the market, whether it is going up or down, or sideways over time.
MAs calculate the mean of the market’s price movements over a period of time. A useful feature of using Moving Averages is that they smooth out any erratic short-term spikes. MAs are used for confirming past performance instead of predicting future movements. For example, the 50 day EMA(Exponential Moving Average) is used to measure the average intermediate price of a security. On the other hand, the 200-day EMA is used to measure the average long term price of a security. Swing traders use MAs to look out for crossover points. These occur when a short-term MA crosses the long-term MA. Technical traders believe that these points indicate that a change in momentum is going to occur.
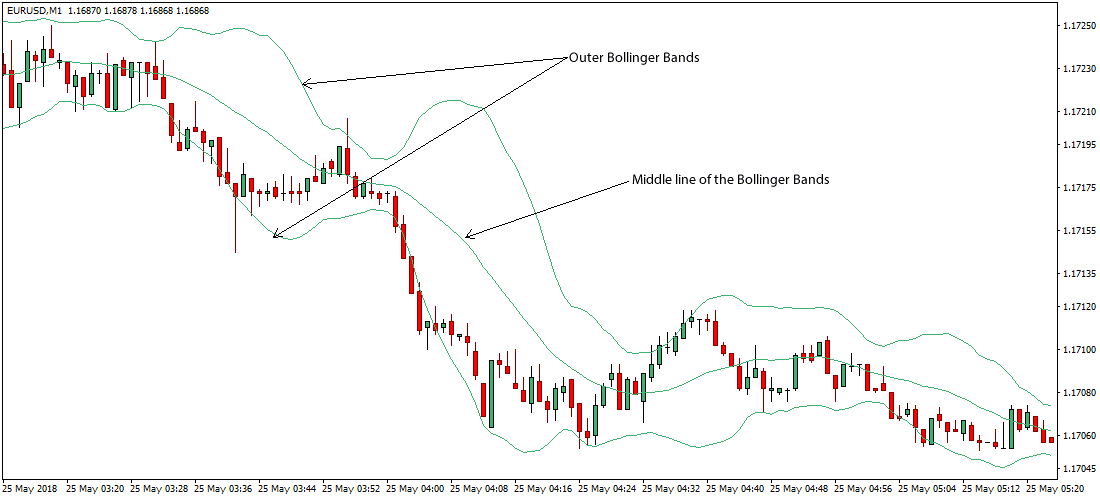
Bollinger Bands
Bollinger bands are mean reversion indicators. Mean reversion indicators are used to measure how far the price swing will go before counter triggers move the swing back to its original position.
Bollinger Bands are a technical analysis tool developed by John Bollinger to generate signals for stocks that are overbought or oversold. These bands identify the turning points of price movements and indicate how far the price swing will go before reversionary impulses bring it back.
Relative Strength Index
RSI is a momentum indicator. Momentum indicators evaluate the speed of the price change over time by highlighting potential oscillations within a broader trend. The Relative Strength Index (RSI) is one of the most popular indicators and it shows whether a market is overbought or oversold, thus indicating whether there might be a potential swing in the near future. RSI uses an oscillating chart with numbers between 0 and 100. It decides upon the number by measuring the market’s positive and negative closing prices over a predetermined period. Anything over 70 on the RSI indicates that the stock is overbought and it might be a good idea to short sell it. Anything below 30 indicates that the stock is oversold and it is a good idea to go long.
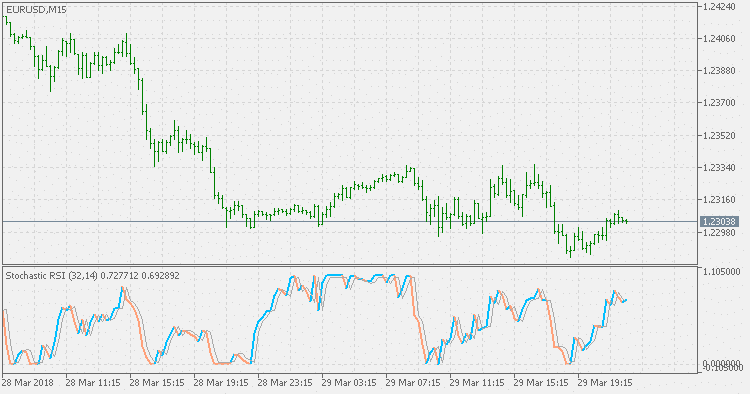
Stochastic Oscillator
Often compared with RSI, stochastic oscillators are another type of momentum indicator. Similar to RSI, stochastic oscillators also use the closing prices of a market over a period of time to indicate oversold or overbought characteristics. It also uses an oscillating scale ranging from 0 to 100. Anything over 80 is considered to be overbought while anything below 20 is considered to be oversold. However, this is where the similarities end. The Stochastic Oscillator uses two lines, one showing the current value of the oscillator and the other showing the three-day Moving Average. As price is thought to follow market momentum, the intersection of these two lines may indicate that a reversal is approaching. RSI is thought to be more useful in analysing trending markets, while Stochastic Oscillator is better for sideways markets.
Money Flow Index
Money Flow Index is also an oscillating momentum indicator like RSI. MFI makes use of market signals to indicate whether a stock is overbought or oversold., However, it differs from RSI and other oscillating indices because it uses both volume and price data instead of simply using price data. A MFI value above 80 indicates that the stock is overbought and a value below 20 indicates that the stock is oversold. When the MFI oscillator diverges from price, it signals that a potential reversal of the price trend is on the horizon.
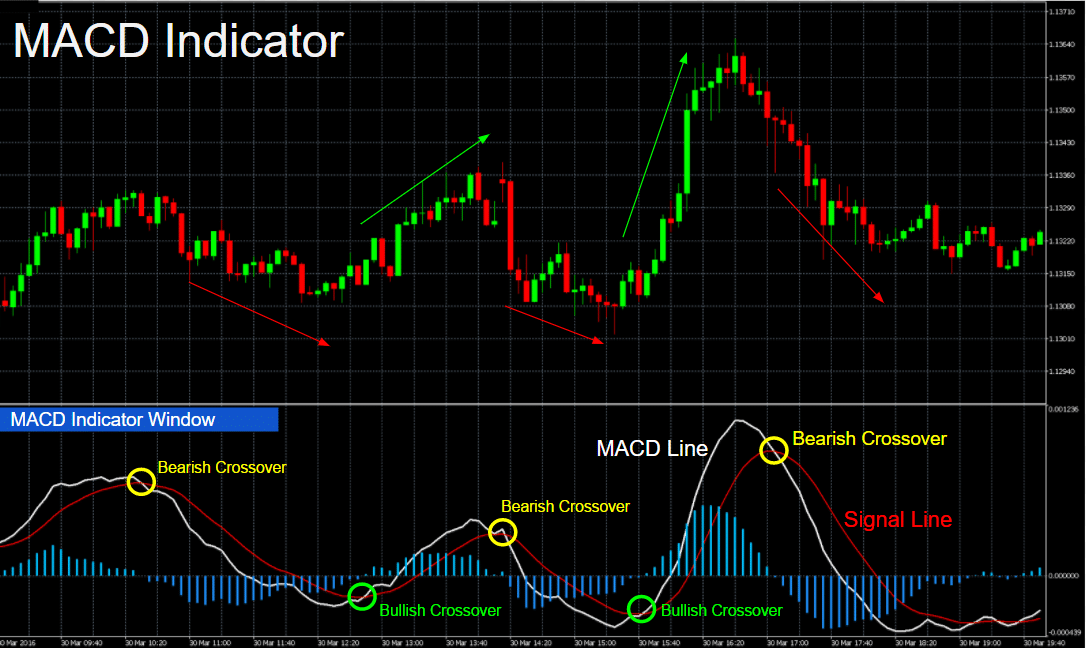
Moving Average Convergence Divergence (MACD)
MACD is another important momentum indicator as it gives new swing traders a way to track rapid price changes in the market. MACD measures how fast a particular market is moving. Turning points are reached when the histograms reach their peaks. At these points, the buy and sell signals go off. A lot of important market information can be extracted from the height, depth, and speed of change of the histogram, making MACD an important tool for novice as well as seasoned traders.
On-Balance-Volume (OBV)
OBV, as the name suggests, is a volume indicator. Volume indicators can be either leading or lagging and they are used to tally up the market trades and price movements to identify whether the market is bearish or bullish. Although OBV is plotted on a price chart, the quantitative values are not relevant in technical analysis. Analysts look at the nature of the OBV movements over time and use the slope of the OBV line to draw inferences. OBV is a leading indicator, so it can make predictions but nothing is said about the reasons behind these signals. Due to this, OBV can often make false predictions. To balance this out, OBV must be combined with lagging indicators like MAs to get better predictions.
Using MarketXLS
The technical analysis in excel functionality of MarketXLS provides almost every technical on your list. This includes overlap studies, volatility indicators, momentum indicators, volume indicators, pattern recognition and a growing list of more functions and data. You can combine the research from technical analysis with fundamental data provided by MarketXLS to perform powerful analysis.
First we need to obtain the historical data for our portfolio. Under the historical prices tab, customise your time period.

To perform technical analysis using MarketXLS, select the cells containing the OHLC pricing for your stock.
Click on any indicator from the menu and follow the prompts that show up. Unlike other functions, these prompts are already equipped with default values for parameters like time period, type of average, look-back period.
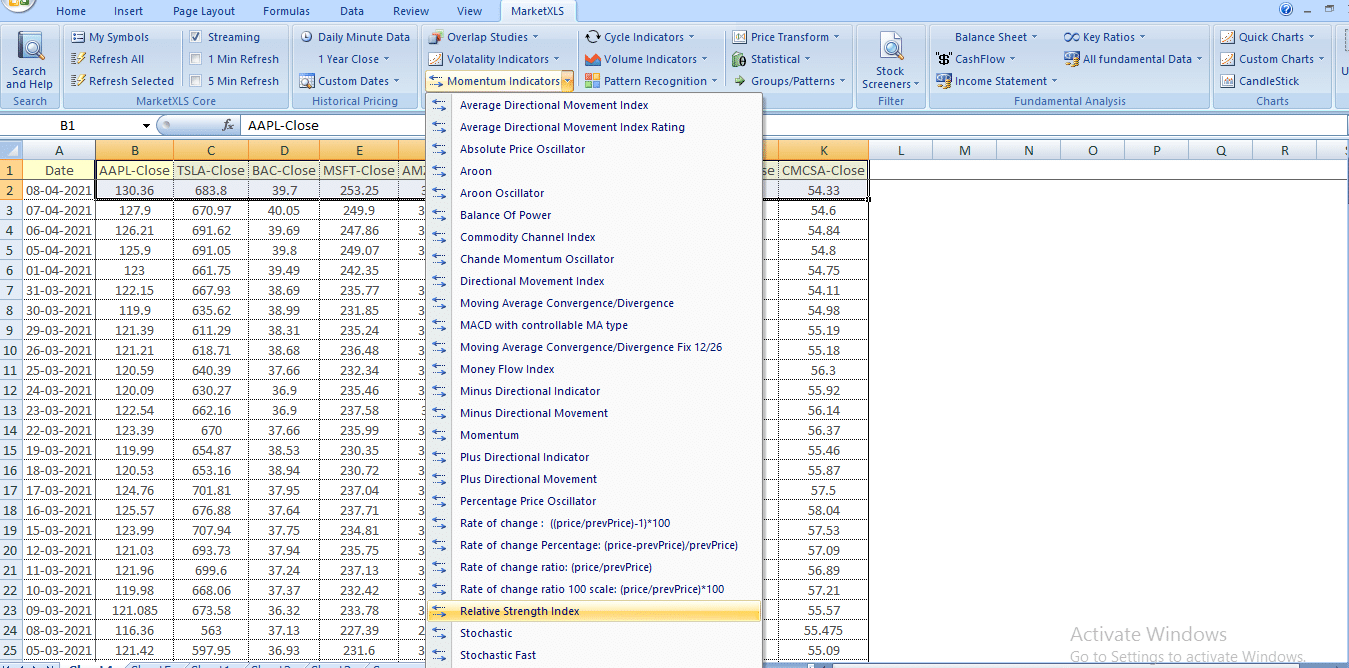
In case you want to compare your entire portfolio in one go, list your stocks in an Excel table and pull in the numeric values for RSI, MACD and other relevant technical indicators into the neighbouring columns. Then you can just sort your portfolio by comparing the indicator values to see if you want to hold onto or exit the stocks.
RSI-marketXLS.png”>
The Bottom Line
Technical indicators form an important part of a swing trader’s toolkit but one must remember that indicators alone don’t provide the complete picture of a market. Swing traders often combine predictions made by indicators with support and resistance patterns in order to improve their predictions for future trends and price movements.
Disclaimer
None of the content published on marketxls.com constitutes a recommendation that any particular security, portfolio of securities, transaction, or investment strategy is suitable for any specific person.
The author is not offering any professional advice of any kind. The reader should consult a professional financial advisor to determine their suitability for any strategies discussed herein.
The article is written for helping users collect the required information from various sources deemed to be an authority in their content. The images, copyrights, and trademarks if any are the property of their owners, and no further representations are made.
References

I invite you to book a demo with me or my team to save time, enhance your investment research, and streamline your workflows.