

The practical way to get commodity prices into Excel is to pull commodity ETF prices with a MarketXLS formula, for example =QM_Last("USO") for WTI crude oil, =QM_Last("GLD") for gold, and =QM_Last("SLV") for silver. The prices refresh when Excel recalculates, so the sheet does not fill up with pasted, stale numbers. Quotes are 15-minute delayed on the Standard plan and real-time on the Advanced and Business plans. For a daily spot benchmark rather than an ETF, =CrudeOilPrice() and =NaturalGasPrice() return spot prices from U.S. government data (EIA via FRED).
Try it in your own spreadsheet
Get the free MarketXLS sample workbook (.xlsx).
No account needed. MarketXLS live data requires a paid plan. Preview workbook
Explore more videos
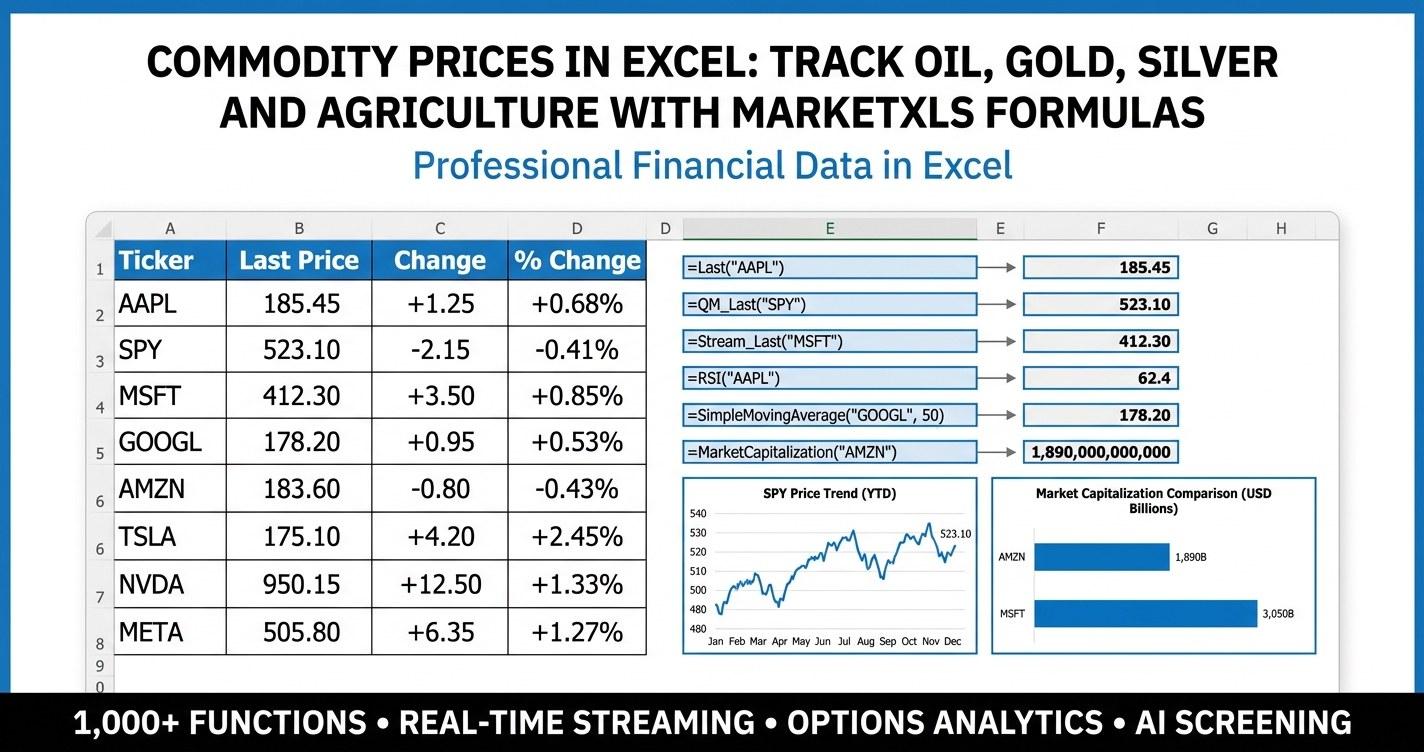
This guide covers 16 commodity ETFs across energy, precious metals, industrial metals, agriculture, and broad baskets, ties them to 15 commodity-linked stocks, and shows a scenario sheet that converts a commodity move into a dollar impact on your commodity sleeve. Two templates are linked below: a static snapshot from May 13, 2026 and a version with live MarketXLS formulas.
Why Track Commodity Prices in Excel
Tracking commodity prices in Excel lets you see, in one refreshing sheet, whether the stocks you hold are exposed to the commodity moves that matter to your thesis. Oil, gold, silver, natural gas, and copper each respond to different drivers (supply decisions, central bank buying, industrial demand, storage data), so a single sheet that lists them next to the equities they affect answers the exposure question without rebuilding the spreadsheet every quarter.
The Commodity Universe at a Glance
A useful commodity workbook covers the five main families: energy, precious metals, industrial metals, agriculture, and broad-basket products. The table below shows 16 ETFs that map cleanly to those families and that, importantly, trade with enough volume to give a usable daily price when you pull them into Excel.
| Ticker | Name | Family | Underlying | Expense Ratio |
|---|---|---|---|---|
| USO | United States Oil Fund | Energy | WTI Crude Oil | 0.79% |
| BNO | United States Brent Oil Fund | Energy | Brent Crude Oil | 1.00% |
| UNG | United States Natural Gas Fund | Energy | Henry Hub Natural Gas | 1.19% |
| GLD | SPDR Gold Shares | Precious Metals | Gold Bullion | 0.40% |
| IAU | iShares Gold Trust | Precious Metals | Gold Bullion | 0.25% |
| SLV | iShares Silver Trust | Precious Metals | Silver Bullion | 0.50% |
| PPLT | abrdn Physical Platinum Shares | Precious Metals | Platinum | 0.60% |
| PALL | abrdn Physical Palladium Shares | Precious Metals | Palladium | 0.60% |
| DBC | Invesco DB Commodity Tracking | Broad | Commodities Basket | 0.85% |
| GSG | iShares S&P GSCI Commodity Trust | Broad | GSCI Index | 0.75% |
| DBA | Invesco DB Agriculture Fund | Agriculture | Ag Basket | 0.91% |
| CORN | Teucrium Corn Fund | Agriculture | Corn Futures | 1.73% |
| WEAT | Teucrium Wheat Fund | Agriculture | Wheat Futures | 2.22% |
| SOYB | Teucrium Soybean Fund | Agriculture | Soybean Futures | 2.03% |
| CPER | United States Copper Index Fund | Industrial Metals | Copper Futures | 1.88% |
| DBB | Invesco DB Base Metals Fund | Industrial Metals | Base Metals Basket | 0.78% |
This is the universe the linked template tracks. You can extend it with country-specific or strategy-specific products, but these sixteen tickers cover the major commodity families.
Why ETFs Instead of Futures Symbols
Commodity ETFs are easier to track in Excel than futures because ETF prices are continuous, available on standard equity feeds, and free of contract rollovers. Futures prices are the actual benchmark, but a raw futures series has to be spliced every time a contract expires. A workbook that uses USO as the WTI proxy and GLD as the gold proxy gets a dependable price every single trading day, with no manual splicing required.
There is a small tracking-error cost. USO does not perfectly mirror WTI because of roll costs in the futures market it holds, and the same is true for any commodity ETF that uses futures rather than physical storage. The day-to-day direction usually matches the underlying, which is enough for portfolio-level tracking.
If you need a spot benchmark, MarketXLS has =CrudeOilPrice() and =NaturalGasPrice(), which return daily spot prices from EIA data via FRED. ETF tickers remain the simpler starting point for an intraday commodity dashboard.
Pulling Commodity Prices Into Excel: The Core Formulas
MarketXLS treats commodity ETFs the same as any other ticker, so the standard quote and technical functions work on them. With the MarketXLS add-in active and logged in, the formulas below return values into your worksheet. On Mac or Excel for the web (the Microsoft 365 add-in), add the mxls. prefix, for example =mxls.Last("USO").
=QM_Last("USO")                       Last traded price for WTI crude proxy
=QM_Last("GLD")                       Last traded price for gold proxy
=QM_Last("SLV")                       Last traded price for silver proxy
=QM_Last("UNG")                       Last traded price for natural gas proxy
=QM_Last("CPER")                      Last traded price for copper proxy
=QM_Last("DBA")                       Last traded price for agriculture basket
=SimpleMovingAverage("USO","50")      50-day SMA on the crude proxy
=SimpleMovingAverage("GLD","200")     200-day SMA on the gold proxy
=RelativeStrengthIndex("SLV","14")    14-period RSI on silver
=Beta("USO")                          Beta vs broad market
=FiftyTwoWeekHigh("GLD")              52-week high for gold proxy
=FiftyTwoWeekLow("UNG")               52-week low for natural gas proxy
=MarketCapitalization("GLD")          ETF AUM proxy
=QM_GetHistory("USO")                 Historical OHLCV spill for crude
=QM_Stream_Last("USO")                Streaming price (Advanced and Business plans)
Formula documentation: QM_Last, SimpleMovingAverage, RelativeStrengthIndex, Beta, FiftyTwoWeekHigh, FiftyTwoWeekLow, MarketCapitalization, QM_GetHistory, QM_Stream_Last
A few practical notes. QM_Last returns a snapshot of the latest trade that updates when Excel recalculates (15-minute delayed on Standard, real-time on Advanced and Business). QM_Stream_Last updates automatically while streaming is on. SimpleMovingAverage and RelativeStrengthIndex take the lookback period as the second argument. QM_GetHistory spills an entire OHLCV table starting from the cell it lives in, so leave room below and to the right for the data to land.
The Commodity ETF Dashboard
The first sheet of the template is the dashboard. It lists every ETF from the table above, with QM_Last, 50-day and 200-day SMAs, 14-period RSI, beta, 52-week high and low, and market cap as live formulas. Three yellow input cells at the top hold your portfolio size, your target commodity allocation as a percent, and a freeform risk tolerance label. Those inputs flow through to the scenario sheet later in the workbook.
Looking at the dashboard with end-of-day data for May 13, 2026, a few patterns jump out. Energy is trading above both moving averages, with USO and BNO showing RSI in the high fifties - constructive but not overbought. Natural gas (UNG) tells the opposite story: price below both moving averages, RSI in the high thirties, classic mean-reversion setup if you are inclined to fade extremes. Precious metals are uniformly strong, with GLD, IAU, and SLV all printing 60-plus RSI and trading well above 200-day SMA. Copper (CPER) and base metals (DBB) are both in clear uptrends, while palladium (PALL) is the lone laggard, sitting below its 50-day with RSI in the low forties.
The reason this view matters is that it lets you see at a glance whether your equity positions are aligned with the commodity tape. If you are heavy energy and oil is rolling over, the dashboard will show RSI fading and the 50-day flattening before your equity P/L tells you the same story.
Tying Commodity Prices to Commodity Equities
Commodity prices become more useful when they sit next to the equities they drive. The watchlist sheet in the template covers 15 commodity-linked stocks across energy, mining, and agriculture. Each row pulls live data through MarketXLS:
=QM_Last("XOM")            Last price for Exxon Mobil
=DividendYield("XOM")      Trailing dividend yield
=PERatio("XOM")            Price to earnings ratio
=Beta("XOM")               Beta vs broad market
=Sector("XOM")             Sector classification
=Industry("XOM")           Industry classification
Formula documentation: QM_Last, DividendYield, PERatio, Beta, Sector, Industry
The watchlist also includes a "Commodity Exposure" label that maps each stock to the commodity that most influences its earnings. ExxonMobil maps to WTI crude. Newmont maps to gold. Freeport-McMoRan and Southern Copper map to copper. Archer Daniels Midland and Bunge map to grain processing economics. Nutrien and Mosaic map to fertilizer pricing, which is itself a function of natural gas (a feedstock) and crop prices.
| Ticker | Sector | Commodity Exposure | Why It Matters |
|---|---|---|---|
| XOM | Energy | WTI Crude Oil | Integrated major; upstream cash flow scales with oil |
| CVX | Energy | WTI Crude Oil | Integrated major; downstream margins also matter |
| COP | Energy | WTI Crude Oil | Pure E&P; highest oil sensitivity in the group |
| SLB | Energy Services | WTI Crude Oil | Services revenue depends on E&P capex cycle |
| EOG | Energy | WTI Crude Oil | Shale producer; high oil leverage |
| NEM | Gold Mining | Gold Bullion | Largest gold miner by output |
| GOLD | Gold Mining | Gold Bullion | High operating leverage to gold price |
| AEM | Gold Mining | Gold Bullion | Lower-cost producer; strong free cash flow |
| FCX | Copper Mining | Copper | Largest US-listed copper miner |
| SCCO | Copper Mining | Copper | Pure-play; lowest-cost producer in the group |
| ADM | Agriculture | Grain Processing | Crush spreads, not flat commodity prices |
| NTR | Agriculture | Fertilizer | Potash and nitrogen pricing |
| MOS | Agriculture | Fertilizer | Phosphate and potash |
| DE | Ag Equipment | Farm Equipment | Lagged read on farm income |
| BG | Agriculture | Grain Processing | Similar dynamics to ADM |
The educational point here is that "commodity exposure" is not a single number. An oil producer benefits when crude rises. A refiner can suffer when crude rises faster than refined product prices. A fertilizer maker benefits when crops are expensive, because farmers buy more inputs, but suffers when natural gas (its feedstock) is expensive. A grain processor often does best when crop prices are stable, because crush margins are more predictable. The watchlist sheet lets you keep these distinctions visible side by side rather than hidden in a research note.
Scenario Analysis: What If Crude Moves 20%?
The scenario sheet converts a commodity price move into a dollar impact on your sleeve. Two yellow inputs - portfolio size and commodity allocation percent - drive the math. Three additional yellow inputs let you set the internal weights of your commodity sleeve across crude oil, gold, and broad commodities.
The sheet ships with five baseline scenarios:
| Scenario | Crude Oil | Gold | Broad | Notes |
|---|---|---|---|---|
| Inflation Surge | +20% | +15% | +16% | USD weak, real assets bid across the board |
| Geopolitical Shock | +30% | +18% | +20% | Oil supply premium plus safe-haven flows |
| Soft Landing | +5% | +4% | +5% | Modest gains; real rates stable |
| Recession | -18% | -5% | -12% | Industrial demand falls; gold cushions |
| Deflation / Hard Landing | -25% | -10% | -20% | Broad drawdown; precious metals less negative |
The weighted return formula multiplies each commodity scenario by your sleeve weights and then by the dollar allocation. With a $100,000 portfolio, a 10% commodity allocation, and the default 30/40/30 weights across crude, gold, and broad, an "Inflation Surge" scenario shows roughly a $1,690 impact on the sleeve. A "Recession" scenario shows roughly a $1,070 loss. You can change the inputs and watch the numbers rerun instantly.
This is exactly the kind of stress test that is hard to do in a research report and easy to do in a spreadsheet. The point is not to predict which scenario will play out - the point is to see how much of your portfolio's downside (and upside) is concentrated in the commodity sleeve before something happens, not after.
Building a Historical Tracker With QM_GetHistory
The historical tracker sheet uses QM_GetHistory to spill a full OHLCV table for whichever ETF you put in the symbol input cell. That single formula gives you everything you need to build a custom moving average, run a drawdown analysis, compute a custom volatility figure, or feed a chart.
A worked example: drop "USO" into the symbol cell, refresh, and you get every daily bar in the lookback window. From there:
=AVERAGE(<close column>)           Average price over the window
=STDEV(<close column>)             Realized volatility (raw)
=MAX(<close column>)               Period high
=MIN(<close column>)               Period low
=CORREL(<USO returns>, <GLD returns>)   Cross-commodity correlation
That last one is the foundation of the correlation matrix sheet. With QM_GetHistory pulled for USO, GLD, SLV, DBC, DBA, and CPER, a 6 by 6 matrix of CORREL formulas tells you which commodities behave alike. In practice, gold and silver are tightly correlated, oil and broad-basket products move together, and precious metals are notably uncorrelated with crude. That is the diversification math behind a balanced commodity sleeve.
The Approach: Building a Sleeve, Not a Bet
A common mistake when adding commodities to a portfolio is to think of them as a single trade - "I am bullish oil" or "I want some gold exposure." Treated that way, commodities tend to either dominate returns when they work or generate persistent drag when they do not.
A better educational frame is to think of the commodity allocation as a sleeve with its own internal diversification, sized as a percent of the total portfolio. The dashboard, watchlist, and correlation sheets are designed to support that frame:
- Choose a sleeve size. Common ranges in long-only portfolios fall between 5% and 15%, depending on real-return objectives and inflation sensitivity. The exact number is an investor-specific judgment.
- Choose the internal mix. A roughly equal weight across an energy, a precious metals, and a broad-basket product gives a balanced read. A heavier gold weighting tilts the sleeve defensive. A heavier crude weighting tilts it cyclical.
- Rebalance on a schedule. Commodities are volatile. Letting the sleeve drift means the highest performer ends up dominating. Quarterly or semi-annual rebalancing back to target weights captures volatility without overtrading.
- Decide on equity overlap. If you already hold meaningful positions in commodity-linked equities (energy majors, gold miners), you may want a smaller dedicated commodity sleeve since you already have some commodity beta.
This is an educational framework, not a recommendation. The numbers will look different for every investor. The point is to have a structure - the workbook supports any structure you choose.
The Templates
Two files are linked below. The first is a static snapshot taken with end-of-day data on May 13, 2026, useful as a reference for what each cell should look like once formulas resolve. The second is the live template with MarketXLS formulas wired into every row - drop it into Excel with the MarketXLS add-in active and the numbers refresh automatically.
Download the templates:
- - Pre-filled with current data and formula reference cells
- - Live-updating formulas across all six sheets
Both files include the same six-sheet structure:
| Sheet | Contents |
|---|---|
| How To Use | Workflow overview, links, and notes on each sheet |
| Commodity ETF Dashboard | 16 commodity ETFs with prices, SMAs, RSI, beta, AUM |
| Historical Commodity Tracker | Monthly closes for crude (USO) and gold (GLD) plus QM_GetHistory live spill |
| Commodity Equities Watchlist | 15 commodity-linked stocks with live yields, P/E, beta, sector |
| Scenario Analysis | Five commodity scenarios run against your portfolio inputs |
| Correlation Matrix | Cross-commodity correlation reference and live last prices |
Each sheet ends with a "MarketXLS Functions Used" box so you can see at a glance which formulas drive the cells above and how to extend the sheet for your own use.
FAQ: Commodity Prices in Excel
How do I get live oil prices in Excel?
The simplest way is to use an ETF that tracks crude oil and pull the price with a MarketXLS formula. =QM_Last("USO") gives you the United States Oil Fund last price, which is the standard WTI proxy. =QM_Last("BNO") gives you the United States Brent Oil Fund last price for Brent crude. These prices refresh whenever the MarketXLS add-in refreshes the workbook. The same pattern works for any liquid commodity ETF.
Can MarketXLS pull spot commodity prices directly, or do I have to use ETFs?
MarketXLS can pull some spot prices directly. =CrudeOilPrice() returns the crude oil spot price and =NaturalGasPrice() returns the Henry Hub spot price, both updated daily from EIA data via FRED. For intraday tracking and for metals and agriculture, commodity ETFs via QM_Last are the practical route. The full function list is at /formulas.
How accurate are commodity ETF prices as a proxy for the underlying commodity?
Commodity ETFs usually track the direction of the underlying day to day. Long-term tracking error exists because most commodity ETFs hold futures contracts that must be rolled forward, and the cost of that roll (contango or backwardation) can pull the ETF away from spot over time. For day-to-day tracking, the proxy is usually adequate. For multi-year buy-and-hold exposure, the roll cost is a real consideration.
What is the difference between USO and BNO?
USO tracks WTI crude oil, which is the US benchmark priced at Cushing, Oklahoma. BNO tracks Brent crude oil, which is the global benchmark priced in the North Sea. WTI and Brent trade at a spread that varies based on US production levels, refinery demand, and pipeline capacity. If your portfolio has more exposure to US energy producers, USO is the relevant benchmark. If it has more international energy exposure, BNO matters more.
How do I track gold prices in Excel?
The two most liquid gold ETFs are GLD (SPDR Gold Shares) and IAU (iShares Gold Trust). Both hold physical bullion. GLD is larger, with the tighter spreads that come with scale; IAU has a lower expense ratio. Use =QM_Last("GLD") or =QM_Last("IAU") to pull the live price. The price moves should track each other almost identically since both are claims on physical gold.
Can I build correlation analysis between commodities in Excel?
Yes. Pull =QM_GetHistory("USO"), =QM_GetHistory("GLD"), and =QM_GetHistory("SLV") into separate ranges. Compute returns from the closing prices. Then use Excel's CORREL function pairwise across the return series. The correlation matrix sheet in the template walks through this workflow.
Do I need a separate data subscription for commodity prices?
No. A MarketXLS subscription includes the data used in this workbook: commodity ETF prices, historical bars, and the analytics functions. Plan choice affects speed: ETF quotes are 15-minute delayed on Standard ($70/month billed annually) and real-time streaming on Advanced and Business. See the MarketXLS pricing page for current plans.
The Bottom Line
Commodity prices in Excel are most useful as part of a system rather than isolated cells. A dashboard that pulls live prices through QM_Last, a watchlist that ties those prices to commodity-linked equities through DividendYield, PERatio, and Beta, a historical tracker driven by QM_GetHistory, and a scenario sheet that converts commodity moves into dollar impact on your sleeve: together those four views give you a coherent commodity workflow that does not require rebuilding when the next macro chapter starts.
The two templates linked above implement that system end to end. Open them in Excel with the MarketXLS add-in active and the numbers refresh on your schedule. Adjust the yellow input cells to fit your own portfolio size, allocation target, and sleeve weights. Add or remove tickers from the watchlist to match your real positions. The point is not to predict the next commodity move; the point is to see your exposure with enough clarity that the next move, whichever direction it goes, is not a surprise.
For the full function list, see MarketXLS formulas, or book a demo to see the full formula set in action.
This article is educational and does not constitute investment advice. Specific tickers and scenarios are referenced as examples for building an Excel workbook, not as buy or sell recommendations. Past performance does not guarantee future results.