
Welcome to the final part of our covered call series. In Article 1, you learned the core concepts of the strategy. In Article 2, you built a powerful screener to find the best trading opportunities. Now, you've entered a trade. What's next?
Execution is only half the battle. The most successful options traders differentiate themselves through diligent position management. This guide will teach you the operational side of covered calls: how to track your positions in real-time, when to close or adjust a trade, and the mechanics of rolling an option to maximize profits and manage risk.
We will build a comprehensive tracking spreadsheet in Excel, powered by MarketXLS, and introduce an advanced, holistic income strategy known as "The Wheel."
Why Tracking Matters: From Hobbyist to Professional
Simply placing a trade and waiting for it to expire is a passive approach that leaves money on the table. Professional traders track every detail because data-driven decisions outperform emotional ones.
A dedicated tracking spreadsheet helps you:
Monitor Real-Time Profit/Loss: Know the exact value of your positions at any moment, not just at expiration.
Analyze Performance: Calculate key metrics like your win rate, average return per trade, and total monthly income.
Identify What Works: Discover which underlying stocks and strategies are most profitable for you over time.
Make Proactive Decisions: Tracking provides the data needed to decide when to take profits early, cut losses, or roll a position for a better outcome.
Building a Covered Call Tracker in Excel
Let's create a dynamic dashboard to manage your covered call positions. This tracker will use live data from MarketXLS to give you a clear, up-to-the-minute view of your portfolio.
Step 1: Set Up Your Columns
Open a blank Excel sheet and create the following headers:
- Ticker: The stock symbol (e.g., MSFT).
- Shares: Number of shares owned (e.g., 100).
- Cost Basis/Share: The average price you paid for your shares.
- Option Symbol: The full option contract symbol.
- Strike: The option's strike price.
- Expiry: The option's expiration date.
- Premium/Share: The premium you received per share when you sold the option.
- Total Premium: The total premium received (Premium/Share * 100).
- Current Stock Price: (Dynamic)
- Current Option Price: (Dynamic)
- Stock P&L (Unrealized): (Calculated)
- Option P&L (Unrealized): (Calculated)
- Total P&L (Unrealized): (Calculated)
- % of Max Profit (Option): (Calculated)
Step 2: Integrate Live MarketXLS Data
Now, let's make the tracker dynamic.
In the "Current Stock Price" column, use the formula:
=stockPrice([Ticker Cell], "last")
In the "Current Option Price" column, use the formula:
=optionPrice([Option Symbol Cell], "last")
Step 3: Add the P&L Calculation Formulas
Stock P&L:
=([Current Stock Price] - [Cost Basis/Share]) * [Shares]
Option P&L:
=([Premium/Share] - [Current Option Price]) * [Shares]
(This formula works because your profit is the premium you received minus the current cost to buy the option back.)
Total P&L:
=[Stock P&L Cell] + [Option P&L Cell]
% of Max Profit (Option):
=[Option P&L Cell] / [Total Premium Cell]
(This metric is crucial for deciding when to close a trade early.)
When complete, your tracker will provide a powerful, real-time dashboard of all your positions.
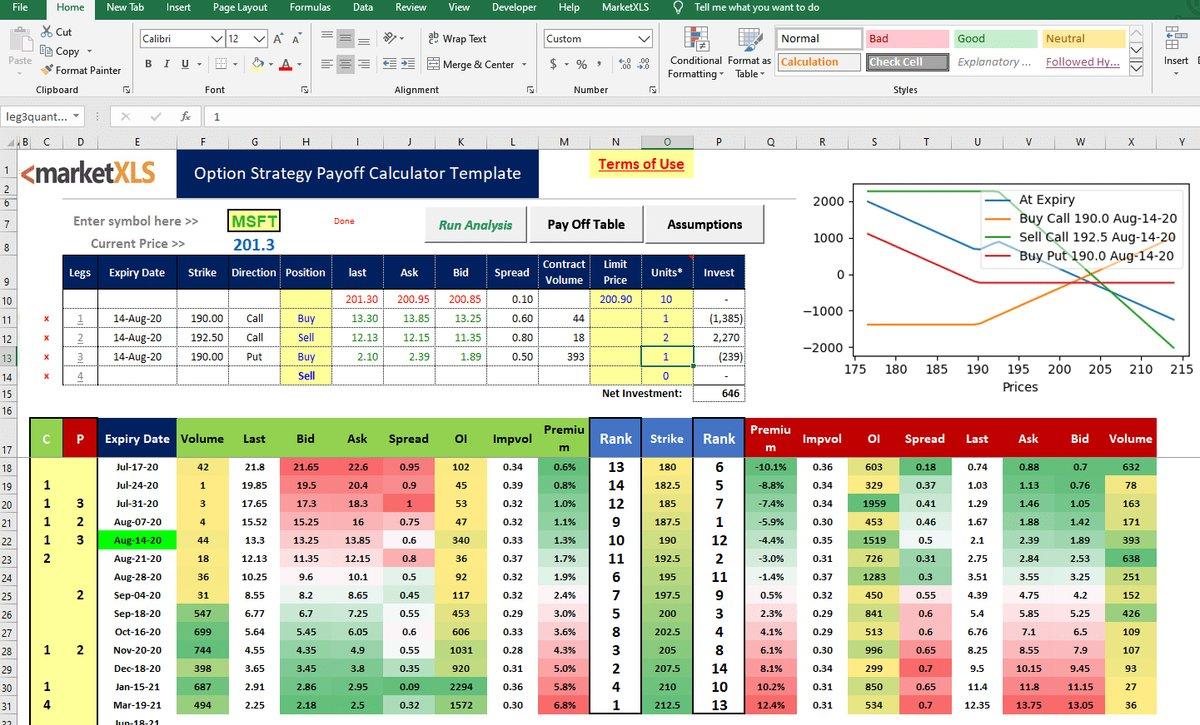
Option strategy calculator in Excel
Managing Your Positions: The Three Core Choices
Once your covered call trade is live, you have three primary paths you can take as expiration approaches.
1. Let the Option Expire Worthless
This is the ideal and most passive outcome. If the stock price remains below your strike price, the option expires worthless. You keep 100% of the premium you collected and your 100 shares, free to sell another call.
2. Close the Position Early
Often, the most profitable move is to lock in gains early. A common rule of thumb is to buy back the option to close the position when you have realized 50% of the maximum profit.
For example, if you sold a call for a $200 premium, you would place an order to buy it back for $100. This frees up your capital and eliminates the remaining risk of the trade for a handsome profit. Your tracker's "% of Max Profit" column makes spotting these opportunities easy.
3. Roll the Position
If the trade is challenged (stock price rises above your strike) or you wish to extend an income-producing position, you can "roll" the option.
The Art of Rolling a Covered Call
Rolling is a single transaction where you close your existing short call option and simultaneously open a new short call option with a different strike price, a later expiration date, or both. The goal is almost always to perform this action for a net credit, meaning you receive more money than you spend.
When to Roll a Position
The Stock Rises (Defensive Roll): Your stock is trading at or above the strike price, and you want to avoid having your shares called away. By rolling, you can "move" your obligation to a higher strike price and a later date, giving the stock more room to run while collecting more premium.
The Stock is Flat/Down (Income Roll): Your option is about to expire worthless, and you want to continue generating income from the position. You can roll to the same strike price at a later expiration date to collect another premium.
Rolling Mechanics
Rolling Out: Closing a call and opening a new one with the same strike price but a later expiration date. This is purely to collect more time premium.
Rolling Up: Closing a call and opening a new one with a higher strike price for the same expiration. This is less common and often results in a net debit.
Rolling Up and Out: This is the most common defensive roll. You close your current call and open a new one with both a higher strike price and a later expiration date. This allows you to collect a net credit, avoid assignment, and give your stock more room to appreciate.
Rolling Example:
You sold a 30-day call with a $50 strike for a $1.50 premium. The stock rises to $51, challenging your position. You could roll "up and out" by:
- Buying to Close your current $50 strike call (let's say it now costs $2.00).
- Selling to Open a new 60-day call with a $55 strike (let's say it pays a $2.50 premium).
Result: You receive a net credit of $0.50 ($2.50 - $2.00) and have successfully moved your obligation to a higher strike price, keeping the position alive.
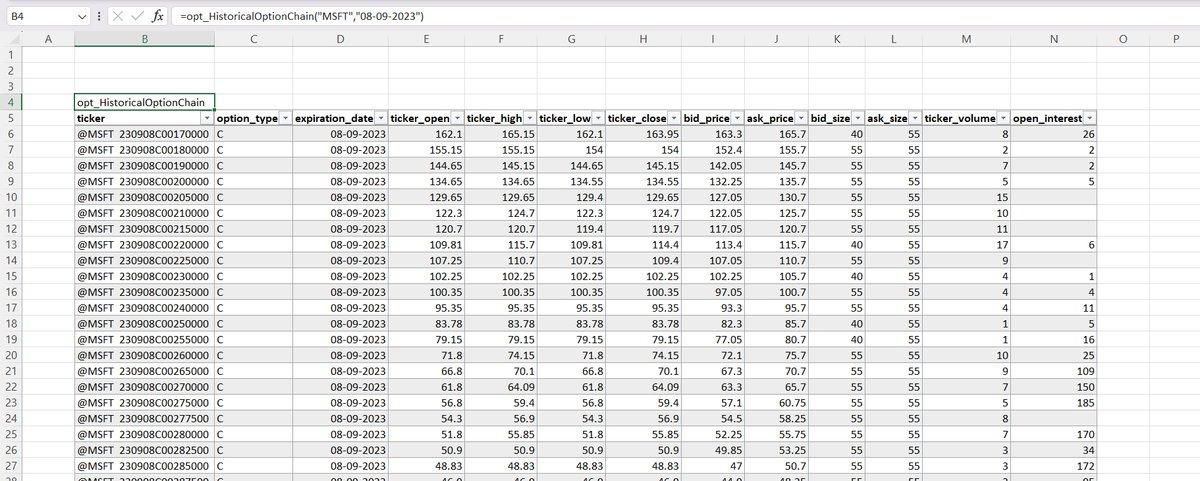
Excel tracking spreadsheet
Handling Assignment: It's Not a Failure, It's a Win
If your option is in-the-money at expiration, your shares will likely be called away. This is called assignment. For many new traders, this feels like a loss, but it isn't.
What Happens: Your broker automatically sells your 100 shares at the agreed-upon strike price, and the cash is deposited into your account.
The Reality: Assignment means you have achieved the maximum possible profit for the trade you entered. You realized gains on the stock up to the strike price plus you kept the entire option premium. This is a successful outcome.
Tax Perspective: This is a sale that realizes any capital gains on your stock.
What Next? If you still like the stock, you can simply buy back 100 shares. Or, you can move on to the next logical step in a holistic income strategy: selling a cash-secured put. This leads us to the Wheel.
Portfolio-Level Covered Call Management
Tracking Multiple Positions
As your covered call portfolio grows, you'll need to track multiple positions simultaneously. Here's how to scale your tracking:
Position Summary Dashboard:
- Total portfolio value
- Total open option premiums
- Overall portfolio Greeks
- Monthly income tracking
- Win/loss ratios
Correlation Considerations:
- Avoid having too many positions in the same sector
- Monitor overall portfolio beta
- Track concentration risk
Performance Analytics
Your Excel tracker should include these key performance metrics:
Win Rate Tracking:
=COUNTIF(Outcome_Column,"Win")/COUNTA(Outcome_Column)
Average Return Per Trade:
=AVERAGE(Return_Column)
Monthly Income Summary:
=SUMIF(Date_Column,">="&DATE(2024,1,1),Premium_Column)
Best Performing Underlyings: Use pivot tables to analyze which stocks generate the highest returns.
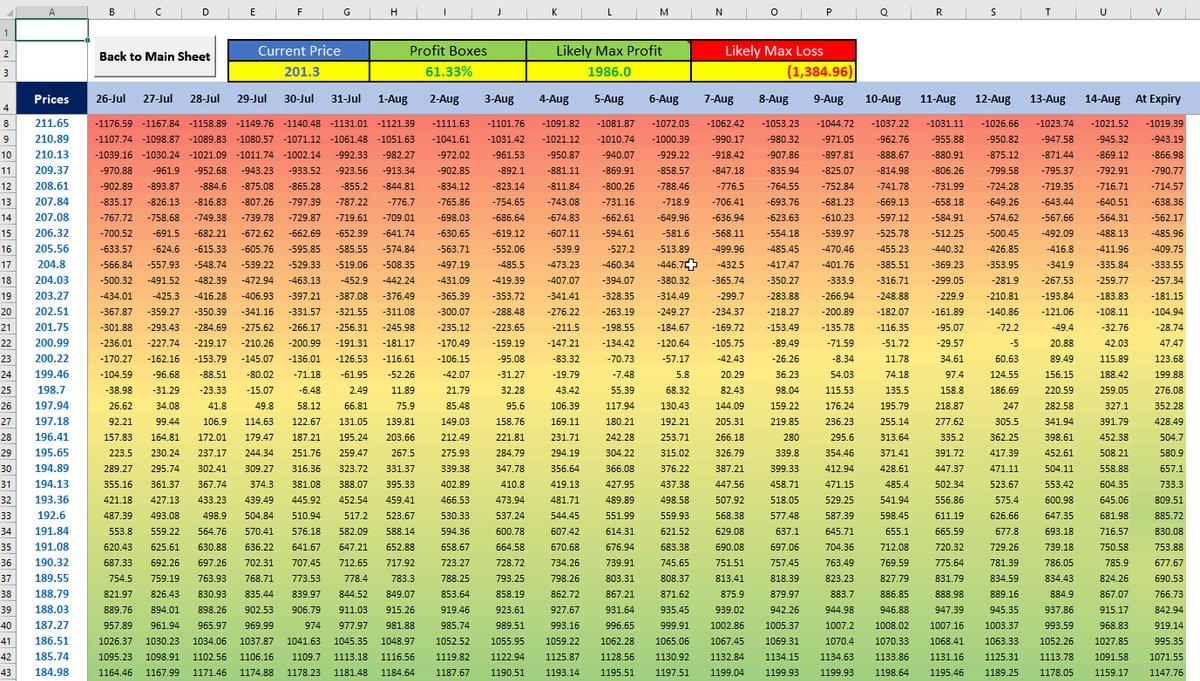
Options strategy tracking
Advanced Strategy: The Wheel
The Wheel Strategy is a cyclical income-generating system that combines cash-secured puts and covered calls. It's a powerful way to continuously generate premiums on high-quality stocks you want to own.
Here's how it works:
Phase 1: Sell a Cash-Secured Put (CSP)
You start with cash. You sell an OTM put on a stock you'd be happy to own at the strike price. You collect a premium. If the stock stays above the strike, the put expires worthless, you keep the premium, and repeat this step.
Phase 2: Get Assigned, Buy the Stock
If the stock drops below the strike, you are assigned and must buy 100 shares at the strike price. You now own the stock you wanted, and at a discount to where it was trading when you sold the put.
Phase 3: Sell Covered Calls
You now own 100 shares. You begin selling OTM covered calls against them, collecting premiums. You are now in the covered call phase of the strategy.
Phase 4: Get Assigned, Sell the Stock
If the stock rises and your shares get called away, you are back to having cash. You have realized a profit on the stock and collected multiple premiums along the way.
Phase 5: Repeat
You are now back at Step 1 with a larger pile of cash.
The Wheel is a robust strategy for systematically generating income from both puts and calls, turning assignment from an "end" into just another step in the cycle.
Building a Wheel Tracker
Your Wheel tracking spreadsheet should include:
Cash Position Tracking:
- Available cash for puts
- Cash tied up in assignments
- Total buying power
Full Cycle Analysis:
- Track complete wheel cycles from start to finish
- Calculate total return per complete cycle
- Monitor time in each phase
Assignment History:
- Track put assignments vs covered call assignments
- Analyze assignment rates by strike selection
- Monitor seasonal patterns
Real-World Management Scenarios
Scenario 1: Early Profit Taking
- Position: MSFT $350 call, 30 DTE, sold for $5.00
- Current: MSFT at $340, option worth $2.50
- Decision: Close at 50% max profit ($2.50 gain vs $5.00 max)
- Action: Buy to close at $2.50, profit $2.50/share
Scenario 2: Defensive Rolling
- Position: AAPL $180 call, 15 DTE, sold for $3.00
- Current: AAPL at $185, option worth $6.50
- Decision: Roll up and out to avoid assignment
- Action: Close $180 call at $6.50, sell $190 call 45 DTE for $8.00
- Result: Net credit of $1.50, higher strike, more time
Scenario 3: Assignment Management
- Position: TSLA $250 call, expired ITM
- Result: Shares called away at $250
- Analysis: Bought at $240, called at $250, plus $4 premium = $14/share profit
- Next Step: Either re-buy TSLA or sell puts to get back in
Advanced Rolling Strategies
The Roll Repair Strategy
When a covered call goes deep ITM, consider this approach:
- Close the challenged call
- Sell a put at the same strike to collect premium
- If assigned on the put, you now own 200 shares
- Sell 2 calls at higher strikes to repair the position
Income Maximization Rolling
For income-focused strategies:
- Always roll for a credit
- Target 30-45 DTE for optimal time decay
- Consider rolling down strikes in falling markets
- Stack multiple expirations for consistent income
Tax Implications and Record Keeping
Important Tax Considerations:
Assignment Records:
- Track acquisition dates for tax lot identification
- Monitor holding periods for long-term vs short-term gains
- Document wash sale rules compliance
Rolling Documentation:
- Each roll creates new tax lots
- Premium adjustments affect cost basis
- Keep detailed records of all adjustments
Recommended Spreadsheet Additions:
- Tax lot tracking
- Holding period calculations
- Wash sale monitoring
- Annual tax summary reports
FAQs
Q: What does "rolling for a credit" mean?
It means the premium you receive for selling the new option is greater than the cost of buying back your old option. This is the primary goal of rolling, as you are getting paid to extend or adjust your trade.
Q: Can my shares be assigned before the expiration date?
Yes. Most US stock options are "American style," which means they can be exercised by the buyer at any time before expiration. While rare for OTM or ATM options, early assignment can happen, especially on deep ITM calls right before an ex-dividend date.
Q: How does a stock dividend affect my covered call?
If your call option is in-the-money, the option holder may exercise their right to buy your stock before the ex-dividend date to capture the upcoming dividend payment. This is a primary reason for early assignment.
Q: Is the Wheel Strategy risky?
The primary risk is the same as owning stock. If you are assigned a stock via a cash-secured put and the stock price continues to fall dramatically, you could face significant unrealized losses. This is why the Wheel should only be used on high-quality companies you are comfortable holding long-term.
Q: How often should I check my covered call positions?
For active management, daily monitoring is recommended. However, avoid over-managing positions. Set alerts for key price levels and profit targets rather than constantly watching every move.
Q: What's the best profit-taking percentage for covered calls?
Many traders use the 50% rule: close positions when they've captured 50% of maximum profit. However, this can vary based on time to expiration and market conditions. Positions with less than 10 days to expiration might be held longer.
Master the Full Cycle of Trading
Congratulations! You have now journeyed from the basics of covered calls to the advanced operational tactics of active management. By tracking your trades, knowing when to adjust, and understanding the full lifecycle of a position, you can elevate your trading from a simple hobby to a consistent income-generating endeavor.
The strategies of managing, rolling, and tracking are what create long-term success. Use the MarketXLS templates and knowledge in this series to take full control of your options trading.
Download Our Professional Templates
Ready to implement these strategies? Download our comprehensive covered call tracking templates:
Covered Call Options Strategy Template - Complete Excel tracker with live MarketXLS data integration
Continue Your Options Education
Need to find your next trade? Revisit our guide on How to Find the Best Covered Calls: Excel Screening Guide.
Want a refresher on the fundamentals? Go back to the beginning with Covered Call Strategy Explained: Income Generation with MarketXLS.
This completes our comprehensive covered call series. You now have the complete toolkit to successfully implement, screen for, and manage covered call positions like a professional trader. The combination of systematic screening, disciplined tracking, and active management will set you apart from passive investors and help you generate consistent income from your stock portfolio.
