
Best covered calls are not simply the options with the highest premiums — they are strategically selected trades that balance income generation, downside protection, and your market outlook on the underlying stock. Finding the best covered call opportunities requires a systematic screening approach that evaluates stock quality, option liquidity, strike price selection, and return metrics. In our first guide, Covered Call Strategy Explained, you learned the fundamentals of what a covered call is, how it generates income, and its risk profile. Now, it is time to move from theory to practice. This comprehensive guide teaches you how to screen, select, and analyze the best covered call candidates using Excel and MarketXLS.
What Makes a "Good" Covered Call?
Before diving into a screener, you need to know what you are looking for. A "good" covered call is not simply the one with the highest premium. It is a strategic trade-off between income, risk, and your outlook on the underlying stock.
A high-quality covered call opportunity has four key ingredients:
A Quality Underlying Stock: You should only sell calls on stocks you are comfortable owning for the long term. The foundation of the strategy is your 100 shares, so their quality is paramount. Use MarketXLS to evaluate fundamentals:
=PERatio("AAPL")
=Revenue("AAPL")
=MarketCapitalization("AAPL")
=DividendYield("AAPL")
A Favorable Risk/Reward Balance: The premium should offer a reasonable return for the risk you are taking (capping your upside and retaining downside risk).
An Appropriate Strike Price: The strike price should align with your goals — whether that is maximizing income, increasing the probability of keeping your shares, or adding downside protection.
Sufficient Liquidity: The option must have enough trading activity (volume and open interest) to ensure you can enter and exit your position at a fair price with a narrow bid-ask spread.
Strike Selection Methodology: The Art and Science
Choosing the right strike price is arguably the most critical decision in a covered call trade. Your choice directly impacts your potential return, your level of risk, and the likelihood of having your shares called away. Let us break down the options: In-the-Money (ITM), At-the-Money (ATM), and Out-of-the-Money (OTM).
Out-of-the-Money (OTM)
Definition: The strike price is higher than the current stock price.
Best For: Investors who are moderately bullish and want to give the stock room to appreciate. The primary goal is to retain the shares while collecting a small amount of income.
Pros: Lower probability of assignment, allows for capital gains if the stock rises.
Cons: Receives the lowest premium.
At-the-Money (ATM)
Definition: The strike price is very close to the current stock price.
Best For: Investors who are neutral and believe the stock will trade sideways. The primary goal is to maximize premium income.
Pros: Generates the highest amount of time value premium.
Cons: Roughly a 50/50 chance of having your shares called away. Offers minimal downside protection and no room for stock appreciation.
In-the-Money (ITM)
Definition: The strike price is lower than the current stock price.
Best For: Investors who want to maximize downside protection or are looking to sell their shares at a specific price.
Pros: Offers the highest premium (though much of it is intrinsic value) and the most downside protection.
Cons: High probability of assignment. Caps any potential stock appreciation.
Using Delta to Refine Your Selection
A key option "Greek" to consider is Delta. For call options, Delta can be used as a rough estimate of the probability that the option will expire in-the-money.
- An OTM call with a 0.30 Delta has approximately a 30% chance of being assigned.
- An ATM call will have a Delta around 0.50.
- An ITM call will have a Delta above 0.50, approaching 1.00 the deeper in-the-money it is.
When screening, you can use Delta as a filter to find options that match your desired probability of assignment. MarketXLS provides Delta data through:
=QM_GetOptionQuotesAndGreeks("AAPL")
Best Covered Calls Screening Criteria Checklist
Here are the essential criteria to build into your covered call scanner:
| Screening Criteria | Recommended Range | Why It Matters |
|---|---|---|
| Stock Quality | Blue-chips, Dividend Aristocrats | Foundation of your position |
| Days to Expiration (DTE) | 30-45 days | Sweet spot for time decay |
| Open Interest | 100+ contracts minimum | Ensures liquidity |
| Bid-Ask Spread | Less than $0.10 | Fair entry/exit pricing |
| IV Rank/Percentile | Above 50th percentile | Higher premiums when IV is elevated |
| Static Return | 1-3% per month | Reasonable income target |
| Annualized Return | 8-15% | Benchmark for comparison |
| Delta | 0.20-0.40 (OTM strategy) | Matches assignment probability preference |
| Dividend Yield | Positive (optional) | Stack income sources |
You can check dividend information to find stocks that let you "stack" income from both dividends and option premium:
=DividendYield("KO")
=DividendPerShare("KO")
=DividendFrequency("KO")
Building a Covered Call Screener in Excel with MarketXLS
Now, let us build a functional and dynamic covered call screener. We will replicate the process an investor might use to find the best covered call to sell against their 100 shares of Apple ($AAPL).
Scenario: You own 100 shares of AAPL purchased at $117.70. The current price is $126.88. You are moderately bullish and want to find a call option expiring in the next few months with a strike price between $135 and $145.
Step 1: Get the Current Stock Price
Open Excel, enter your stock ticker: AAPL. Pull the current price:
=Last("AAPL")
Or for real-time streaming:
=QM_Last("AAPL")
Step 2: Pull the Option Chain
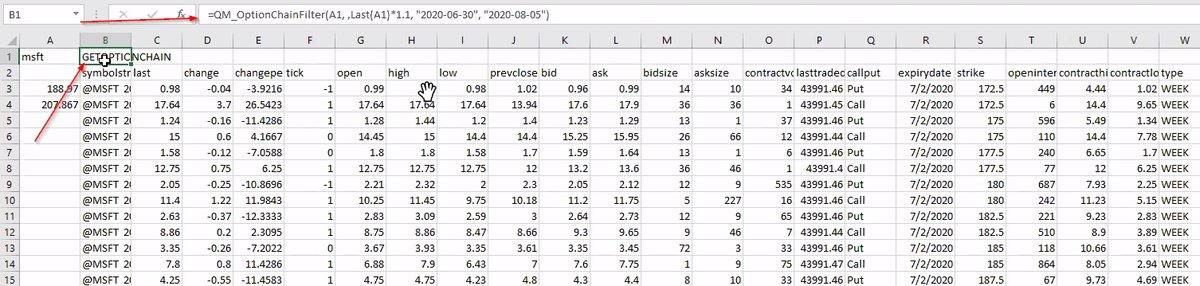
Use MarketXLS to get the full option chain:
=QM_GetOptionChain("AAPL")
This returns all available calls and puts with strikes, expirations, bid/ask prices, volume, open interest, and implied volatility.
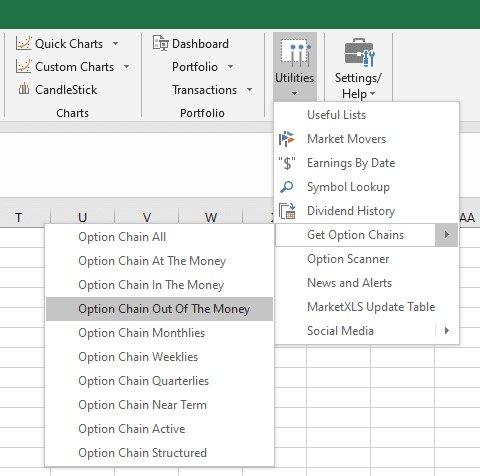
Alternatively, use the MarketXLS Option Scanner: Select the cell containing "AAPL", navigate to the MarketXLS tab on the Excel ribbon, click on Utilities, and select Option Scanner from the dropdown menu.
MarketXLS Option Scanner setup
Step 3: Filter the Option Chain
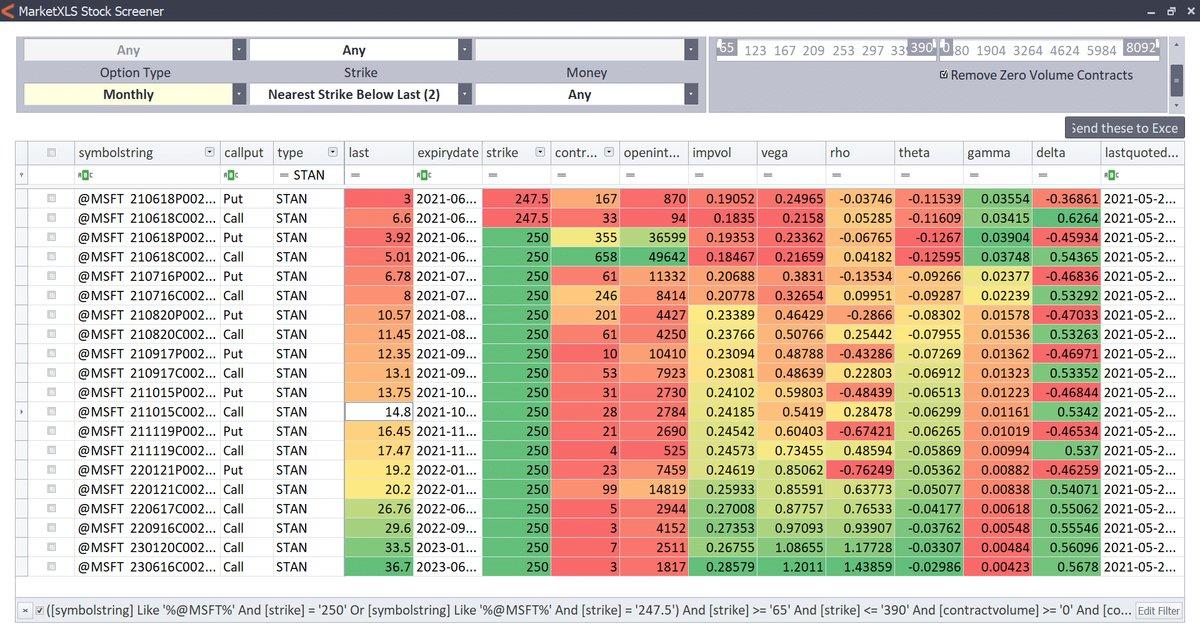
The Option Scanner window will appear. To narrow down the thousands of possible contracts, apply filters:
- In the "Calls or Puts" dropdown, select Calls.
- Click the Edit Filter button.
- Set the Strike Price range from a minimum of 135 to a maximum of 145.
Filter editor for option scanner
Step 4: Send the Data to Excel
Click the "Send these to Excel" button. MarketXLS will pull all the AAPL call options that meet your criteria directly into a new worksheet in your Excel file.
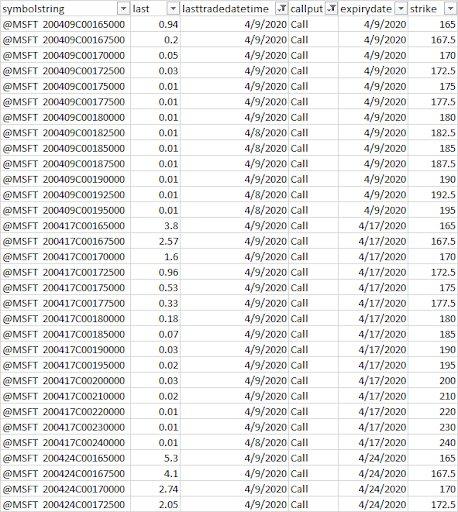
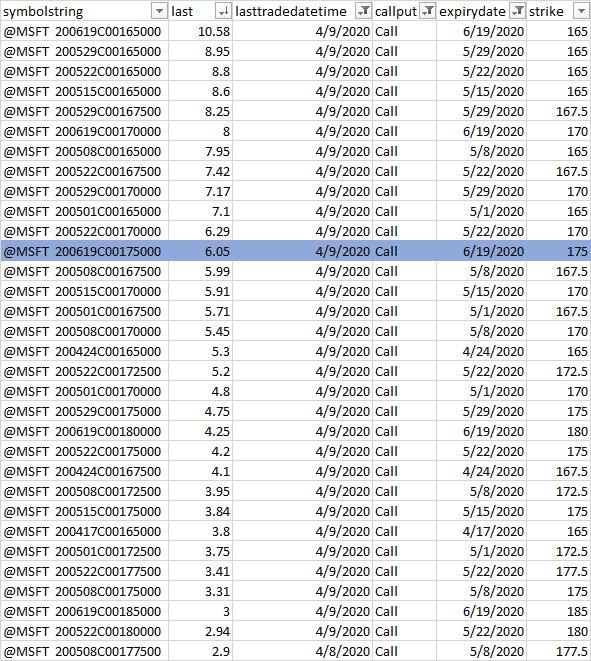
Option chain data
Step 5: Add Your Custom Calculation Columns
This is where the magic happens. We will add three new columns to the right of the imported data to analyze each option's potential return.
Days to Expiry: This column calculates the number of days until the option expires:
= [Expiry Date Cell] - TODAY()
Return: This calculates the total potential return if your shares get called away:
= ([Last Price Cell] * 100) / ([Your Acquisition Cost per Share] * 100)
(For our example, the acquisition cost is $117.70 per share or $11,770 total).
Annualized Return: This standardizes the return over a one-year period:
= ([Return Column Cell] / [Days to Expiry Cell]) * 365
Step 6: Analyze the Results
After adding these formulas, sort your table by Annualized Return from largest to smallest. Your spreadsheet should now look something like this:
Option chain with calculated fields
As expected, the options with the $135 strike price offer the highest annualized returns. This is because they are closest to the current stock price, carrying more risk of assignment, and thus command a higher premium.
However, our goal was to find a comfortable balance. Let us filter or scan down to the $140 strike price.
We can see several appealing options:
- 19Nov$140 Call: An excellent 8.38% annualized return, but it is six months away, tying up our shares for a long time.
- 15Oct$140 Call: A very solid 7.81% annualized return.
- 17Sep$140 Call: A respectable 7.39% annualized return.
For a covered call writer who averages around 6%, the 15Oct$140 call stands out. It offers an attractive premium ($3.60 per share, or $360 total) for a holding period of about four months. This trade meets our criteria: a quality stock, a comfortable strike price, and a compelling annualized return.
Final option selection
Once this template is built, you can save it. The next time you want to screen for opportunities, simply change the ticker, run the Option Scanner, paste in the new data, and your analysis columns will update automatically!
Best Stocks for Covered Calls
While you can write covered calls on any optionable stock you own, certain types of companies are better suited for this strategy.
Blue-Chip Stalwarts
Companies like Microsoft ($MSFT), Johnson & Johnson ($JNJ), and Apple ($AAPL) are popular because of their stability and liquidity. Premiums are reasonable, and catastrophic price drops are less likely. Check fundamentals:
=PERatio("MSFT")
=MarketCapitalization("MSFT")
=DividendYield("MSFT")
Dividend Aristocrats
Stocks like Coca-Cola ($KO) or Procter & Gamble ($PG) allow you to "stack" income: you collect the stock's dividend and the option premium. Be mindful that deep ITM calls can be assigned early right before an ex-dividend date.
=DividendYield("KO")
=DividendPerShare("KO")
Select High IV Stocks
For more aggressive investors, stocks in higher-volatility sectors can offer significantly larger premiums. This comes with higher risk but can be lucrative if managed correctly. Use MarketXLS to compare implied volatility across different stocks when screening for the best covered calls.
Monthly vs Weekly Covered Calls
| Feature | Monthly Options | Weekly Options |
|---|---|---|
| Premium Amount | Higher per trade | Lower per trade |
| Management | Less frequent | More active |
| Time Decay Benefit | Moderate | Aggressive |
| Transaction Costs | Lower (fewer trades) | Higher (more trades) |
| Capital Turnover | Monthly | Weekly |
| Event Risk | More exposure per period | Less per period |
| Best For | Long-term holders | Active traders |
| Income Frequency | 12x per year | 52x per year |
Monthly Options (Standard Expiration)
Pros:
- Higher premiums due to more time value
- Less frequent management required
- Better for long-term holders
Cons:
- Capital tied up for longer periods
- More exposure to unexpected news or events
- Lower frequency of income generation
Weekly Options (Weekly Expiration)
Pros:
- More frequent income opportunities
- Faster capital turnover
- Better for active traders
- Less time for unexpected events to impact position
Cons:
- Lower individual premiums
- Requires more active management
- Higher transaction costs due to frequency
Advanced: Optimizing for Yield vs Protection
When screening for the best covered calls, you face a fundamental trade-off between yield (income) and protection (downside buffer).
High-Yield Strategy (ATM/ITM strikes)
- Target Delta: 0.45-0.70
- Higher premiums but higher assignment probability
- Best in sideways/bearish markets
- Example: Selling ATM calls for maximum time premium
Protection-Focused Strategy (OTM strikes)
- Target Delta: 0.15-0.35
- Lower premiums but lower assignment probability
- Best in bullish markets where you want to keep shares
- Example: Selling 10-15% OTM calls for small income + upside participation
Balanced Approach
- Target Delta: 0.25-0.45
- Moderate premium with reasonable assignment probability
- Good for most market conditions
- Example: Selling 5-10% OTM calls
Rolling Covered Calls: When and How
Rolling is the process of closing your current covered call position and opening a new one. This is essential for managing best covered call positions over time.
When to Roll
- The stock has risen above your strike — roll up and out to avoid assignment while collecting more premium
- Expiration is approaching — roll to a new month to continue income generation
- The stock has dropped significantly — roll down to a lower strike for more premium (and lower breakeven)
How to Roll in Excel
- Close the existing position: note the cost to buy back the call
- Open a new position: use
=QM_GetOptionChain("AAPL")to find the next month's options - Calculate the net credit or debit of the roll
- Update your tracking spreadsheet with the new position
Rolling Comparison
| Roll Type | When to Use | Net Effect |
|---|---|---|
| Roll Out (same strike, later expiration) | Stock near strike at expiration | Collect more time premium |
| Roll Up and Out (higher strike, later expiration) | Stock above strike, want to keep shares | Higher cap on gains, more premium |
| Roll Down (lower strike, same/later expiration) | Stock has dropped significantly | More premium, lower breakeven |
Real Screening Examples: 5 Live Opportunities
Let us examine five covered call opportunities using our screening methodology:
Example 1: Microsoft (MSFT)
- Current Price: Use
=Last("MSFT")to get the current price - Suggested Strike: 5% OTM (30 DTE)
- Delta target: ~0.35
- Quality: Excellent blue-chip stock
- Dividend: Check
=DividendYield("MSFT")
Example 2: Johnson & Johnson (JNJ)
- Current Price: Use
=Last("JNJ") - Suggested Strike: 3% OTM (45 DTE)
- Delta target: ~0.30
- Quality: Dividend aristocrat, defensive
- Dividend: Check
=DividendYield("JNJ")
Example 3: Apple (AAPL)
- Current Price: Use
=Last("AAPL") - Suggested Strike: 5-8% OTM (30 DTE)
- Delta target: ~0.30-0.35
- Quality: Large-cap tech leader
- Option chain:
=QM_GetOptionChain("AAPL")
Example 4: Coca-Cola (KO)
- Current Price: Use
=Last("KO") - Suggested Strike: 3-5% OTM (60 DTE)
- Delta target: ~0.25
- Quality: Stable dividend payer, conservative
- Dividend: Check
=DividendYield("KO")and=DividendPerShare("KO")
Example 5: NVIDIA (NVDA)
- Current Price: Use
=Last("NVDA") - Suggested Strike: 7-10% OTM (30 DTE)
- Delta target: ~0.30-0.35
- Quality: High-growth tech, higher volatility = higher premiums
- Option chain:
=QM_GetOptionChain("NVDA")
Common Mistakes When Screening for Best Covered Calls
- Chasing the highest premium — Very high premiums usually mean very high risk. The stock may be volatile for a reason (earnings, FDA decision, etc.)
- Ignoring liquidity — Wide bid-ask spreads eat into your returns. Always check open interest and volume.
- Selling calls on stocks you do not want to own — The foundation of a covered call is stock ownership. If you would not buy the stock outright, do not sell calls on it.
- Not considering ex-dividend dates — ITM calls may be assigned early before an ex-dividend date, causing you to lose the dividend.
- Setting and forgetting — The best covered call writers actively manage their positions, rolling when appropriate.
- Using too short expirations — Weekly options can be tempting but require constant attention and generate more transaction costs.
Pricing and Getting Started with MarketXLS
To build your covered call screening workflow, you will need MarketXLS installed in Excel. MarketXLS provides all the functions demonstrated in this guide — from =Last() for stock prices to =QM_GetOptionChain() for full option chains and =DividendYield() for dividend analysis. Visit the MarketXLS pricing page to find the plan that fits your trading needs.
Frequently Asked Questions (FAQ)
Q: What is a good annualized return for a covered call?
This is subjective, but many experienced covered call writers aim for an annualized return of 8-15%. Returns above 20% often indicate significantly higher risk, either in the volatility of the underlying stock or a very aggressive strike price.
Q: Should I use the Bid, Ask, or Last price for my calculations?
The Last price is easy and automatically included by MarketXLS. However, for the most realistic analysis, using the Bid price is more conservative, as it represents the price you could likely sell the option for right now.
Q: What do "Open Interest" and "Volume" mean?
- Volume is the number of contracts traded today.
- Open Interest is the total number of outstanding contracts that have not been settled. High open interest is a better indicator of an option's liquidity than volume.
Q: How far out in time should I sell options?
Selling options with 30 to 45 Days to Expiration (DTE) is often considered the "sweet spot." This is because an option's time decay (Theta) accelerates significantly in the last 30-45 days, which benefits the option seller.
Q: Can I screen for covered calls on multiple stocks at once?
Yes! MarketXLS allows you to create watchlists and screen multiple tickers simultaneously. You can build a master spreadsheet that pulls option data for your entire portfolio of stocks using =QM_GetOptionChain() for each ticker.
Q: How often should I refresh my screening data?
For active trading, refresh your data daily or even intraday. For longer-term positions, weekly updates are usually sufficient. MarketXLS provides real-time data to keep your analysis current with =Stream_Last() for streaming prices.
Q: What is the best strike price for covered calls?
There is no single "best" strike — it depends on your goals. Use the Delta-based approach: 0.20-0.30 Delta for conservative (low assignment probability), 0.30-0.40 for balanced, and 0.40-0.50 for aggressive income generation.
Q: Can I write covered calls on dividend stocks?
Yes, and many traders prefer dividend stocks for covered calls because you can collect both the dividend and the option premium. However, be aware that deep ITM calls may be assigned early before ex-dividend dates. Check dividends with =DividendYield() and =DividendFrequency().
Now, Let Us Manage the Trade
You have learned how to move from theory to a list of actionable trade ideas. By building a custom screener in Excel with MarketXLS, you can systematically find the best covered call opportunities that fit your exact criteria.
Once you have entered a trade, the journey is not over. The next critical step is active management. Our next guide will teach you how to track, manage, and optimize your positions.
Continue to our final guide: Covered Call Management: Track, Roll & Optimize in Excel
Previous: ← Covered Call Strategy Explained
Get started with MarketXLS to build your covered call screening workflow today.
