

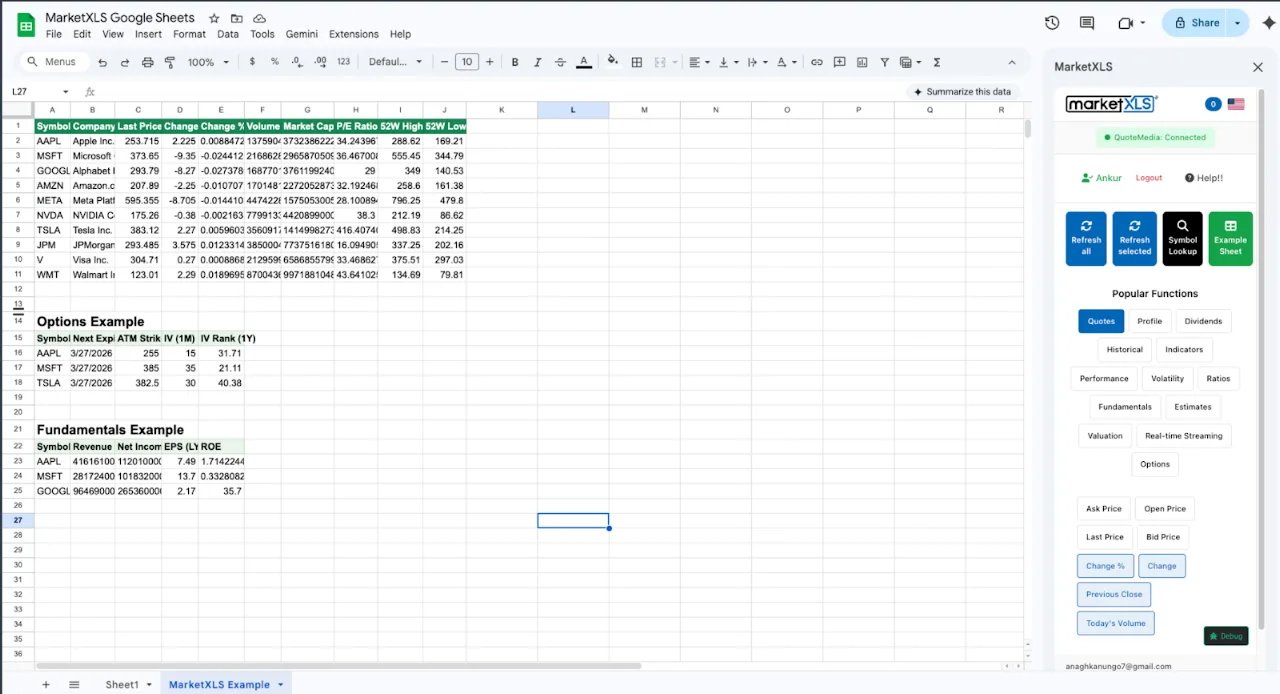
There is no public Google Finance API today: Google deprecated the original Finance API in 2012 and never replaced it. The only supported way to get Google Finance data is the GOOGLEFINANCE function in Google Sheets, for example =GOOGLEFINANCE("AAPL","price"), which returns prices delayed up to about 20 minutes, a short list of attributes, and daily history. It does not work in Excel and has no options data or technical indicators. For those, you need a data add-in or a paid API; MarketXLS, for example, adds formulas such as =Last("AAPL") to Excel and Google Sheets.
This guide explains the GOOGLEFINANCE function attribute by attribute, its limitations, and the alternatives for Excel and Google Sheets.
Quick Comparison: Spreadsheet Financial Data Methods
| Method | Real-Time Data | Historical Data | Options Data | Fundamentals | Free | Platform |
|---|---|---|---|---|---|---|
| GOOGLEFINANCE (Sheets) | No (15-20 min delay) | Limited | No | Basic | Yes | Google Sheets |
| Excel Stocks Data Type | No (delayed) | No | No | Basic | Yes (M365) | Excel |
| Alpha Vantage API | No (delayed free) | Yes | No | Limited | Yes (limited) | Any (code needed) |
| Polygon.io API | Yes (paid) | Yes | Yes | Limited | Yes (limited) | Any (code needed) |
| MarketXLS | Advanced/Business plans (=QM_Stream_Last); Standard 15-min delayed | Yes (=QM_GetHistory) | Yes (=QM_GetOptionChainActive) | Extensive (1000+ formulas) | No (see pricing) | Excel and Google Sheets |
What Is Google Finance API?
Google Finance API is a term that generates significant confusion, so let us clarify the three distinct things people mean when they search for it:
1. The Original Google Finance API (Dead Since 2012)
Google once offered an official Finance API as part of the Google Data APIs (GData) suite. Developers could make REST API calls to retrieve stock quotes, portfolio data, and financial information programmatically. Google deprecated this API in October 2012 as part of a broader shutdown of several GData APIs. It has never been restored, and Google has shown no indication of reviving it.
2. The GOOGLEFINANCE() Function in Google Sheets
This is what most people are actually looking for when they search "Google Finance API." The GOOGLEFINANCE() function is built into Google Sheets and pulls stock data directly into spreadsheet cells. It is free, it works without any API key or setup, and it provides basic market data for stocks, currencies, and indices.
3. Unofficial Scraping Methods
Some developers have built tools that scrape Google Finance search results or the Google Finance website for data. These methods are fragile, violate Google's terms of service, and should not be used for any serious application.
For the rest of this guide, we will focus primarily on the GOOGLEFINANCE() function since it is the only officially supported way to access Google's financial data.
The GOOGLEFINANCE Function: Complete Reference
The GOOGLEFINANCE function in Google Sheets uses this syntax:
=GOOGLEFINANCE(ticker, [attribute], [start_date], [end_date|num_days], [interval])
Current Data Attributes
| Attribute | Example | Description |
|---|---|---|
| "price" | =GOOGLEFINANCE("AAPL", "price") | Current price (delayed) |
| "priceopen" | =GOOGLEFINANCE("AAPL", "priceopen") | Opening price |
| "high" | =GOOGLEFINANCE("AAPL", "high") | Day's high |
| "low" | =GOOGLEFINANCE("AAPL", "low") | Day's low |
| "volume" | =GOOGLEFINANCE("AAPL", "volume") | Trading volume |
| "marketcap" | =GOOGLEFINANCE("AAPL", "marketcap") | Market capitalization |
| "tradetime" | =GOOGLEFINANCE("AAPL", "tradetime") | Last trade time |
| "datadelay" | =GOOGLEFINANCE("AAPL", "datadelay") | Data delay in minutes |
| "volumeavg" | =GOOGLEFINANCE("AAPL", "volumeavg") | Average daily volume |
| "pe" | =GOOGLEFINANCE("AAPL", "pe") | P/E ratio |
| "eps" | =GOOGLEFINANCE("AAPL", "eps") | Earnings per share |
| "high52" | =GOOGLEFINANCE("AAPL", "high52") | 52-week high |
| "low52" | =GOOGLEFINANCE("AAPL", "low52") | 52-week low |
| "change" | =GOOGLEFINANCE("AAPL", "change") | Price change |
| "changepct" | =GOOGLEFINANCE("AAPL", "changepct") | Change percentage |
| "closeyest" | =GOOGLEFINANCE("AAPL", "closeyest") | Yesterday's close |
| "shares" | =GOOGLEFINANCE("AAPL", "shares") | Shares outstanding |
| "currency" | =GOOGLEFINANCE("AAPL", "currency") | Trading currency |
Historical Data
=GOOGLEFINANCE("AAPL", "close", DATE(2025,1,1), DATE(2025,12,31), "DAILY")
This returns a table of historical closing prices. The interval parameter accepts "DAILY" or "WEEKLY."
Currency Exchange Rates
=GOOGLEFINANCE("CURRENCY:EURUSD")
=GOOGLEFINANCE("CURRENCY:GBPUSD")
=GOOGLEFINANCE("CURRENCY:USDJPY")
Mutual Funds
=GOOGLEFINANCE("MUTF:VFIAX", "price")
GOOGLEFINANCE Limitations That Frustrate Professionals
While the GOOGLEFINANCE function works for basic use, it has significant limitations that drive professionals to seek alternatives:
Limitation 1: Data Is Always Delayed
GOOGLEFINANCE data is delayed by 15-20 minutes during market hours. There is no way to get real-time quotes. For casual investors checking prices once a day, this is fine. For anyone making time-sensitive decisions, the delay is unacceptable.
MarketXLS alternative: =Last("AAPL") provides current prices (15-minute delayed on the Standard plan), and =QM_Stream_Last("AAPL") streams real-time prices on the Advanced and Business plans.
Limitation 2: No Options Data
GOOGLEFINANCE provides zero options data - no chains, no Greeks, no implied volatility, no open interest. For options traders and income investors who sell covered calls or cash-secured puts, this is a deal-breaker.
MarketXLS alternative: =QM_GetOptionChainActive("AAPL") returns the complete active option chain with all strikes, expirations, prices, volume, open interest, and Greeks.
Limitation 3: Extremely Limited Fundamentals
GOOGLEFINANCE offers only P/E ratio and EPS for fundamental data. No revenue, no profit margins, no return on equity, no debt ratios, no dividend details beyond basic yield. Building any meaningful fundamental analysis is impossible with GOOGLEFINANCE alone.
MarketXLS alternatives:
=PERatio("AAPL")                 P/E ratio
=EarningsPerShare("AAPL")        EPS
=Revenue("AAPL")                 Revenue
=GrossProfit("AAPL")             Gross profit
=OperatingMargin("AAPL")         Operating margin
=ReturnOnEquity("AAPL")          Return on equity
=TotalDebtToEquity("AAPL")       Debt-to-equity ratio
=Current_Ratio("AAPL")           Current ratio
=BookValuePerShare("AAPL")       Book value per share
=NetProfitMargin("AAPL")         Net profit margin
=PriceToBook("AAPL")             Price-to-book
=PriceToSales("AAPL")            Price-to-sales
Formula documentation: PERatio, EarningsPerShare, Revenue, GrossProfit, OperatingMargin, ReturnOnEquity, TotalDebtToEquity, Current_Ratio, BookValuePerShare, PriceToBook, PriceToSales
Limitation 4: No Technical Indicators
GOOGLEFINANCE provides no technical analysis tools - no RSI, no moving averages, no Bollinger Bands, no MACD. You would need to calculate these manually from historical price data, which requires significant spreadsheet engineering.
MarketXLS alternatives:
=RSI("AAPL")                          RSI (14-period)
=SimpleMovingAverage("AAPL", 50)      50-day SMA
=SimpleMovingAverage("AAPL", 200)     200-day SMA
=Beta("AAPL")                         Beta vs market
=AverageTrueRange("AAPL")             Average true range
Formula documentation: RSI, SimpleMovingAverage, Beta, AverageTrueRange
Limitation 5: Unreliable Updates
GOOGLEFINANCE sometimes stops updating for extended periods. Google does not guarantee data availability or accuracy, and there is no SLA or support channel for data issues. Reports of the function returning #N/A errors or stale data are common in Google Sheets forums.
Limitation 6: No Dividend Details
Beyond basic yield (which is not even a supported attribute - you must calculate it from EPS and P/E), GOOGLEFINANCE provides no dividend data. No dividend per share, no ex-date, no pay date, no dividend history, no payout ratio.
MarketXLS alternatives:
=DividendYield("AAPL")                Dividend yield
=DividendPerShare("AAPL")             Annual dividend per share
=DividendPayoutRatio("AAPL")          Payout ratio
=DividendDate("AAPL")                 Ex-dividend date
=DividendPayDate("AAPL")              Payment date
=DividendHistory("AAPL")              Historical dividends
=DividendRate("AAPL")                 Indicated annual rate
=ConsecutivePeriodOfIncreasingDividendPayout("AAPL")  Dividend growth streak
Formula documentation: DividendYield, DividendPerShare, DividendPayoutRatio, DividendDate, DividendPayDate, DividendHistory, DividendRate, ConsecutivePeriodOfIncreasingDividendPayout
Limitation 7: Google Sheets Only
GOOGLEFINANCE works only in Google Sheets. If you use Microsoft Excel - which the vast majority of financial professionals do - GOOGLEFINANCE is simply not available. There is no equivalent built-in function in Excel.
MarketXLS solution: MarketXLS works in both Microsoft Excel and Google Sheets, providing the same formula-based data access regardless of your spreadsheet platform.
Google Finance API for Excel: Your Options
Since GOOGLEFINANCE does not work in Excel, professionals working in Microsoft Excel need alternative approaches:
Option 1: Excel's Built-in Stocks Data Type
Microsoft 365 includes a Stocks data type that provides basic company information. You type a company name or ticker, convert it to the Stocks type, and then extract specific fields.
Advantages: Built into Excel, no additional cost with M365 Limitations: Delayed data only, very limited field selection, no options data, no technical indicators, no historical data export, sometimes slow or unavailable
Option 2: Power Query with External APIs
Excel's Power Query can connect to REST APIs to fetch financial data. You could connect to Alpha Vantage, Polygon.io, or similar APIs.
Advantages: Powerful data transformation capabilities Limitations: Requires API knowledge, data does not auto-refresh in real-time, complex setup for each data source, rate limits apply
Option 3: MarketXLS
MarketXLS adds GOOGLEFINANCE-style data, and more, to Excel through formulas:
=Last("AAPL")                    Current price (real-time on Advanced/Business plans)
=PERatio("AAPL")                 P/E ratio
=RSI("AAPL")                     RSI (not available in GOOGLEFINANCE)
=QM_GetOptionChainActive("AAPL") Full option chain (not available)
=DividendYield("AAPL")           Dividend yield
=QM_GetHistory("AAPL")           Historical data
Formula documentation: Last, PERatio, RSI, QM_GetOptionChainActive, DividendYield, QM_GetHistory
With 1000+ functions covering equities, options, fundamentals, technicals, dividends, and macroeconomic data, MarketXLS covers the GOOGLEFINANCE attributes plus fundamentals, options and technical indicators.
Google Finance API vs MarketXLS: Detailed Comparison
| Capability | GOOGLEFINANCE (Google Sheets) | MarketXLS (Excel + Google Sheets) |
|---|---|---|
| Current Price | =GOOGLEFINANCE("AAPL","price") - delayed | =Last("AAPL") - current |
| Streaming Price | Not available | =QM_Stream_Last("AAPL") (Advanced/Business) |
| P/E Ratio | =GOOGLEFINANCE("AAPL","pe") | =PERatio("AAPL") |
| Revenue | Not available | =Revenue("AAPL") |
| Operating Margin | Not available | =OperatingMargin("AAPL") |
| Return on Equity | Not available | =ReturnOnEquity("AAPL") |
| Debt/Equity | Not available | =TotalDebtToEquity("AAPL") |
| RSI | Not available | =RSI("AAPL") |
| Moving Average | Not available | =SimpleMovingAverage("AAPL",50) |
| Beta | =GOOGLEFINANCE("AAPL","beta") | =Beta("AAPL") |
| Option Chain | Not available | =QM_GetOptionChainActive("AAPL") |
| Implied Volatility | Not available | =ImpliedVolatility("AAPL") |
| Dividend Yield | Not directly available | =DividendYield("AAPL") |
| Dividend History | Not available | =DividendHistory("AAPL") |
| Historical Prices | =GOOGLEFINANCE("AAPL","close",start,end) | =QM_GetHistory("AAPL") |
| Macro Data | Not available | =CrudeOilPrice(), 50+ macro functions |
| Total Functions | ~18 attributes | 1000+ functions |
| Platforms | Google Sheets only | Excel + Google Sheets |
| Data Freshness | 15-20 min delay | 15-min delayed (Standard); real-time streaming (Advanced, Business) |
Building a Professional Financial Dashboard
Here is how to build a comprehensive financial dashboard that goes far beyond what GOOGLEFINANCE can deliver:
Dashboard Section 1: Market Overview
Index         Price              Change
S&P 500       =Last("SPY")       =ChangeInPercent("SPY")
NASDAQ        =Last("QQQ")       =ChangeInPercent("QQQ")
Dow           =Last("DIA")       =ChangeInPercent("DIA")
Russell 2000  =Last("IWM")       =ChangeInPercent("IWM")
VIX           =Last("VIX")
Oil           =CrudeOilPrice()
Formula documentation: Last, ChangeInPercent, CrudeOilPrice
Dashboard Section 2: Watchlist
| Ticker | Price | Change% | P/E | Div Yield | RSI | Beta | 52W High | 52W Low |
|---|---|---|---|---|---|---|---|---|
| AAPL | =Last("AAPL") | =ChangeInPercent("AAPL") | =PERatio("AAPL") | =DividendYield("AAPL") | =RSI("AAPL") | =Beta("AAPL") | =FiftyTwoWeekHigh("AAPL") | =FiftyTwoWeekLow("AAPL") |
Dashboard Section 3: Fundamental Screen
Build a custom stock screener:
=IF(AND(PERatio(A2)<20, DividendYield(A2)>2, RSI(A2)<70), "WATCH", "PASS")
Formula documentation: PERatio, DividendYield, RSI
This kind of multi-factor screening is impossible with GOOGLEFINANCE alone because it lacks RSI and comprehensive dividend data.
Dashboard Section 4: Sector Analysis
Compare sector performance using ETFs:
| Sector | ETF | Price | Change% | P/E | Yield |
|---|---|---|---|---|---|
| Technology | XLK | =Last("XLK") | =ChangeInPercent("XLK") | =PERatio("XLK") | =DividendYield("XLK") |
| Healthcare | XLV | =Last("XLV") | =ChangeInPercent("XLV") | =PERatio("XLV") | =DividendYield("XLV") |
| Financials | XLF | =Last("XLF") | =ChangeInPercent("XLF") | =PERatio("XLF") | =DividendYield("XLF") |
| Energy | XLE | =Last("XLE") | =ChangeInPercent("XLE") | =PERatio("XLE") | =DividendYield("XLE") |
| Consumer Staples | XLP | =Last("XLP") | =ChangeInPercent("XLP") | =PERatio("XLP") | =DividendYield("XLP") |
Making the Most of GOOGLEFINANCE (When It Is Enough)
If your needs are truly basic and you are committed to Google Sheets, here are tips for getting the most out of GOOGLEFINANCE:
Tip 1: Use Named Ranges for Tickers
Instead of hardcoding tickers in every formula, create a list of tickers and reference them:
A1: AAPL
B1: =GOOGLEFINANCE(A1, "price")
C1: =GOOGLEFINANCE(A1, "pe")
D1: =GOOGLEFINANCE(A1, "marketcap")
Tip 2: Handle Errors Gracefully
GOOGLEFINANCE frequently returns #N/A or #REF! errors. Wrap formulas in IFERROR:
=IFERROR(GOOGLEFINANCE("AAPL", "price"), "Data unavailable")
Tip 3: Create a Historical Price Chart
Use GOOGLEFINANCE with the SPARKLINE function for inline charts:
=SPARKLINE(GOOGLEFINANCE("AAPL", "close", TODAY()-90, TODAY(), "DAILY"))
Tip 4: Monitor Currency Pairs
GOOGLEFINANCE handles currency data well:
=GOOGLEFINANCE("CURRENCY:EURUSD")
=GOOGLEFINANCE("CURRENCY:GBPJPY")
Tip 5: Set Up a Refresh Schedule
Google Sheets refreshes GOOGLEFINANCE data periodically, but you can force a refresh by editing any cell. Some users create a script that modifies a hidden cell on a schedule to trigger refreshes.
Download Google Finance API Alternative Excel Templates
We have built two Excel templates that demonstrate the difference between GOOGLEFINANCE limitations and professional MarketXLS capabilities:
Download the templates:
- - Pre-filled with current data as of April 2026
- - Live-updating formulas
The templates include:
- How To Use - Setup guide and GOOGLEFINANCE vs MarketXLS comparison
- Main Dashboard - Market overview with comprehensive data points
- Scenario Analysis - What-if portfolio scenarios
- Strategy - Data source comparison with live examples
- Portfolio Tracker - Complete portfolio with fundamentals and technicals
- Data Coverage Comparison - Side-by-side data availability matrix
Frequently Asked Questions
Is Google Finance API free in 2026?
Google Finance API (the GOOGLEFINANCE function in Google Sheets) is completely free to use with any Google account. However, the original REST API was deprecated in 2012. The free function provides delayed data (15-20 minutes), limited fundamentals (only P/E and EPS), and no options, technical indicators, or dividend details. For comprehensive free data, consider combining GOOGLEFINANCE with other sources. For professional needs, MarketXLS provides 1000+ functions.
Does Google Finance API work in Excel?
No. The GOOGLEFINANCE function works only in Google Sheets. Microsoft Excel does not support GOOGLEFINANCE. For Excel users, MarketXLS provides equivalent and far more comprehensive financial data through native Excel formulas like =Last(), =PERatio(), =RSI(), and 1000+ additional functions. Visit marketxls.com to explore Excel integration.
Why did Google shut down the Finance API?
Google deprecated the Finance API in 2012 as part of a broader shutdown of legacy GData APIs. Google shifted focus away from financial data services and never rebuilt a public finance API. The GOOGLEFINANCE function in Google Sheets remains as the only officially supported way to access Google's financial data, but it operates through an internal mechanism rather than a public API.
What is the best Google Finance API alternative for real-time data?
For real-time stock data in spreadsheets, a paid data add-in such as MarketXLS is the usual alternative. The =Last() function provides current prices and =QM_Stream_Last() streams real-time updates in Excel on the Advanced and Business plans (the Standard plan's stock quotes are 15-minute delayed). Plans start at $70/month billed annually. Book a demo to see real-time data in action.
Can I use Google Finance API for options trading?
No. The GOOGLEFINANCE function provides zero options data - no chains, no Greeks, no implied volatility, no open interest. For options data in spreadsheets, MarketXLS provides =QM_GetOptionChainActive() for complete option chains, =Delta() for option delta, and =ImpliedVolatility() for IV (options data is end-of-day on the Standard plan and real-time on Advanced and Business).
How do I get stock data into Google Sheets without GOOGLEFINANCE?
Beyond GOOGLEFINANCE, you can use Google Sheets' IMPORTDATA or IMPORTXML functions with external APIs, though these require technical setup and are fragile. Google Apps Script can connect to REST APIs like Alpha Vantage. MarketXLS also provides a Google Sheets add-on with the same pricing as MarketXLS for Excel, so no coding or API management is required.
The Bottom Line
There is no public Google Finance API; the GOOGLEFINANCE function in Google Sheets fills that need at the most basic level - delayed prices, limited fundamentals, and historical data for casual monitoring. But professionals quickly hit its walls: no real-time data, no options chains, no technical indicators, no comprehensive fundamentals, and no Excel support.
For anyone who has outgrown GOOGLEFINANCE - whether you need real-time prices, options analysis, technical indicators, dividend tracking, or simply need your data in Excel instead of Google Sheets - MarketXLS adds 1000+ financial data functions to Excel and Google Sheets without API keys or scripts. US plans start at $70/month billed annually (15-minute delayed stock quotes), with real-time streaming on the Advanced ($125/month) and Business ($200/month) plans.
Ready to move beyond GOOGLEFINANCE? Visit MarketXLS to explore the full platform, or book a demo to see it with your own data.