

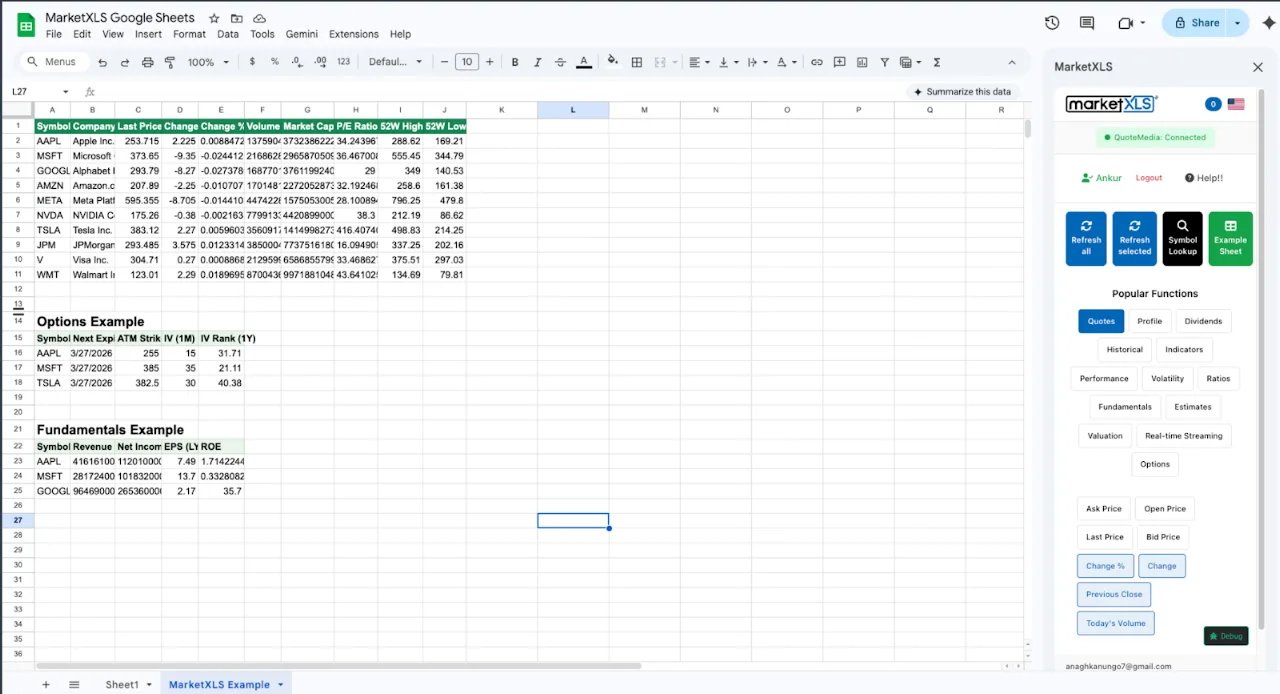
The main alternative to GOOGLEFINANCE inside Google Sheets is a paid market-data add-on such as MarketXLS, which adds 1,000+ functions for quotes, options chains, financial statements, technical indicators, and dividend data. GOOGLEFINANCE is free and fine for basic price lookups, but its quotes can be delayed up to 20 minutes and it has no options chains, no statement line items, and no indicators like RSI. With MarketXLS you replace =GOOGLEFINANCE("AAPL") with =Last("AAPL") and add functions such as =QM_GetOptionChain("AAPL") or =hf_revenue("AAPL", 2024). Real-time US stock and options data requires the Advanced or Business plan; the Standard plan's stock quotes are 15-minute delayed.
This guide covers where GOOGLEFINANCE falls short, what MarketXLS adds in Google Sheets, and how to switch your formulas.
Why People Search for a GOOGLEFINANCE Alternative
The most common reasons investors and professionals look for a GOOGLEFINANCE alternative:
Delayed Data
GOOGLEFINANCE stock prices are delayed by 15 to 20 minutes. You cannot get real-time stock prices in Google Sheets using GOOGLEFINANCE. For active traders, portfolio managers, and financial advisors who need current prices, this delay is unacceptable.
No Options Data
GOOGLEFINANCE has zero support for options. No option chains, no strike prices, no expiration dates, no implied volatility, no Greeks. If you trade options or advise clients who trade options, GOOGLEFINANCE is useless for this purpose.
No Financial Statements
GOOGLEFINANCE provides PE ratio and EPS. That is the extent of its fundamental data. You cannot pull revenue, net income, balance sheet items, cash flow statements, or any detailed financial data. For fundamental analysis in Google Sheets, you need a GOOGLEFINANCE alternative.
No Technical Indicators
There is no way to get RSI, MACD, moving averages, Bollinger Bands, or any technical indicator from GOOGLEFINANCE. You would have to pull raw historical prices and build complex formulas manually. Most people give up and look for a GOOGLEFINANCE alternative that provides these indicators as simple functions.
Unreliable Data
GOOGLEFINANCE regularly returns #N/A errors, stale data, or stops updating entirely. Google does not officially support GOOGLEFINANCE as a product, and there is no SLA or guarantee that the data will be accurate or available.
No Dividend Details
GOOGLEFINANCE does not provide dividend yield, dividend per share, ex-dividend dates, payout ratios, or dividend history. Income-focused investors who track dividends in Google Sheets need a GOOGLEFINANCE alternative that covers dividend data.
MarketXLS as a GOOGLEFINANCE Alternative in Google Sheets
MarketXLS is a Google Sheets add-on that provides over 1,000 financial functions. It installs from the Google Workspace Marketplace and works with simple cell formulas, like GOOGLEFINANCE. It covers the areas below that GOOGLEFINANCE does not.
Stock Prices (Delayed or Real-Time by Plan)
MarketXLS price functions return 15-minute delayed quotes on the Standard plan and real-time quotes on the Advanced and Business plans:
=Last("AAPL")              // Current stock price
=QM_Last("AAPL")           // Real-time price via QuoteMedia
=Bid("AAPL")               // Current bid
=Ask("AAPL")               // Current ask
=QM_Bid("AAPL")            // Real-time bid
=QM_Ask("AAPL")            // Real-time ask
Formula documentation: Last, QM_Last, Bid, Ask, QM_Bid, QM_Ask
The QM_ functions pull quotes from QuoteMedia, the MarketXLS quote provider.
Complete Financial Statements
Pull 10+ years of financial data into Google Sheets:
=hf_revenue("AAPL", 2024)              // Revenue
=hf_net_income("AAPL", 2024)           // Net income
=hf_gross_profit("AAPL", 2024)         // Gross profit
=hf_ebit("AAPL", 2024)                 // EBIT
=hf_total_assets("AAPL", 2024)         // Total assets
=hf_total_debt("AAPL", 2024)           // Total debt
=hf_cash_and_equivalents("AAPL", 2024) // Cash
=hf_free_cash_flow("AAPL", 2024)       // Free cash flow
=hf_operating_cash_flow("AAPL", 2024)  // Operating cash flow
Formula documentation: hf_revenue, hf_net_income, hf_gross_profit, hf_ebit, hf_total_assets, hf_total_debt, hf_cash_and_equivalents, hf_free_cash_flow
MarketXLS has 337 fundamental data functions. GOOGLEFINANCE has 2 (PE and EPS).
Full Options Data
The GOOGLEFINANCE alternative that options traders actually need:
=QM_GetOptionChain("AAPL")              // Full options chain
=QM_GetOptionChainAtTheMoney("AAPL")    // ATM options
=QM_GetOptionChainInTheMoney("AAPL")    // ITM options
Formula documentation: QM_GetOptionChain, QM_GetOptionChainAtTheMoney, QM_GetOptionChainInTheMoney
These return options chains with bid, ask, volume, open interest, implied volatility, and Greeks for each strike and expiration. Options data is end-of-day on the Standard plan and real-time on Advanced and Business.
Technical Indicators
Get any technical indicator as a simple formula:
=RSI("AAPL")                          // Relative Strength Index
=SimpleMovingAverage("AAPL", 50)      // 50-day SMA
=ExponentialMovingAverage("AAPL", 12) // 12-day EMA
=MACD("AAPL")                         // MACD
=BollingerBand("AAPL", 20)            // Bollinger Bands
=AverageTrueRange("AAPL")             // ATR
=VWAP("AAPL")                         // Volume Weighted Average Price
=Stochastic("AAPL")                   // Stochastic Oscillator
Formula documentation: RSI, SimpleMovingAverage, ExponentialMovingAverage, AverageTrueRange
No manual calculations. No complex array formulas. Each indicator is a single function call in Google Sheets.
Dividend Data
Track every dividend metric in Google Sheets:
=DividendYield("AAPL")      // Dividend yield
=DividendPerShare("AAPL")   // Dividend per share
=Ex_DividendDate("AAPL")    // Ex-dividend date
=PayoutRatio("AAPL")        // Payout ratio
Formula documentation: DividendYield, DividendPerShare, Ex_DividendDate, PayoutRatio
Key Statistics and Ratios
=PERatio("AAPL")            // P/E ratio
=Beta("AAPL")               // Beta
=EBITDA("AAPL")             // EBITDA
=MarketCap("AAPL")          // Market cap
=Revenue("AAPL")            // Revenue
=BookValuePerShare("AAPL")  // Book value per share
Formula documentation: PERatio, Beta, EBITDA, Revenue, BookValuePerShare
Historical Data
=QM_GetHistory("AAPL")                    // Full price history
=Close_Historical("AAPL", "2024-01-15")   // Specific date close
=QM_GetIntradayDataFiveMinutes("AAPL")    // 5-minute intraday bars
=QM_GetIntradayDataOneMinutes("AAPL")     // 1-minute intraday bars
Formula documentation: QM_GetHistory, Close_Historical, QM_GetIntradayDataFiveMinutes, QM_GetIntradayDataOneMinutes
Portfolio Analytics
MarketXLS includes portfolio-level analytics for Sharpe ratio, Sortino ratio, beta, Value at Risk, maximum drawdown, correlation, and covariance. These tools help financial advisors and portfolio managers measure risk-adjusted performance directly in Google Sheets.
Why Financial Advisors Choose MarketXLS as Their GOOGLEFINANCE Alternative
Financial advisors and RIAs have specific needs that GOOGLEFINANCE cannot meet:
Client Dashboards: Google Sheets makes it easy to share live dashboards with clients. With MarketXLS, advisors can build portfolio trackers (real-time on the Advanced and Business plans), performance reports, and risk analysis dashboards that clients can view in their browser. GOOGLEFINANCE delayed data is not suitable for client-facing reports.
Fundamental Research: Advisors need to pull financial statements, analyze ratios, and compare companies across multiple metrics. MarketXLS provides 337 fundamental data functions covering every line item on the income statement, balance sheet, and cash flow statement. GOOGLEFINANCE has PE ratio and EPS.
Options Analysis: Many advisors run covered call strategies, protective puts, and other options-based portfolio management strategies. MarketXLS provides full options chain data in Google Sheets so advisors can analyze strategies without switching to a separate platform.
Portfolio Risk Metrics: Professional portfolio management requires Sharpe ratio, Sortino ratio, beta, Value at Risk, and other risk analytics. MarketXLS provides these calculations in Google Sheets. GOOGLEFINANCE has no portfolio analytics.
Data Reliability: When a client asks "what is my portfolio worth right now?" the answer needs to be accurate. GOOGLEFINANCE errors and delayed data are not acceptable for professional use. MarketXLS uses professional data feeds that advisors can rely on.
GOOGLEFINANCE Alternative Comparison
| Feature | GOOGLEFINANCE | MarketXLS | Alpha Vantage API | Yahoo Finance (unofficial) |
|---|---|---|---|---|
| Platform | Google Sheets | Google Sheets + Excel | Requires coding | Requires coding |
| Real-time data | Up to 20-min delay | Real-time on Advanced/Business; 15-min delay on Standard | Delayed (free tier) | Unstable |
| Functions | 1 (~18 attributes) | 1,000+ | API calls | API calls |
| Options data | None | Full chains + Greeks | None | Limited |
| Financial statements | PE + EPS only | 337 fundamental functions | Limited | Limited |
| Technical indicators | None | RSI, SMA, MACD, Bollinger, more | Requires coding | Requires coding |
| Dividend data | None | Yield, ex-date, payout ratio | Limited | Limited |
| Portfolio analytics | None | Sharpe, Sortino, VaR, beta | None | None |
| Setup required | None | Install add-on (2 min) | API key + code | Code + maintenance |
| Reliability | Frequent errors | Professional data feeds | Rate limited | Breaks often |
| Support | Community forums | Dedicated support team | Community | None |
How to Switch from GOOGLEFINANCE to MarketXLS
Switching from GOOGLEFINANCE to MarketXLS in Google Sheets is simple:
Step 1: Install MarketXLS
Get the add-on from the Google Workspace Marketplace. Click Install and grant the required permissions.
Step 2: Get Your License
Purchase a MarketXLS subscription from the pricing page. Google Sheets uses the same plans and pricing as MarketXLS for Excel.
Step 3: Replace Your Formulas
| GOOGLEFINANCE Formula | MarketXLS Equivalent |
|---|---|
=GOOGLEFINANCE("AAPL") | =Last("AAPL") or =QM_Last("AAPL") |
=GOOGLEFINANCE("AAPL", "pe") | =PERatio("AAPL") |
=GOOGLEFINANCE("AAPL", "eps") | =hf_earnings_per_diluted_share("AAPL", 2024) |
=GOOGLEFINANCE("AAPL", "volume") | =Volume("AAPL") or =QM_ShareVolume("AAPL") |
=GOOGLEFINANCE("AAPL", "marketcap") | =MarketCap("AAPL") or =QM_MarketCap("AAPL") |
=GOOGLEFINANCE("AAPL", "high52") | =FiftyTwo_weekHigh("AAPL") |
=GOOGLEFINANCE("AAPL", "low52") | =FiftyTwo_weekLow("AAPL") |
| Not available | =DividendYield("AAPL") |
| Not available | =RSI("AAPL") |
| Not available | =QM_GetOptionChain("AAPL") |
| Not available | =hf_revenue("AAPL", 2024) |
You can keep your existing GOOGLEFINANCE formulas alongside MarketXLS formulas. They do not conflict. Many users gradually replace GOOGLEFINANCE formulas as they build out their spreadsheets.
Frequently Asked Questions
What is a good GOOGLEFINANCE alternative for Google Sheets?
MarketXLS is a paid Google Sheets add-on that replaces and extends GOOGLEFINANCE. It provides over 1,000 financial functions covering stock prices (real-time on the Advanced and Business plans), financial statements, options chains, technical indicators, dividend data, and portfolio analytics. It installs directly from the Google Workspace Marketplace and uses simple formulas just like GOOGLEFINANCE.
Can I use MarketXLS and GOOGLEFINANCE together?
Yes. MarketXLS and GOOGLEFINANCE can coexist in the same Google Sheets spreadsheet. You can use GOOGLEFINANCE for basic data and MarketXLS for everything else. There are no conflicts between the two.
Does MarketXLS work in Excel too?
Yes. MarketXLS has a Windows desktop add-in for Excel, a Microsoft 365 add-in for Excel on Mac and Excel for the web (where formulas use the mxls. prefix, such as =mxls.Last("MSFT")), and the Google Sheets add-on. Most function names are the same across platforms, but some functions differ by platform; check the MarketXLS formula library.
Is there a free GOOGLEFINANCE alternative?
There are free APIs like Alpha Vantage, but they require coding knowledge, have strict rate limits, and do not work as native Google Sheets functions. MarketXLS is a paid option that works as simple formulas inside Google Sheets without coding.
How much does MarketXLS cost?
Google Sheets uses the same pricing as MarketXLS for Excel. US non-professional plans are Standard ($70/month billed annually), Advanced ($125/month billed annually), and Business ($200/month billed annually), with quarterly billing also available. Prices include data and exchange fees; taxes may apply. See the pricing page for current plans.
Does MarketXLS support international stocks?
MarketXLS covers US, Canadian, UK, German, and Australian markets (ASX live data needs an additional Barchart subscription). Indian markets are served separately through marketxls.in.
Summary
GOOGLEFINANCE is a great free starting point for getting stock prices in Google Sheets. But it is limited to about 18 attributes, delayed by 20 minutes, has no options data, no financial statements, no technical indicators, no dividend details, and no portfolio analytics. When you outgrow GOOGLEFINANCE, MarketXLS is a paid add-on that adds those missing data types to Google Sheets.
MarketXLS provides over 1,000 functions: prices via =Last() and =QM_Last() (real-time on Advanced and Business), financial statement data via hf_ functions, options chains via =QM_GetOptionChain(), technical indicators like =RSI() and =SimpleMovingAverage(), and dividend data via =DividendYield() and =Ex_DividendDate().
Get Started with MarketXLS | View Pricing | Install from Google Workspace
