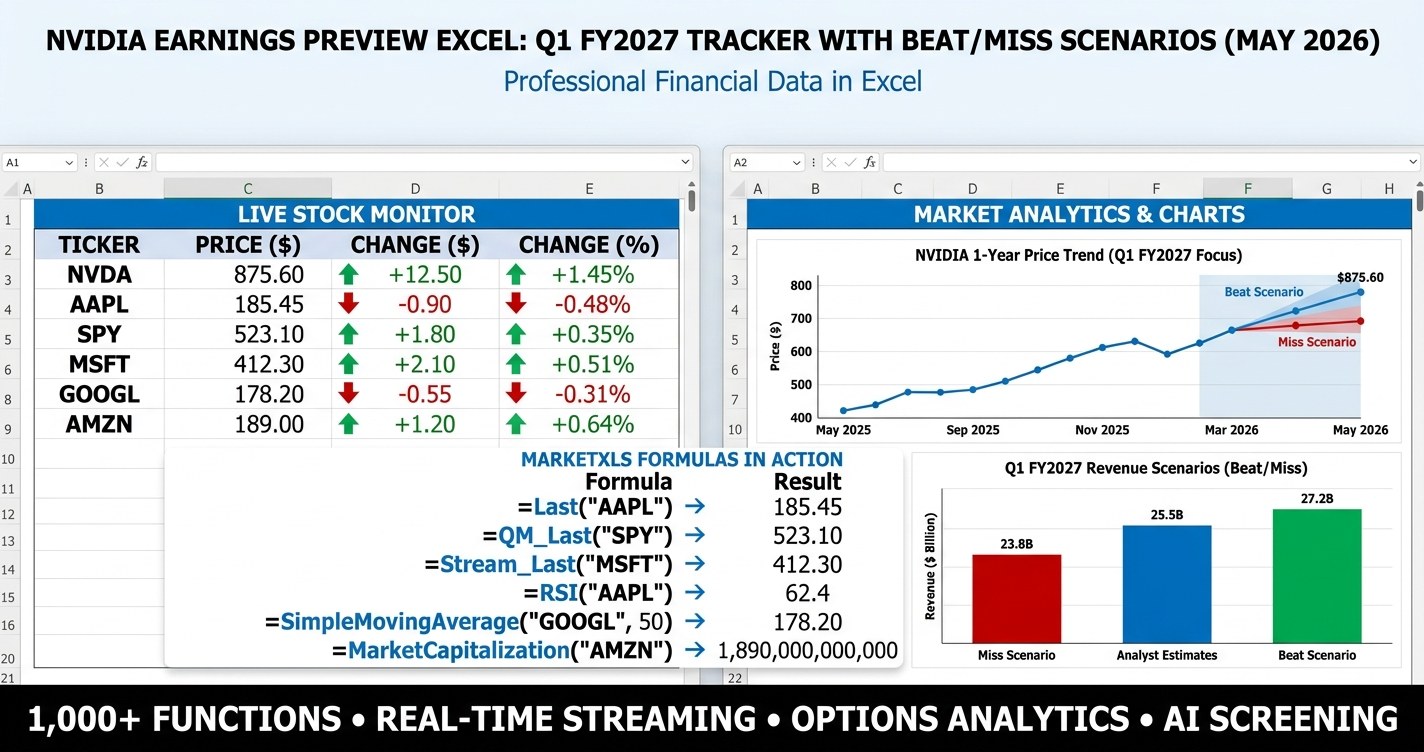
NVIDIA earnings preview Excel - a free template for the Q1 FY2027 report, with live consensus EPS and revenue, a beat/miss scenario engine, AI chip peer comparison, and an options pre-earnings playbook powered by MarketXLS formulas.
Stock Analysis
Expert insights on stock market analysis, investment strategies, and Excel techniques for smarter investing.
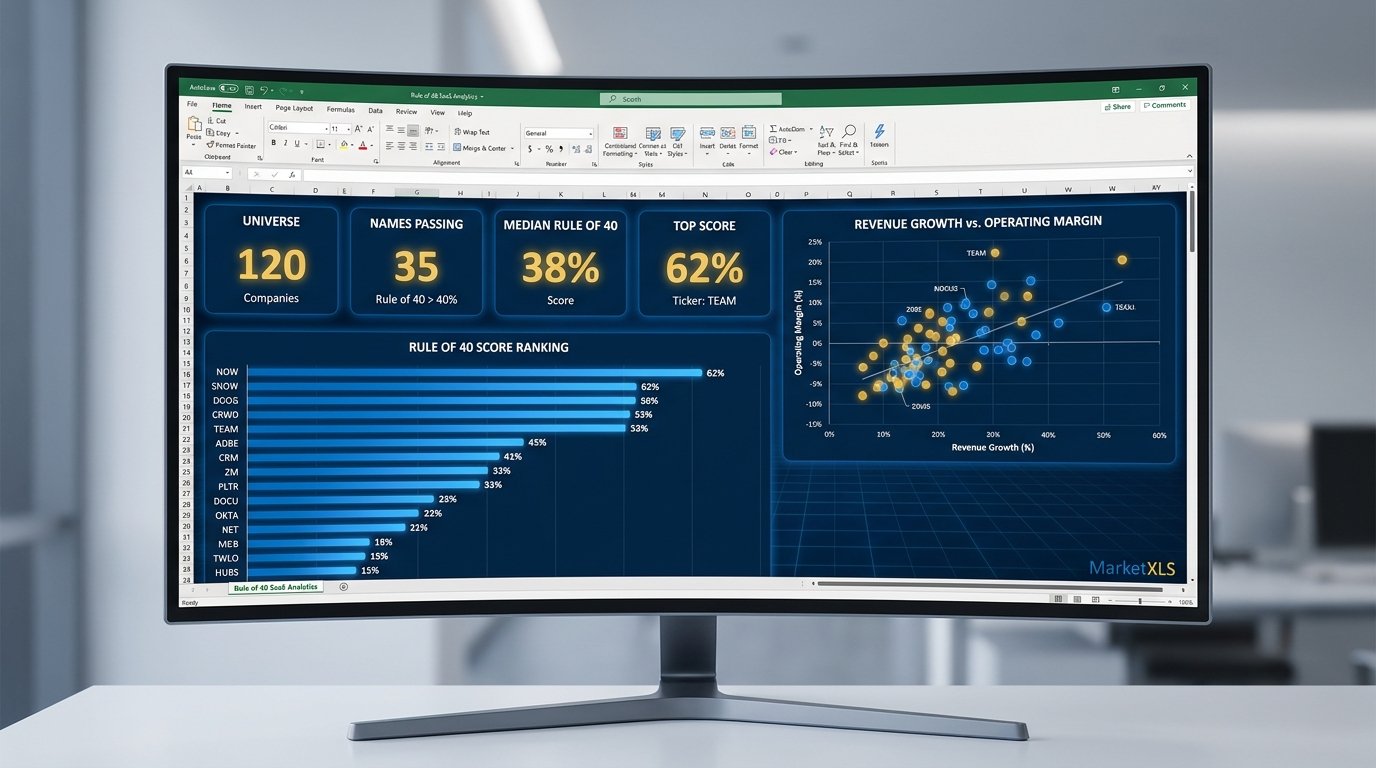
Rule of 40 screener excel - download a premium May 2026 dashboard that scores 20 SaaS and cloud names on revenue growth plus profit margin, with KPI tiles, scenario stress tests, and live MarketXLS formulas.
NVIDIA earnings preview Excel - a free template for the Q1 FY2027 report, with live consensus EPS and revenue, a beat/miss scenario engine, AI chip peer comparison, and an options pre-earnings playbook powered by MarketXLS formulas.
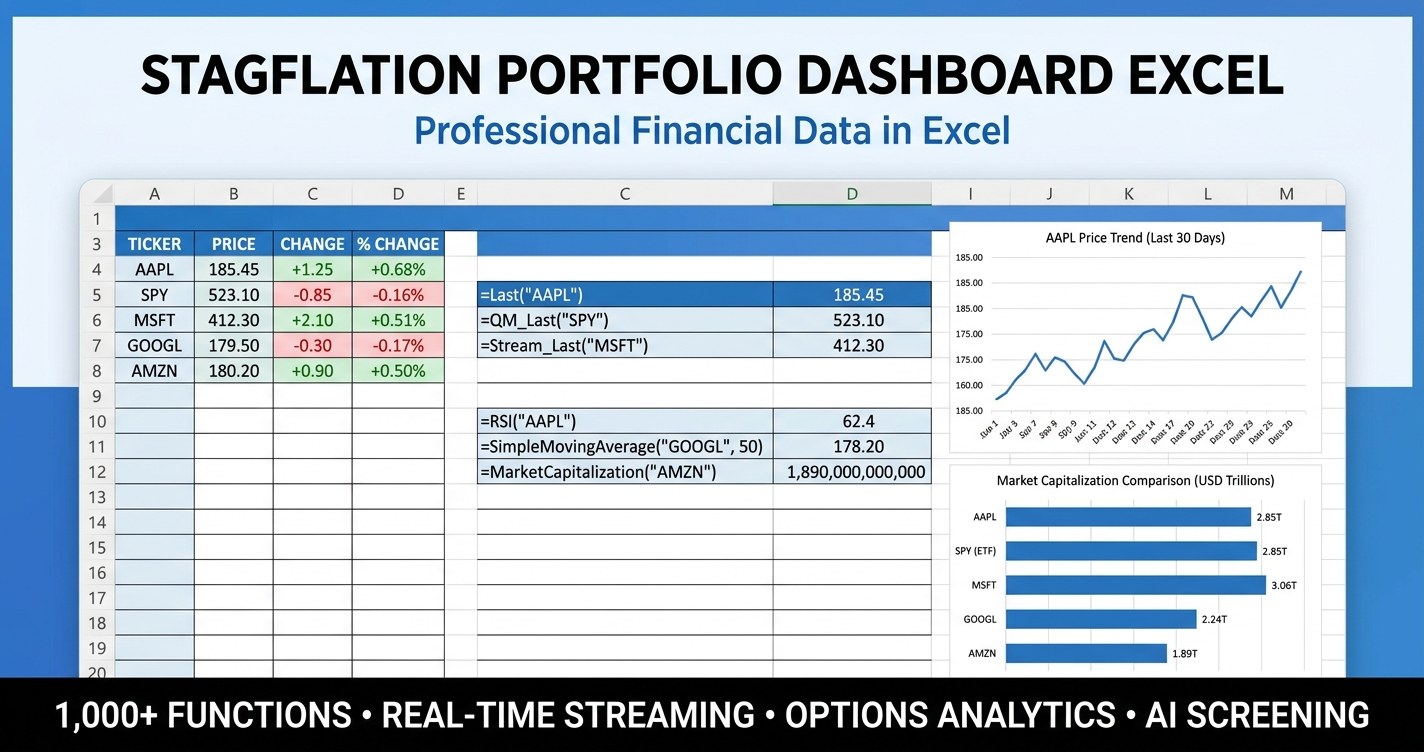
Stagflation portfolio dashboard excel helps advisors and self-directed investors build a defensive tilt with a real asset sleeve, scenario analysis, and live MarketXLS macro data in one premium workbook.
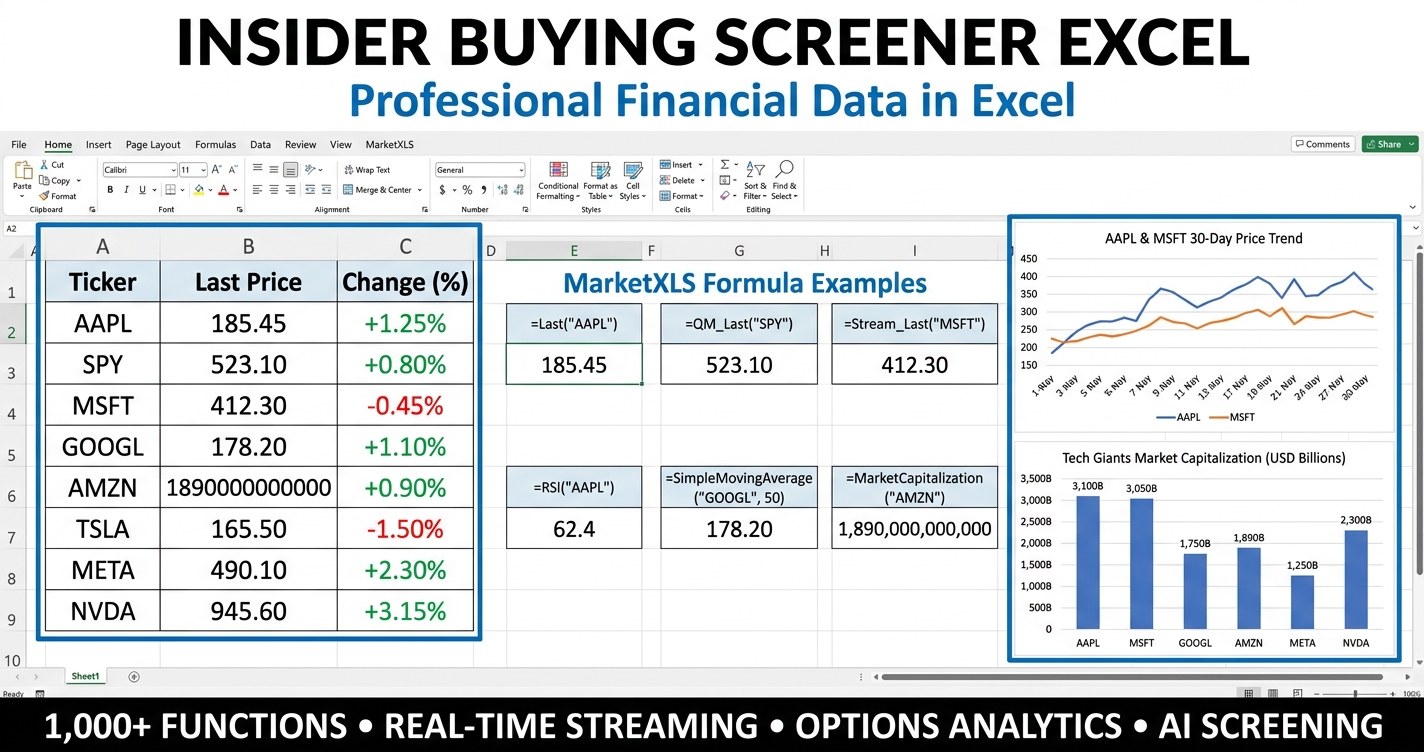
Insider buying screener Excel - build a live, alignment-focused watchlist that ranks stocks by insider ownership, valuation, quality, and momentum, using verified MarketXLS formulas.
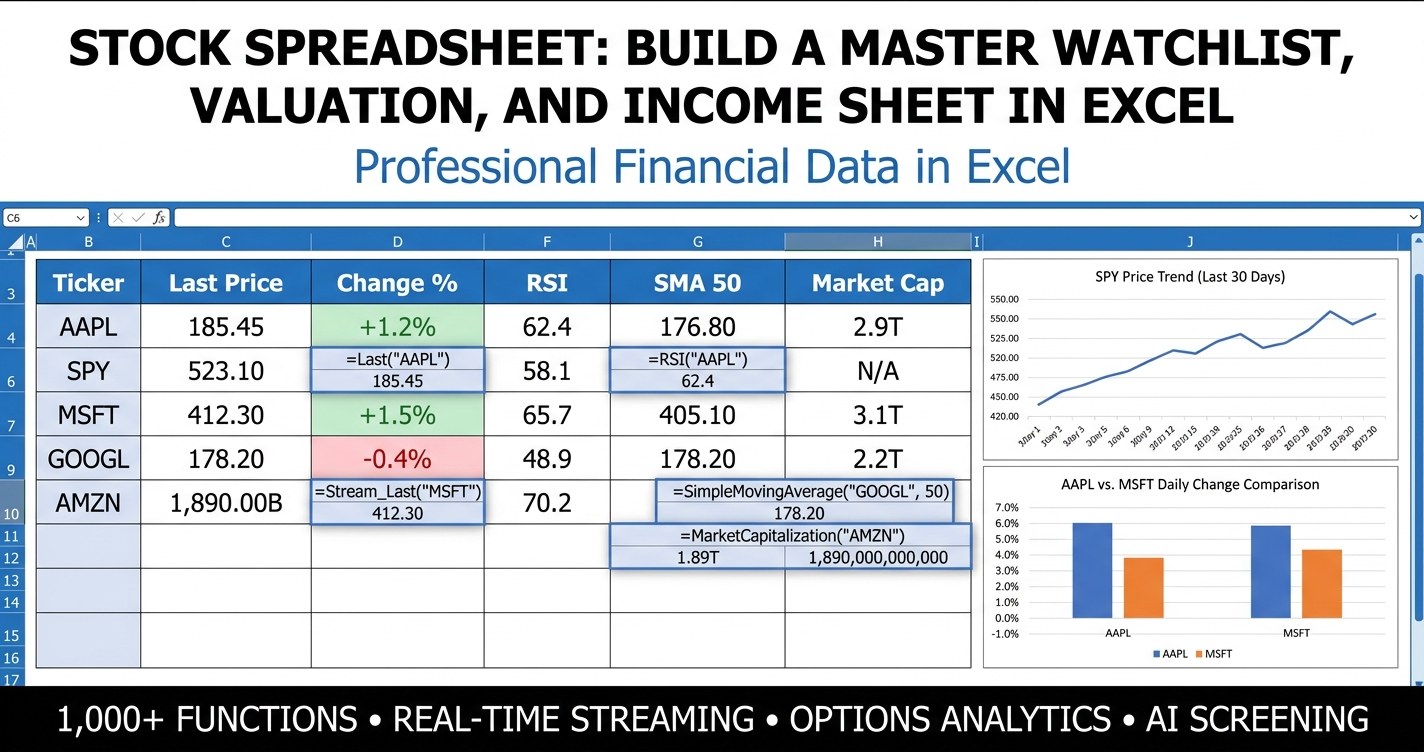
Stock spreadsheet - a seven-sheet MarketXLS workbook that turns Excel into a live watchlist, valuation lens, dividend income tracker, technical snapshot, sector rollup, and benchmark comparison around one editable ticker list.
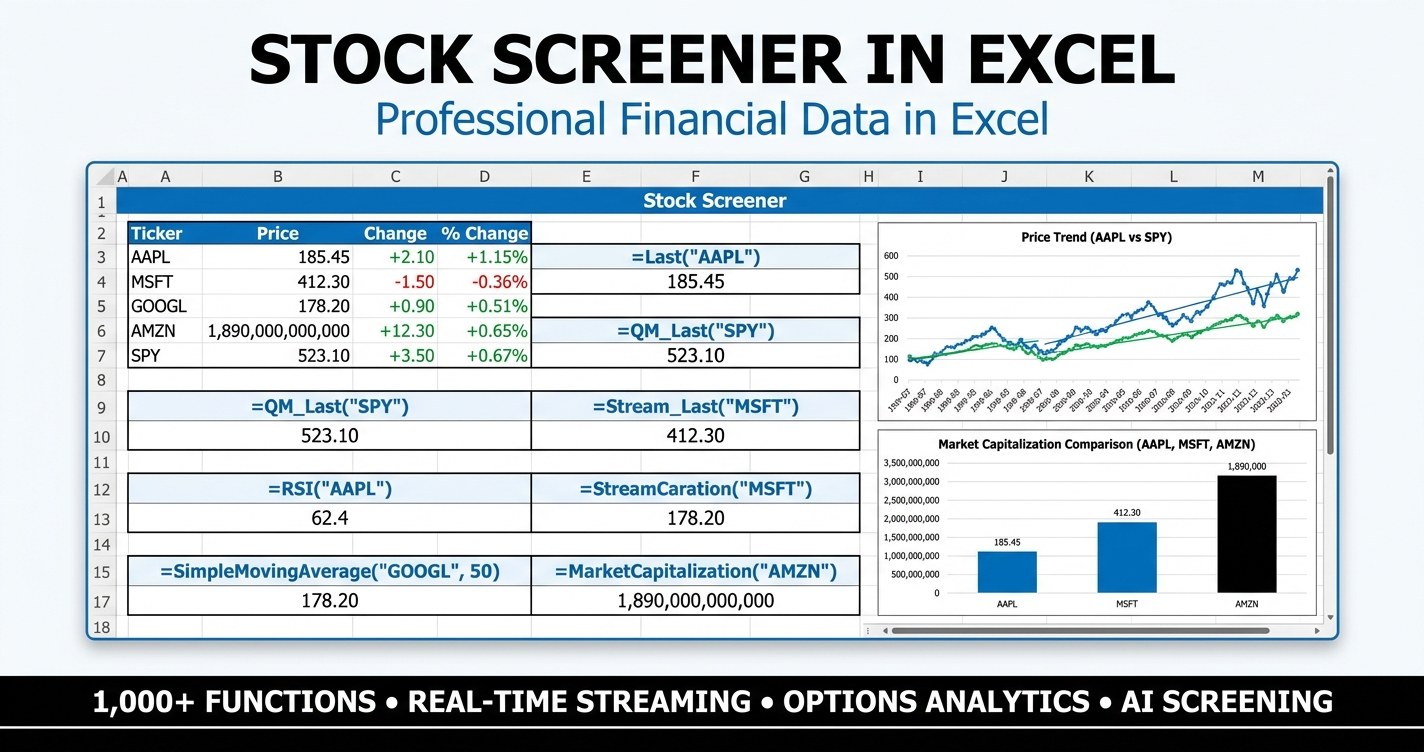
Stock screener in excel - a complete dashboard that ranks a twelve-ticker watchlist by P/E, dividend yield, beta, ROE, operating margin, and market cap, with scenario thresholds, scoring, and educational sizing in one workbook.
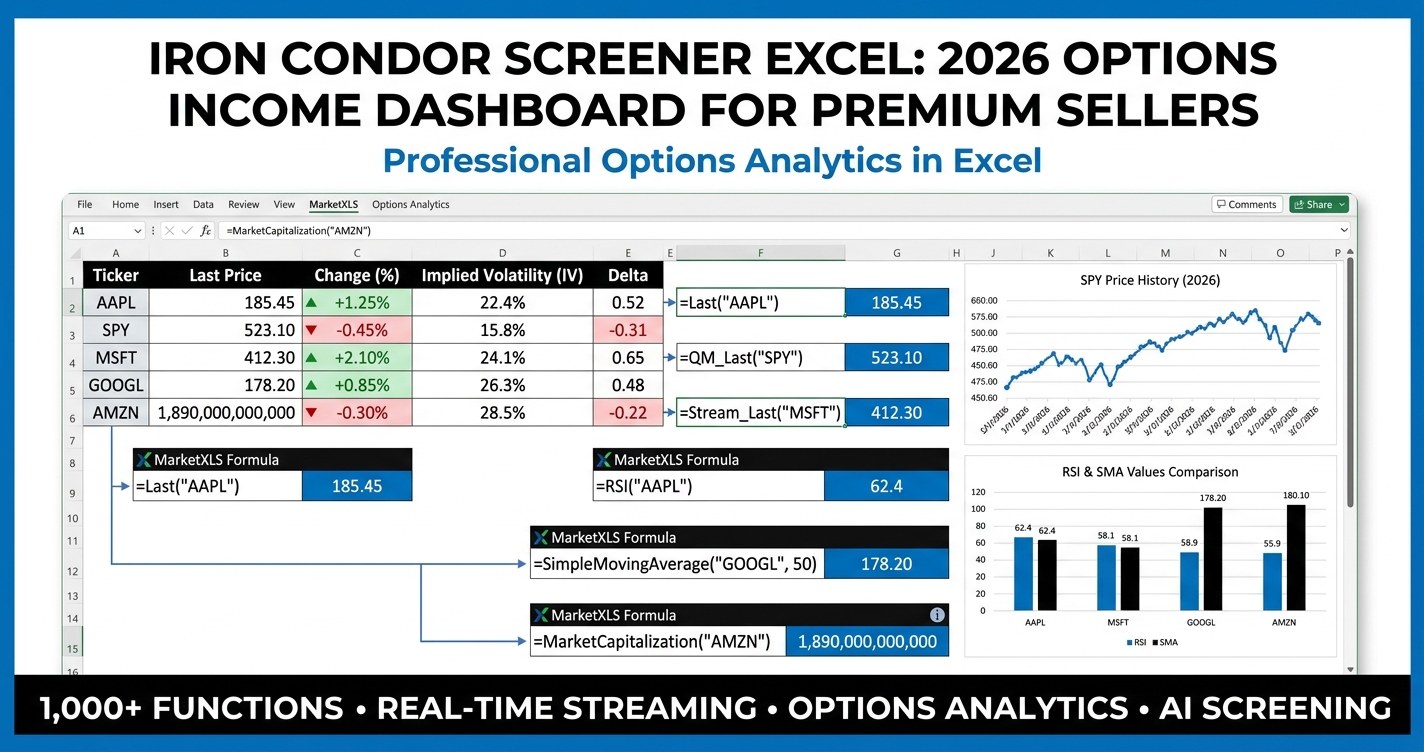
Iron condor screener excel - a premium dashboard for ranking 25 liquid optionable underlyings by IV rank, volatility risk premium, expected move, and projected credit, with strike selection, scenario analysis, and position sizing in one file.
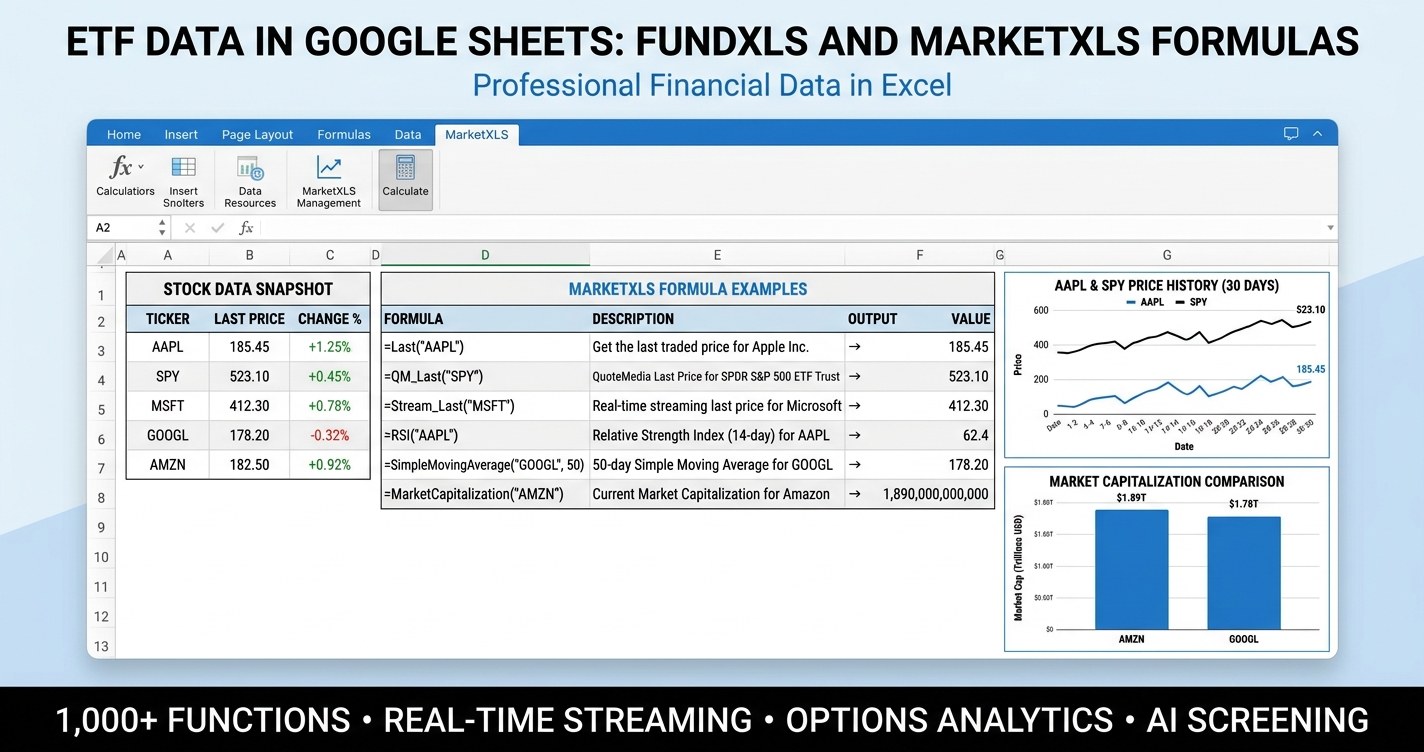
ETF data in Google Sheets is workable for prices, but AUM, expense ratio, top holdings, inception date, and option chains live outside GOOGLEFINANCE. This guide shows how FundXLS and the MarketXLS Google Sheets add-on close every gap, with verified formulas, a sample workbook, and a live template.

Mutual fund Google Sheets workflows are popular for a reason, but they hit hard ceilings around NAV coverage, yield, risk metrics, and history. This guide shows what Google Sheets does well for mutual fund tracking, where it falls short, and what MarketXLS adds.
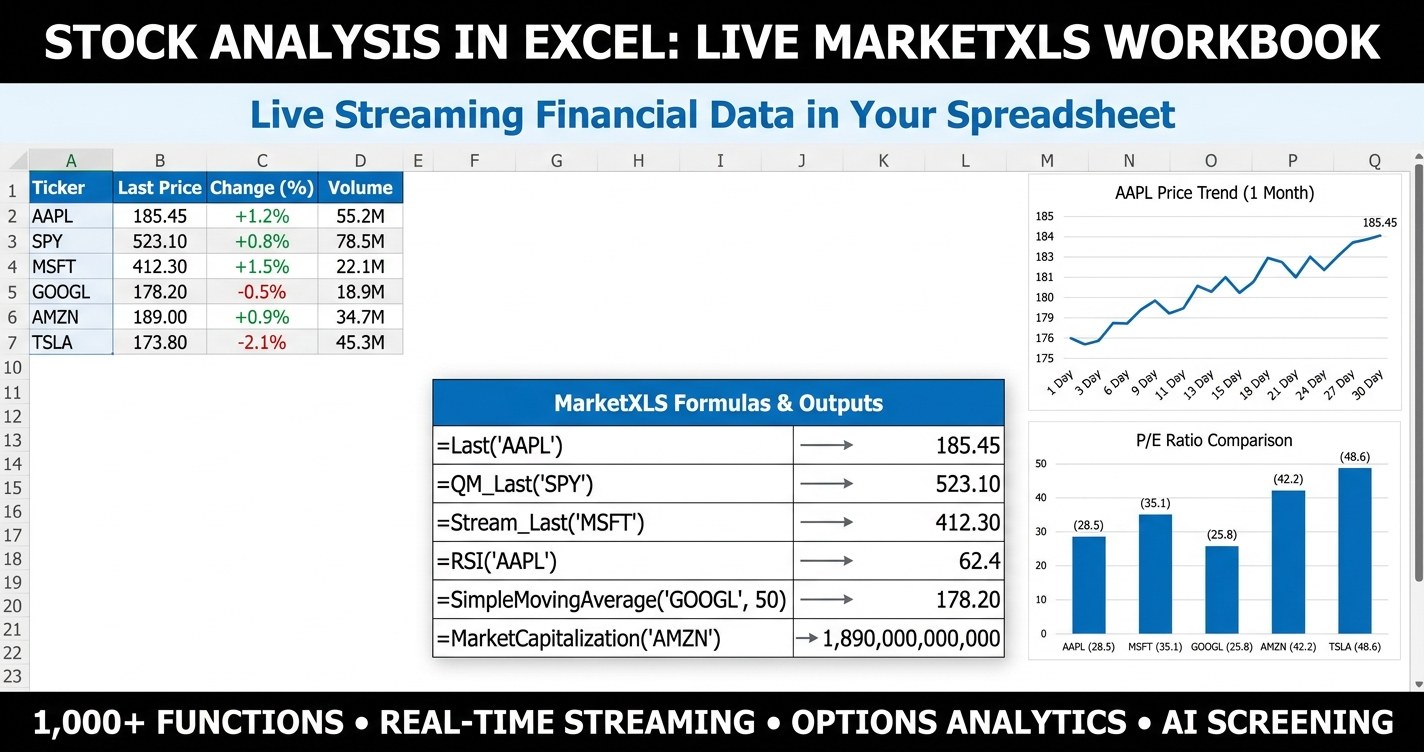
Stock analysis in Excel that pulls live price, valuation multiples, profitability, leverage, technicals, and peer comparisons into one workbook with MarketXLS formulas. Six-sheet template plus static sample included.
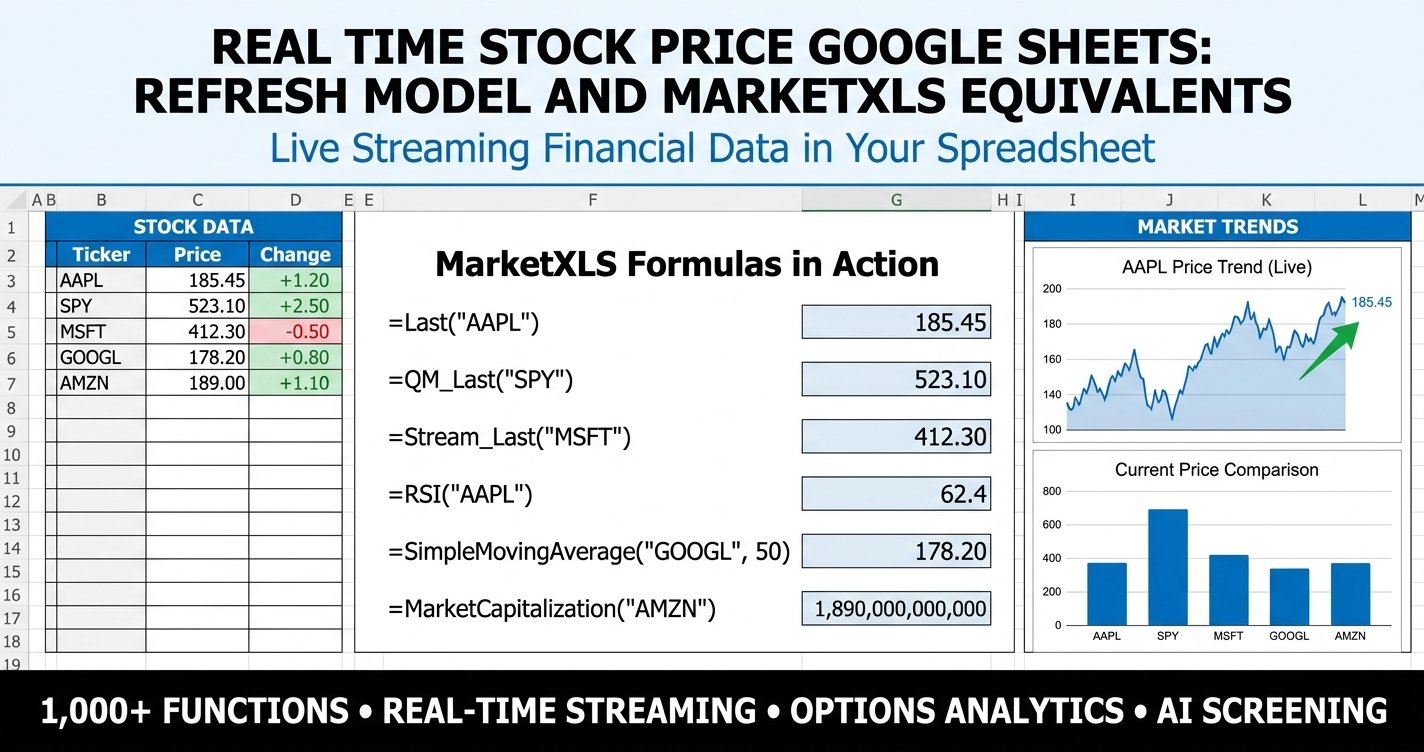
Real Time Stock Price Google Sheets is the most-asked spreadsheet question of the year, but the actual refresh model of GOOGLEFINANCE is far slower than the words suggest. This guide explains exactly how live each attribute is, where the delays hurt, and how MarketXLS streaming formulas fill the gap with a free downloadable template.
Stock portfolio tracker in Excel that recalculates prices, dividends, P&L, sector weights, and trend signals every refresh using MarketXLS formulas. Six-sheet workbook with scenario analysis included.
Excel stock tracker template that pulls live price, P/E, dividend yield, cost basis, gain/loss, sector allocation, and benchmark performance into one workbook with MarketXLS formulas.
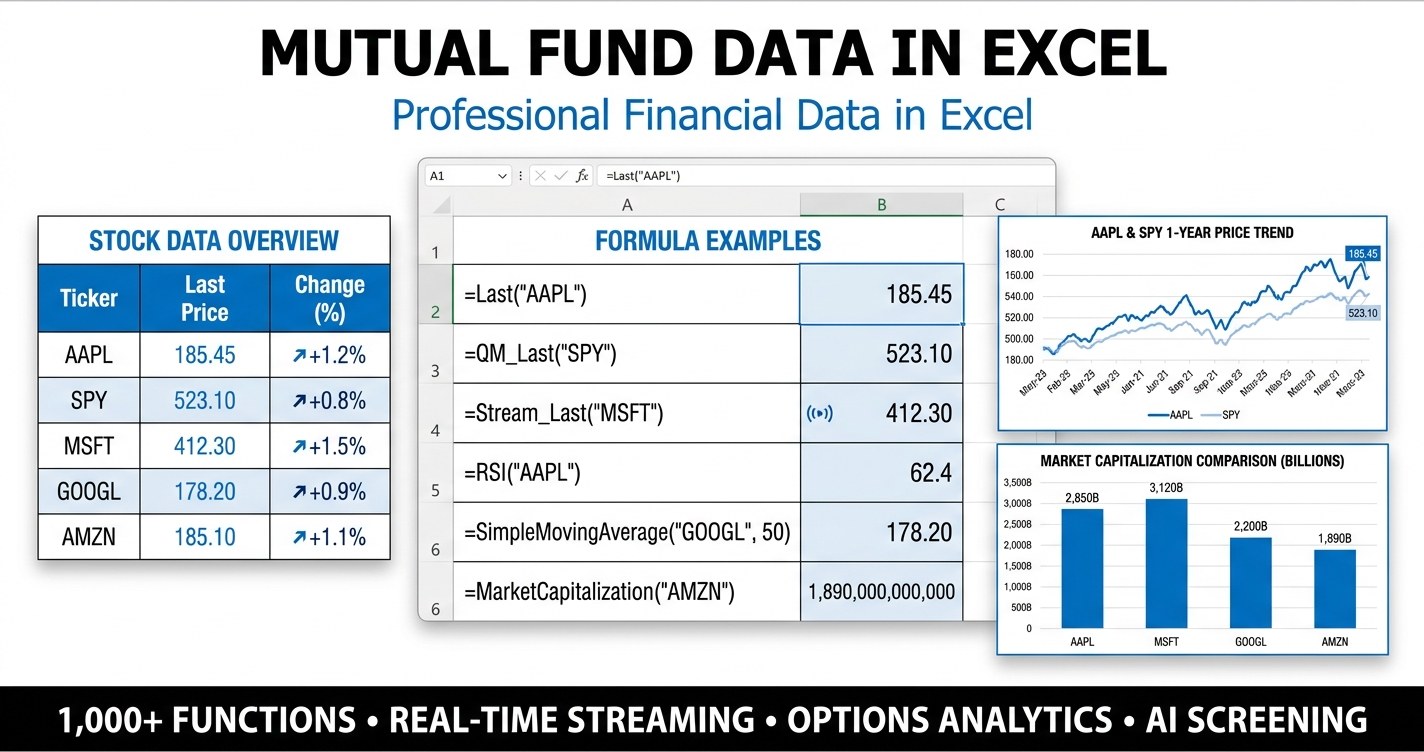
Mutual fund data in Excel, pulled live with MarketXLS formulas for NAV, fund assets, expense ratio, yield, YTD and 3-year return, volatility, and top holdings across 25 popular index, active, balanced, and target date funds.
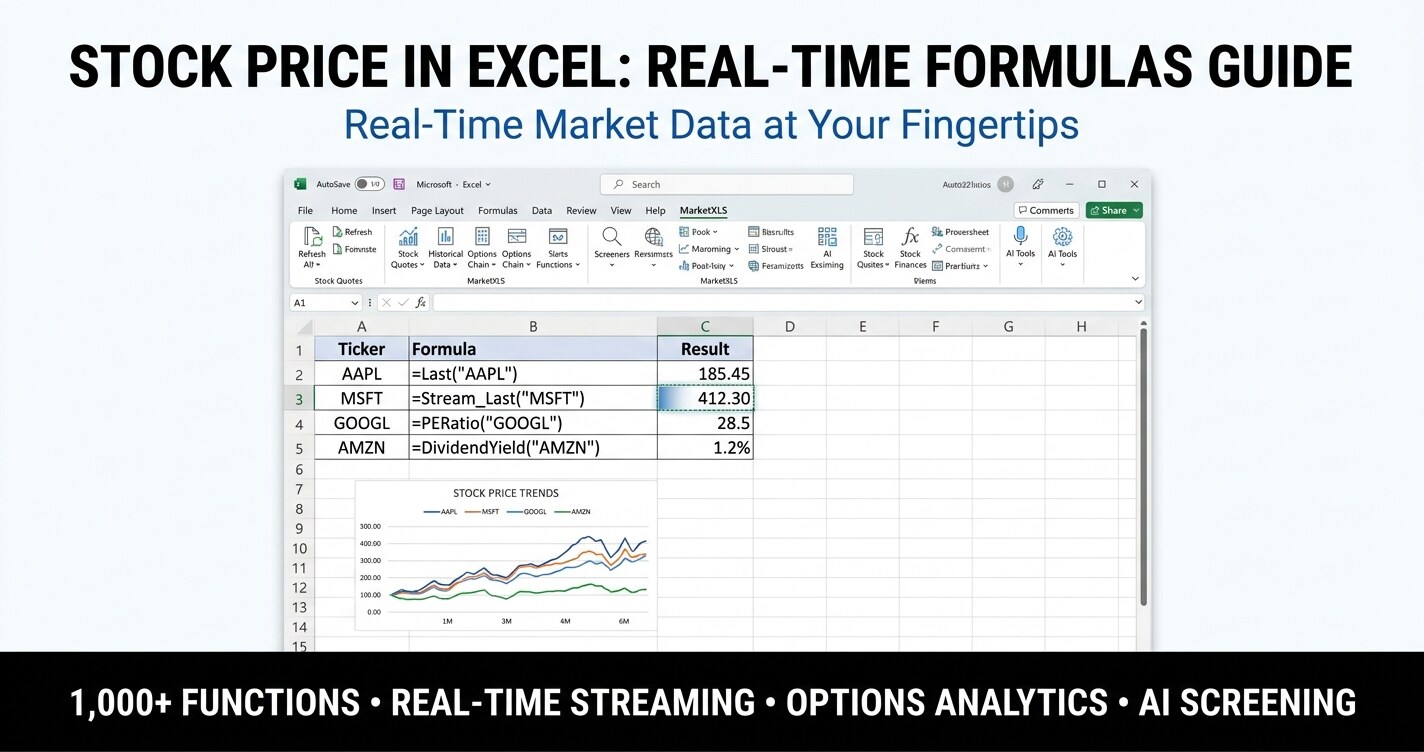
Stock price in Excel, pulled live with MarketXLS formulas for last trade, moving averages, RSI, 52-week range, market cap, and a complete watchlist plus alerts workbook.
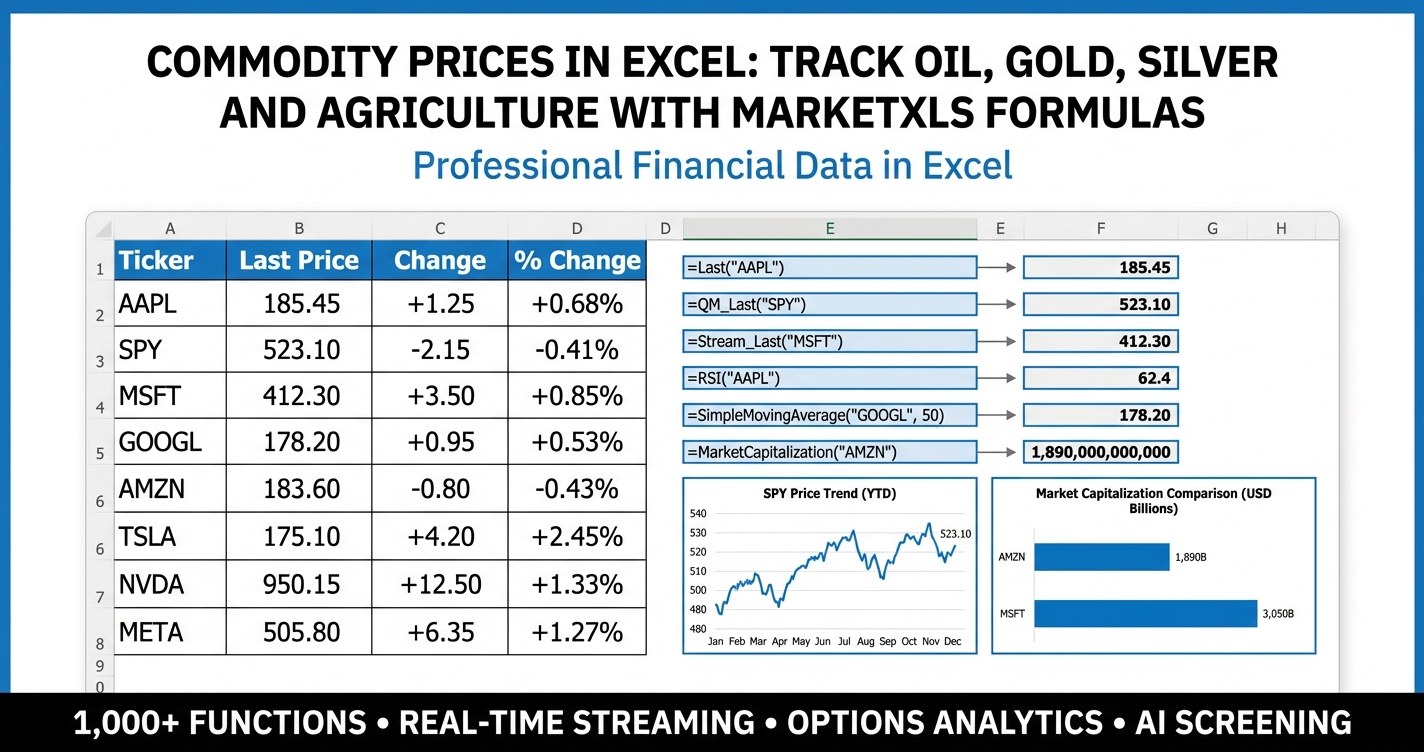
Commodity prices in Excel - track oil, gold, silver, natural gas, copper and agriculture in one live workbook using MarketXLS formulas across 16 commodity ETFs and 15 commodity-linked stocks.
Discover how 2,500+ serious investors are saving 15+ hours every week with real-time market data directly in Excel.
✓ No credit card required • ✓ 14-day money-back guarantee • ✓ Cancel anytime