
Every investor and portfolio manager faces the same fundamental challenge: how do you build portfolios that maximize returns while minimizing risk? It's the central question of investment management, and it's more complex than simply picking good stocks or diversifying across asset classes.
Portfolio optimization is the systematic approach to solving this challenge. Rather than relying on intuition or simple rules of thumb, portfolio optimization uses quantitative methods to construct portfolios that align with specific investment objectives and risk tolerances. For anyone managing investment portfolios, understanding portfolio optimization isn't just academic. It's essential for delivering consistent, risk-adjusted returns.
In this guide, we'll explore the foundations of portfolio optimization, dive deep into Modern Portfolio Theory, and examine the key metrics you should understand when constructing and evaluating portfolios.
What is Portfolio Optimization?
Portfolio optimization is the process of selecting the best portfolio from a set of possible portfolios based on specific investment objectives and constraints. At its core, portfolio optimization addresses two primary goals that most investors share:
- Maximizing returns for a given level of risk
- Minimizing risk for a desired level of return
These goals might seem contradictory, and in many ways, they are. Higher returns typically require accepting higher risk, and lower risk usually means accepting lower returns. Portfolio optimization provides a framework for navigating this fundamental trade-off systematically.
Consider a real-world scenario: An investor has $100,000 to invest over five years. They expect strong returns but haven't carefully considered their risk tolerance. They construct a portfolio with 70% stocks and 30% bonds, targeting aggressive growth. Three months later, the portfolio has declined 25% due to market volatility. Now they're anxious and want to make changes.
This scenario illustrates why portfolio optimization matters. Without a systematic approach to understanding the risk-return relationship, investors can make decisions that don't align with actual risk capacity. Portfolio optimization helps prevent these misalignments by providing a quantitative framework for portfolio construction.
Portfolio Optimization Process
The process involves comparing different asset allocation strategies, understanding how different assets correlate with each other, and selecting the combination that best meets specific objectives. Rather than simply diversifying by spreading investments across many holdings, portfolio optimization uses mathematical models to identify the most efficient combinations of assets.
The Foundation: Modern Portfolio Theory
Modern Portfolio Theory (MPT), introduced by Harry Markowitz in his groundbreaking 1952 paper "Portfolio Selection," fundamentally changed how we think about investment management. Before Markowitz, investors typically evaluated securities individually, focusing on each asset's expected return and risk in isolation.
Markowitz's insight was revolutionary: what matters isn't just the risk and return of individual securities, but how they interact within a portfolio. MPT showed that by combining assets with different return patterns, investors could reduce overall portfolio risk without sacrificing returns, or even increase returns without taking on additional risk.
The Core Principle: Diversification
The central tenet of MPT is that diversification can reduce risk. Not all assets move in the same direction at the same time. When stocks in one sector decline, stocks in another sector might hold steady or increase. When equities fall, bonds often rise. By holding a mix of assets that don't move in perfect lockstep, investors can smooth out their returns and reduce overall volatility.
This is why MPT is sometimes said to offer "the only free lunch in finance." Diversification allows you to reduce risk without necessarily reducing expected returns.
But MPT goes beyond simple diversification. It provides a mathematical framework for understanding exactly how much diversification benefit different asset combinations provide. Two portfolios might both be "diversified," but MPT helps identify which one offers superior risk-adjusted returns.
Modern Portfolio Theory Illustration
Key Assumptions of Modern Portfolio Theory
Like any model, MPT is built on certain assumptions about how markets and investors behave:
Investors are rational and risk-averse: MPT assumes investors prefer higher returns to lower returns and lower risk to higher risk. When choosing between two portfolios with equal expected returns, investors will always choose the one with less risk.
Returns are normally distributed: The theory assumes that asset returns follow a normal (bell curve) distribution, which allows for mathematical calculations of risk and expected returns.
Investors make decisions based on expected return and variance: MPT assumes that investors evaluate portfolios based solely on two factors: expected return (the mean) and risk (measured by variance or standard deviation).
All investors have access to the same information: The theory assumes a level playing field where all investors can access the same data and analysis.
Markets are efficient: MPT assumes that all available information is already reflected in asset prices, so it's not possible to consistently "beat the market" through stock selection alone.
No transaction costs or taxes: In its pure form, MPT doesn't account for the costs of buying and selling securities or the impact of taxes on returns.
Investors can borrow and lend at the risk-free rate: The theory assumes unlimited ability to leverage or de-leverage positions at a risk-free interest rate.
Real-World Limitations
While MPT provides a powerful framework, investors should recognize its limitations in practice.
Returns aren't always normally distributed: Real-world returns often exhibit "fat tails." Extreme events occur more frequently than a normal distribution would predict. The 2008 financial crisis demonstrated how models based on normal distributions can underestimate risk during market stress.
Investors aren't perfectly rational: Behavioral finance has shown that real investors make decisions based on emotions, cognitive biases, and psychological factors that MPT doesn't account for. Fear and greed can drive investors to make suboptimal decisions, even when they understand the theory.
Historical correlations can change: MPT typically uses historical data to estimate how assets relate to each other. However, correlations between assets can shift dramatically during crises. Assets that normally move independently may suddenly move together, reducing diversification benefits precisely when they're needed most.
Transaction costs and taxes matter: In the real world, rebalancing portfolios incurs trading costs and potential tax consequences. These frictions can significantly impact actual returns, especially for active strategies.
Market timing still matters: While MPT provides an excellent framework for long-term portfolio construction, many investors struggle to maintain discipline. Even with a perfectly optimized portfolio, investors who panic and sell during downturns will underperform.
Despite these limitations, MPT remains the foundation for modern portfolio management. It provides a systematic framework that, when applied thoughtfully and adjusted for real-world constraints, helps investors construct portfolios that align with their objectives.
The Risk-Return Tradeoff
At the heart of portfolio optimization is the fundamental relationship between risk and return. In general, assets with higher expected returns come with higher risk: the possibility of losing money or experiencing significant volatility.
This relationship isn't linear or guaranteed, but it's persistent across different asset classes and time periods. Treasury bills offer low returns but virtually no default risk. Stocks offer higher expected returns but can decline dramatically during recessions or bear markets. Small-cap and emerging market stocks offer potentially even higher returns but with correspondingly higher volatility.
The risk-return tradeoff means that portfolio optimization isn't about finding a single "best" portfolio. It's about finding the best portfolio for a specific risk tolerance and investment objective. An aggressive investor seeking maximum growth will optimize for a different portfolio than a conservative retiree seeking income and capital preservation.
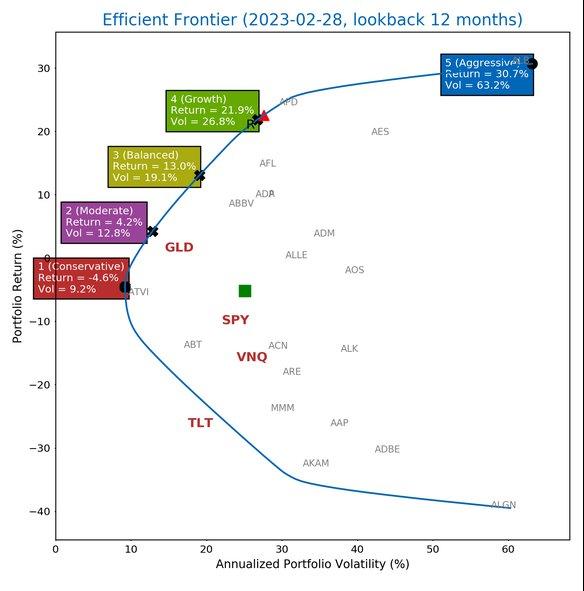
The Efficient Frontier
MPT introduces the concept of the efficient frontier: the set of portfolios that offer the maximum expected return for each level of risk. Portfolios on the efficient frontier are "optimal" in the sense that you cannot increase returns without accepting more risk, and you cannot reduce risk without accepting lower returns.
Portfolios that fall below the efficient frontier are suboptimal. They offer lower returns than could be achieved for the same level of risk, or higher risk than necessary for a given level of return. The goal of portfolio optimization is to construct portfolios that lie on the efficient frontier.
Learn how to calculate and visualize the efficient frontier using Excel functions in our complete implementation guide.
Key Portfolio Metrics You Should Know
Portfolio optimization relies on quantitative metrics to evaluate and compare different portfolio allocations. Understanding these metrics is essential for anyone who wants to construct optimized portfolios and make informed investment decisions.
Return Metrics
Monthly Returns: Track how portfolio value changes from one month to the next. Monthly returns provide granular insight into portfolio performance and help identify patterns in volatility and drawdowns.
Wealth Index: Shows how an initial investment grows over time. By convention, wealth index calculations often assume a starting value of $10,000, making it easy to visualize and compare growth across different portfolios or time periods.
Risk Metrics
Portfolio Volatility: Measures the standard deviation of returns, quantifying how much portfolio returns fluctuate around their average. Higher volatility indicates greater uncertainty about future returns. Not necessarily higher losses, but wider potential outcomes.
Portfolio Beta: Measures how sensitive a portfolio is to overall market movements. A beta of 1.0 means the portfolio moves in line with the market (typically measured against the S&P 500). A beta greater than 1.0 indicates higher sensitivity to market moves, while a beta less than 1.0 suggests lower sensitivity.
Drawdown: Calculates the percentage decline in portfolio value during a given month. Drawdowns help identify how often and how severely a portfolio experiences losses.
Maximum Drawdown: Identifies the largest peak-to-trough decline in portfolio value before a new peak is reached. This metric is crucial for understanding worst-case scenarios and ensuring portfolios align with risk capacity. Many investors can tolerate moderate volatility but will panic if faced with a 40% or 50% drawdown.
Value at Risk (VaR): Estimates the maximum potential loss over a specific time period at a given confidence level. For example, a daily VaR of $10,000 at 95% confidence means there's a 5% chance the portfolio will lose more than $10,000 in a single day.
Risk-Adjusted Return Metrics
The most sophisticated portfolio metrics combine risk and return into single measures that evaluate how efficiently a portfolio generates returns relative to the risk taken.
Sharpe Ratio: Developed by William Sharpe (who won the Nobel Prize for his work on capital asset pricing), the Sharpe ratio measures excess return per unit of risk. It calculates the portfolio's return above the risk-free rate divided by its volatility. Higher Sharpe ratios indicate better risk-adjusted performance. A Sharpe ratio of 1.0 or higher is generally considered good, while ratios above 2.0 are exceptional.
Sortino Ratio: Similar to the Sharpe ratio, but focuses only on downside risk. While the Sharpe ratio penalizes all volatility equally, the Sortino ratio recognizes that upside volatility (large gains) isn't necessarily bad. The Sortino ratio only penalizes returns that fall below a target, making it a better measure for investors who care primarily about avoiding losses.
Treynor Ratio: Measures returns earned beyond the risk-free rate relative to systematic market risk (beta) rather than total volatility. This metric is particularly useful for well-diversified portfolios where unsystematic risk has been eliminated through diversification.
Each of these metrics provides a different lens for evaluating portfolio performance. Sophisticated portfolio managers use multiple metrics together to get a complete picture of how a portfolio balances risk and return.
Why Systematic Portfolio Optimization Matters
In an era of robo-advisors and algorithm-driven investing, the ability to apply sophisticated portfolio optimization techniques remains valuable for anyone seriously managing investment portfolios.
Systematic portfolio optimization helps in several ways:
Better investment outcomes: Optimized portfolios are more likely to meet objectives because they're constructed with explicit consideration of the risk-return tradeoff. Rather than making ad-hoc allocation decisions, you can ensure that your portfolio is based on sound quantitative principles.
Clearer decision-making: When you understand that a portfolio is optimized for specific risk tolerance and goals, it's easier to maintain discipline during market volatility. You can see where your portfolio falls on the efficient frontier and understand the trade-offs involved in any allocation changes.
Defensible strategy: Portfolio optimization provides a documented, quantitative basis for allocation decisions that goes beyond gut feeling or market timing attempts.
Scalable process: Systematic optimization processes allow for efficient portfolio management. Rather than custom-building each strategy from scratch, you can use optimization frameworks to quickly identify appropriate allocations based on specific inputs.
Professional approach: Understanding and applying sophisticated portfolio optimization techniques demonstrates serious investment knowledge and methodology.
The key is combining systematic optimization with practical judgment. MPT and other optimization models provide frameworks, but they must be adapted to real-world constraints like tax considerations, liquidity needs, and behavioral factors that no model can fully capture.
Taking Portfolio Optimization Further
Understanding the theory behind portfolio optimization is just the first step. The real value comes from implementing these concepts in practice.
In our next article, we'll show you exactly how to implement portfolio optimization in Excel, walking through the specific functions and formulas you can use to analyze portfolio risk, calculate key metrics, and visualize the efficient frontier. Read our complete Excel implementation guide.
For those managing institutional portfolios or working with more complex strategies, we also explore advanced optimization techniques beyond basic MPT. The Black-Litterman model, developed at Goldman Sachs, provides a sophisticated framework for incorporating subjective views into portfolio optimization while maintaining mathematical rigor. Explore advanced portfolio optimization models.
Portfolio optimization transforms investment management from art to science, while still leaving room for the judgment and experience that make great investment decisions. By mastering both the theory and practical implementation, you can build better portfolios and make more informed allocation decisions.
Next in Series: Portfolio Optimization in Excel: Complete Implementation Guide
Series Overview: Portfolio Optimization Series
