

Trading Journal essentials — learn why every trader needs one, what to track, how to build a professional trade log in Excel, and how MarketXLS automates data entry with =Last(), =QM_GetHistory(), and =PERatio().
Excel & Tools
Expert insights on stock market analysis, investment strategies, and Excel techniques for smarter investing.

Earnings Power Value (EPV) is a no-growth valuation method that estimates a company's intrinsic worth using normalized earnings and cost of capital — learn the complete formula, Excel implementation, and how MarketXLS automates data with =hf_revenue(), =HF_EBIT(), =Last(), and =MarketCapitalization().
Trading Journal essentials — learn why every trader needs one, what to track, how to build a professional trade log in Excel, and how MarketXLS automates data entry with =Last(), =QM_GetHistory(), and =PERatio().

Value at Risk (VaR) is the cornerstone of portfolio risk management — learn how to calculate parametric, historical simulation, and Monte Carlo VaR in Excel using MarketXLS formulas like =GetHistory() and =Last().

Stock quotes in excel, getting reliable, real-time stock data into your spreadsheets shouldn't require web scraping, manual copy-pasting, or clunky workarounds. This guide covers every method available in 2026 and shows you which one actually works for professional workflows.

Learn how to seamlessly convert option symbols between different broker formats using MarketXLS OptionSymbolConvert function. Support for Fidelity, Charles Schwab, Yahoo Finance, and more.

EBITDA Formula in Excel is essential for evaluating company profitability. Learn how to calculate EBITDA manually and with MarketXLS functions, compare it to other metrics, and build valuation models.

Zerodha Brokerage Calculator in Excel helps you compute intraday, delivery, F&O, and commodity trading costs with formulas for STT, GST, SEBI fees, and stamp duty.

Introduction Embarking on the journey of trading? A trading journal is your ideal companion! It’s a crucial tool that helps you track your performance, spot patterns, and refine your trading...

Annualized rate of return measures investment growth on a per-year basis. Learn how to calculate CAGR manually in Excel and with the MarketXLS =CAGR() function for portfolio analysis.

Introduction In today’s fast-paced financial landscape, understanding and harnessing the power of stock volatility is paramount for traders and investors alike.

Stock beta in excel measures how volatile a stock is relative to the overall market — learn to calculate it manually with formulas and instantly with MarketXLS functions.
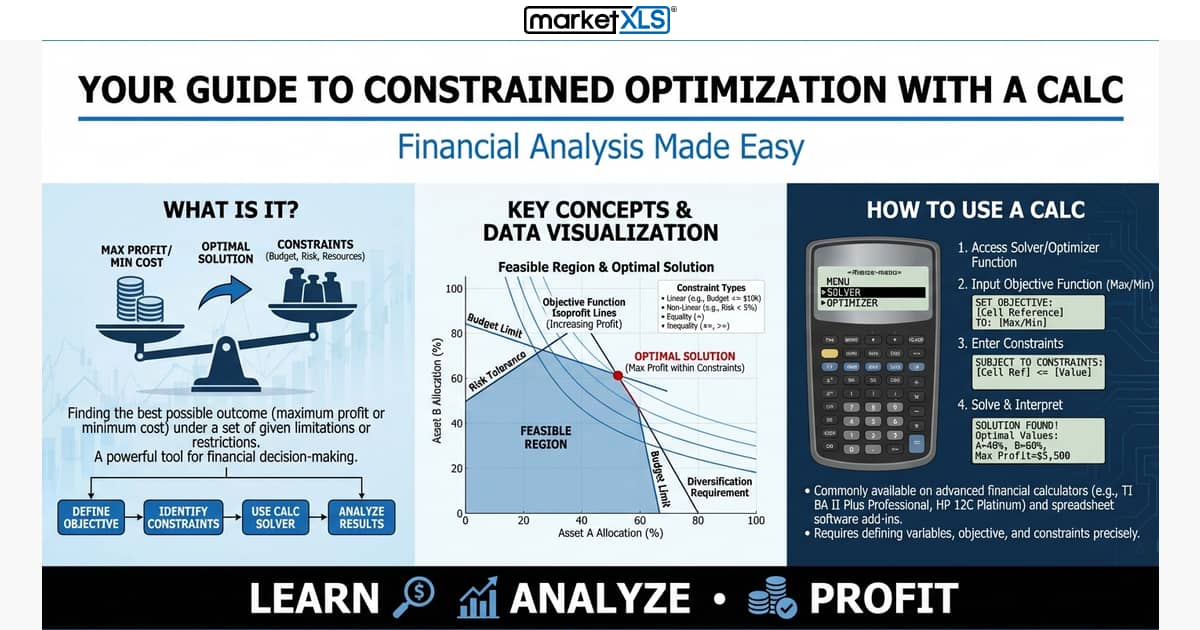
Your Guide to Constrained Optimization with a Calculator In the world of finance, nothing is more important than cost-benefit analysis and decision making.

Using a Calculator to Calculate Your Sharpe Ratio Understanding Sharpe Ratios The Sharpe Ratio is a measurement used to assess the performance of an investment compared to its risk.

Get Ready for Retirement With Scott Burns’ Retirement Calculator Retirement is one of the most important and rewarding life milestones.

How to Use a Reverse CAGR Calculator Compound Annual Growth Rate (CAGR) is a vital process of calculating the financial returns of investments and properly planning investments over a certain period...

The DuPont method is an essential analysis used to assess a company’s performance in detail. Donaldson Brown, a DuPont Corporation salesman, found the DuPont equation in 1920.
Discover how 2,500+ serious investors are saving 15+ hours every week with real-time market data directly in Excel.
✓ No credit card required • ✓ 14-day money-back guarantee • ✓ Cancel anytime