
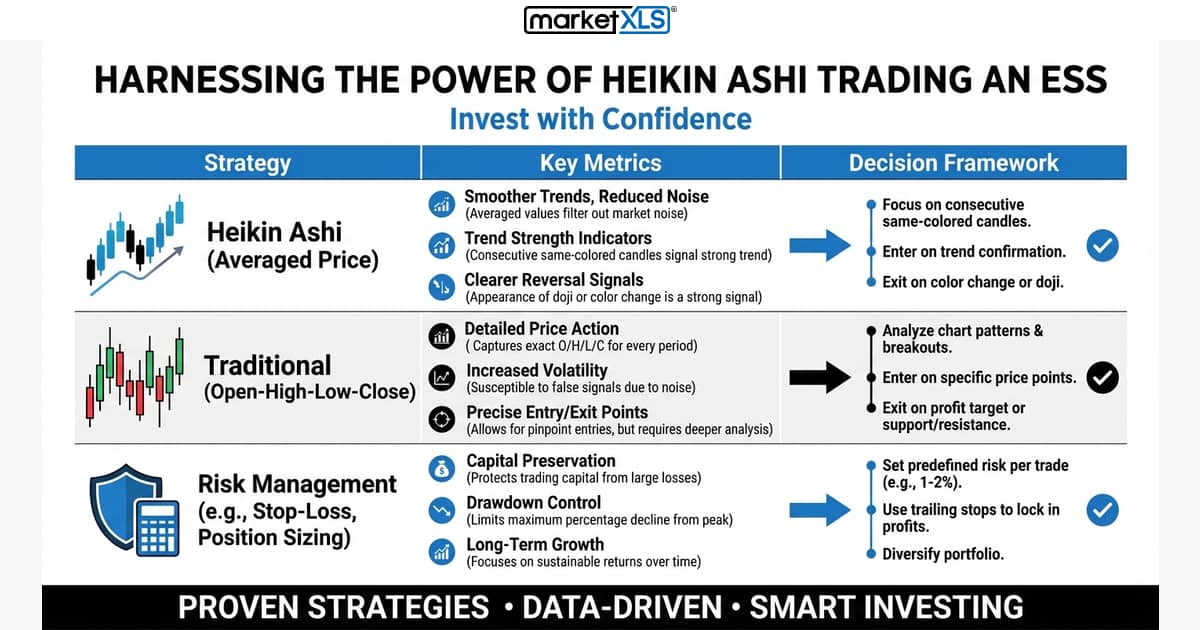
Heikin Ashi candles average price data to smooth noise and make trends easier to read. Learn the formulas and how traders use them for trend direction and reversals.
Portfolio & Investment Strategies
Heikin Ashi candles average price data to smooth noise and make trends easier to read. Learn the formulas and how traders use them for trend direction and reversals.
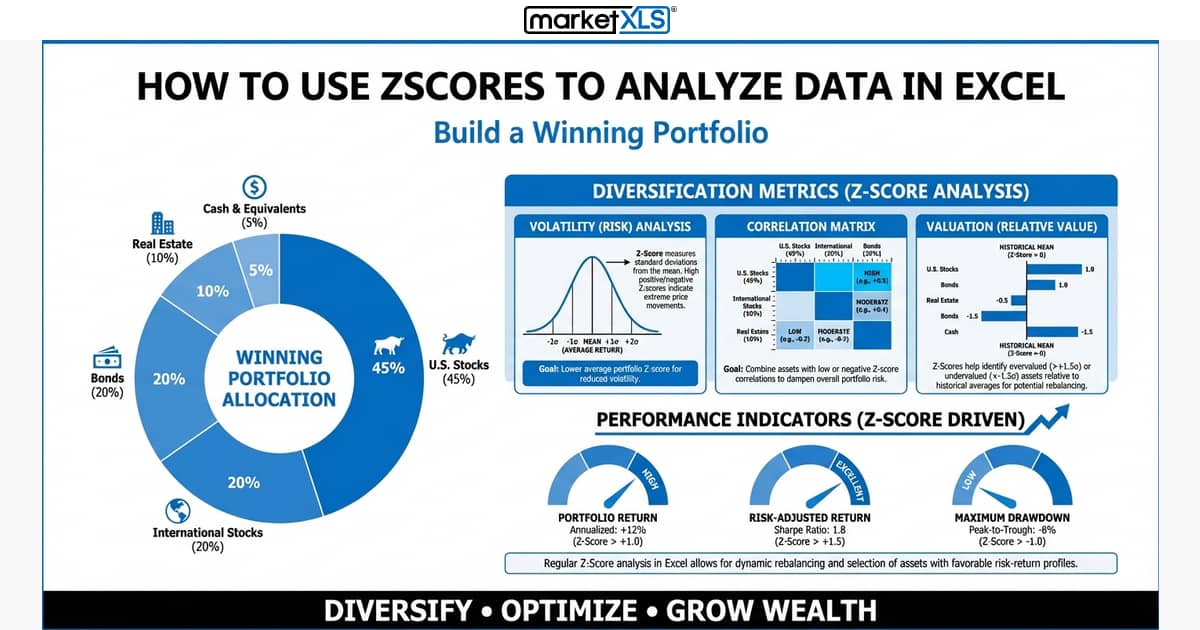
A Z score is (value minus mean) divided by standard deviation. Calculate it in Excel with STANDARDIZE, AVERAGE, and STDEV.S, and use it to spot outliers in stock data.
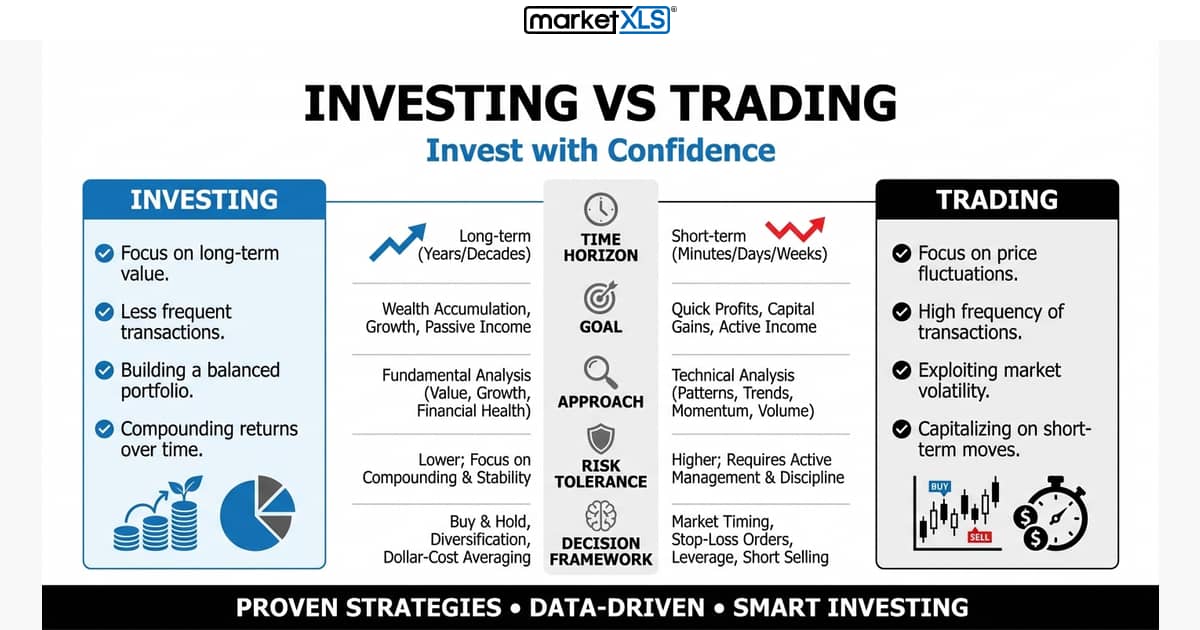
Investing vs trading: investing holds assets for years to build wealth; trading buys and sells over days or weeks to profit from price moves, with more risk.
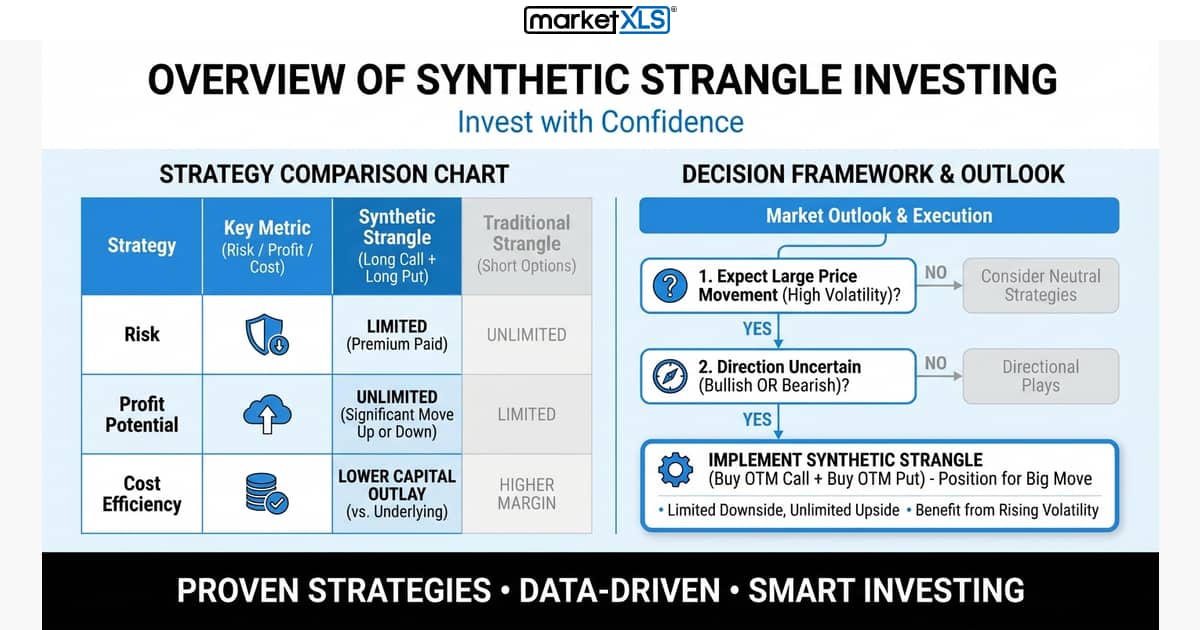
A synthetic strangle copies a long strangle using stock plus two puts. How it is built, its profit and loss, its Greeks (long vega, short theta), and the risks.
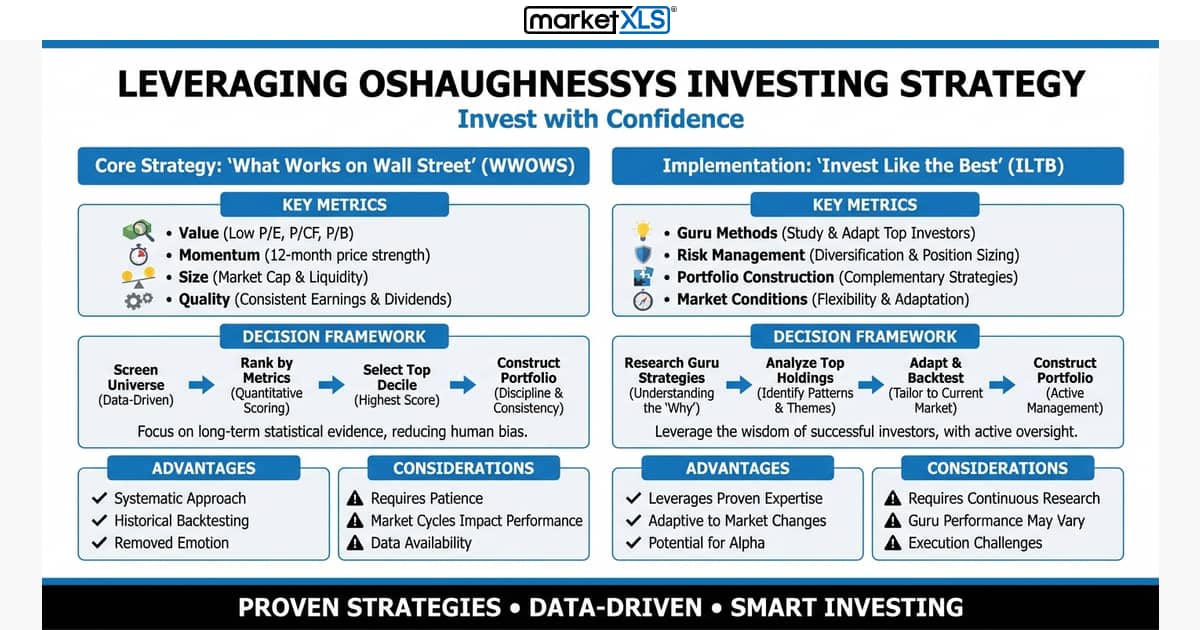
O’Shaughnessy’s investing strategy combines value, growth and momentum filters in a quantitative stock screen. How it works and how to run it in Excel.
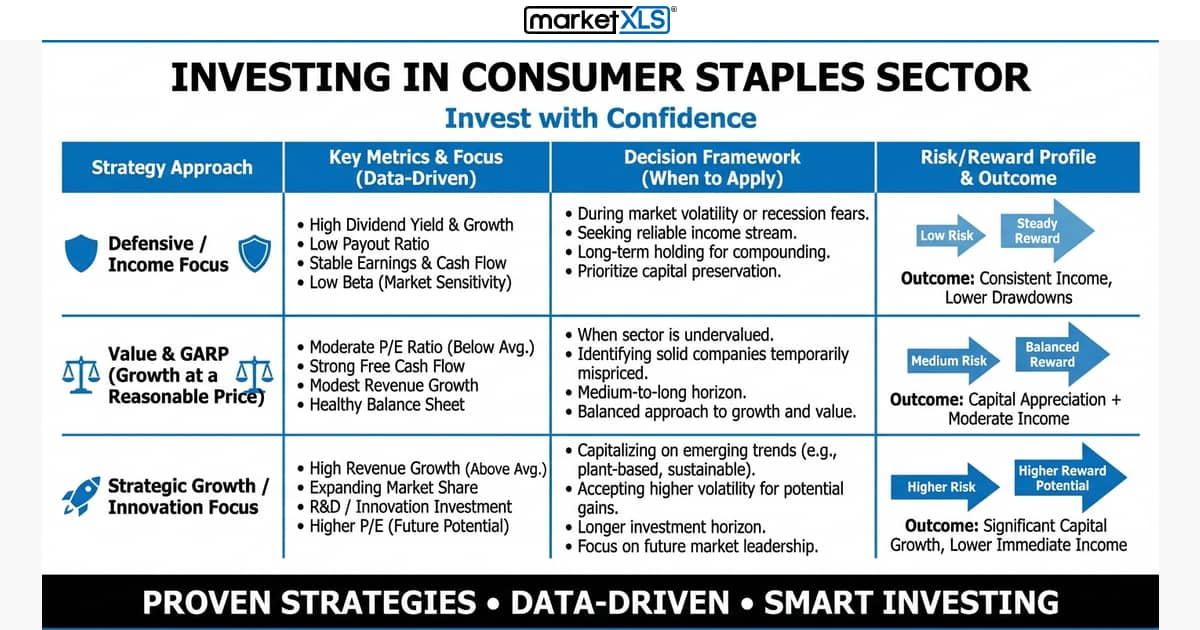
Consumer staples (food, beverages, household and personal products, tobacco) sell in any economy, which makes the sector defensive. Pros, cons, and example stocks.
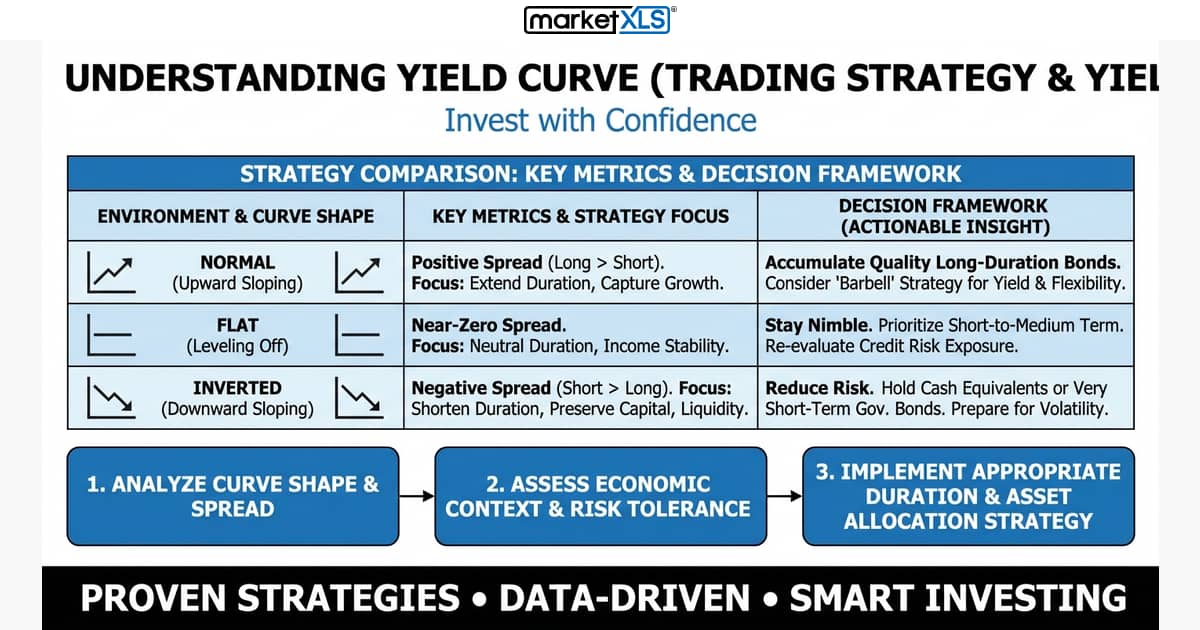
A yield curve plots bond yields against maturity. How normal, flat, and inverted curves differ, riding the yield curve, and yield curve control.
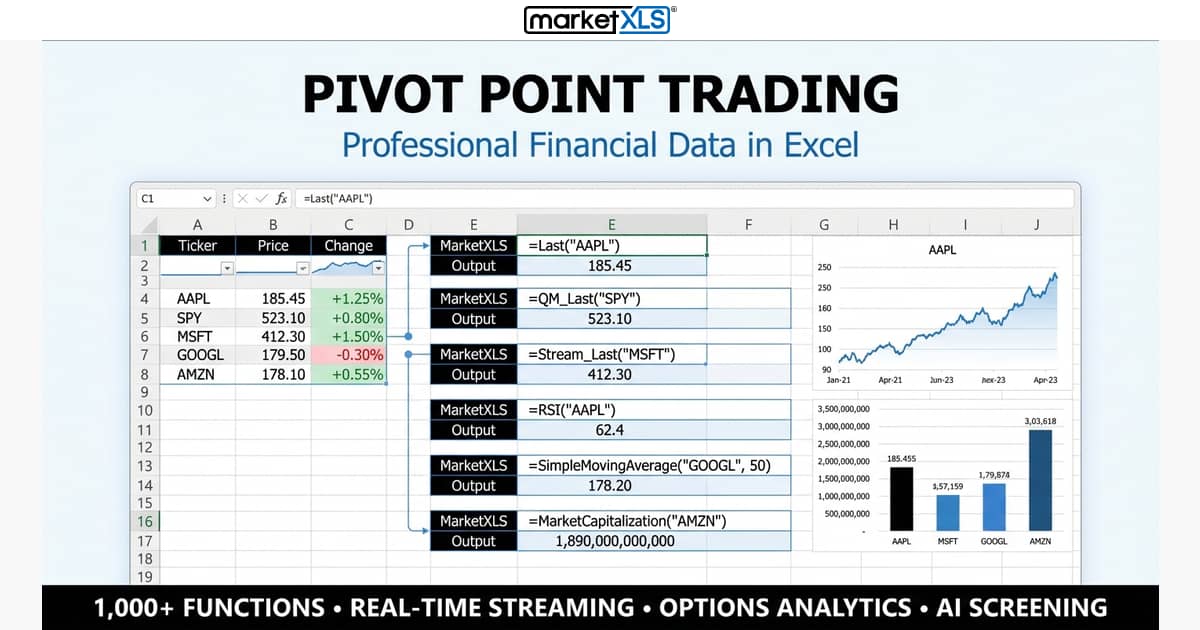
A pivot point is (prior high + low + close) / 3; support and resistance levels are derived from it. How to calculate standard, Woodie, Camarilla, and Fibonacci pivots in Excel.

Basic Materials Sector includes companies involved in mining, chemicals, forestry, and construction materials. Learn how to analyze basic materials stocks, top ETFs, and use MarketXLS to research this cyclical sector.
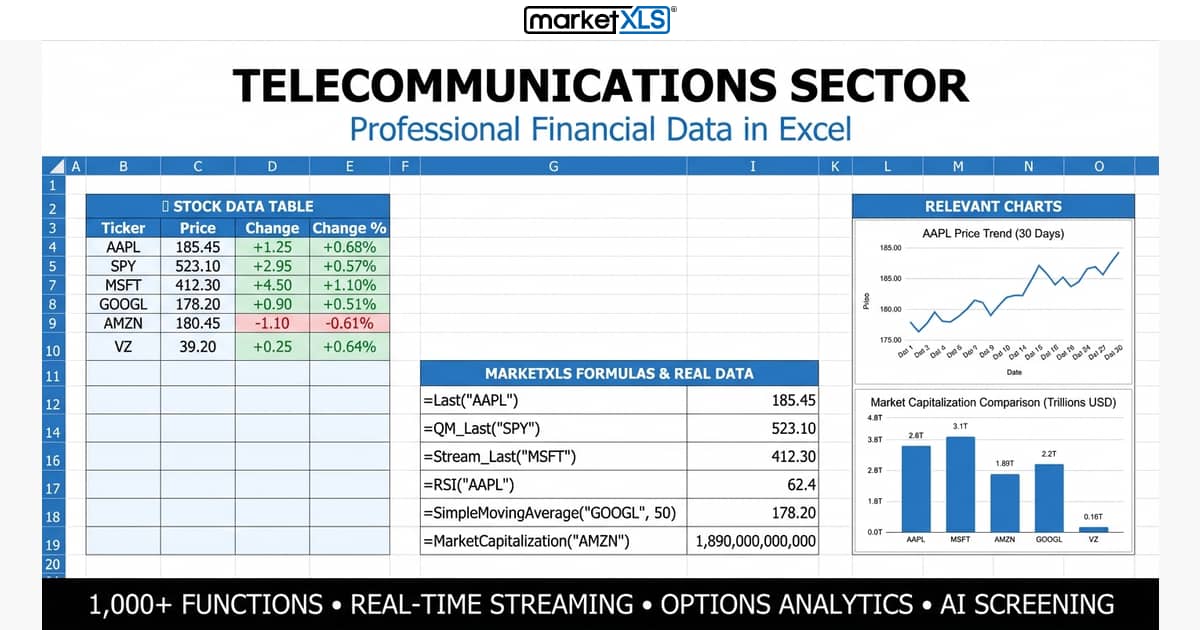
Telecommunications sector investing requires understanding key companies, 5G trends, dividends, and valuation metrics. Learn how to analyze telecom stocks in Excel with MarketXLS formulas.
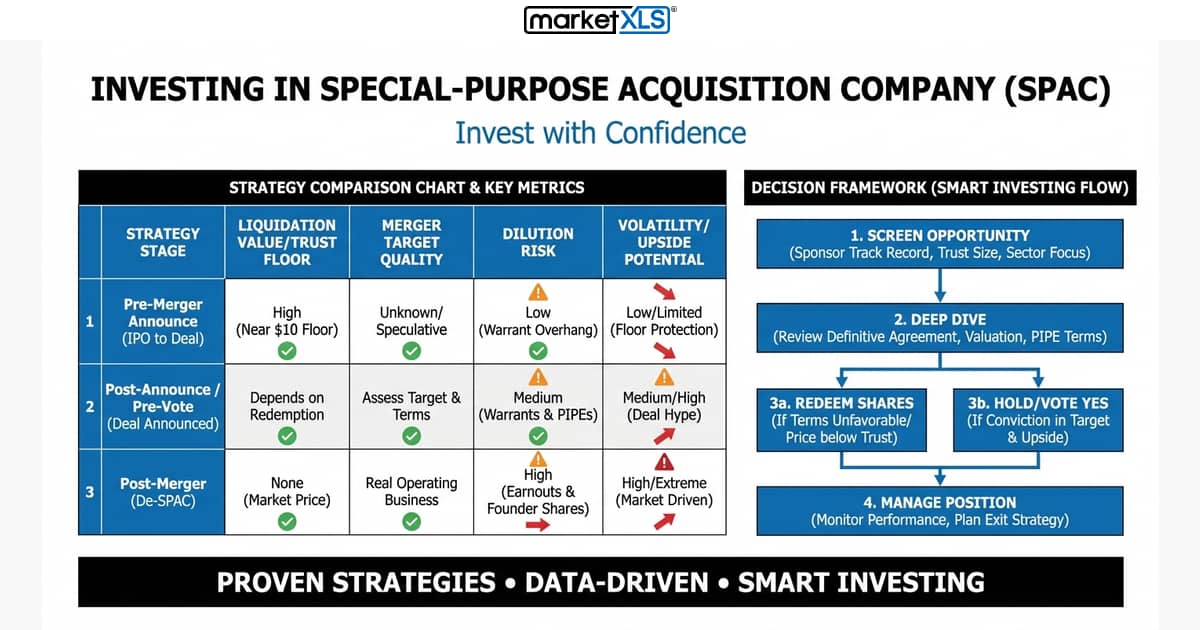
A SPAC is a shell company that raises money in an IPO, holds it in trust, and then merges with a private company. How SPACs work, their structure, and the risks.
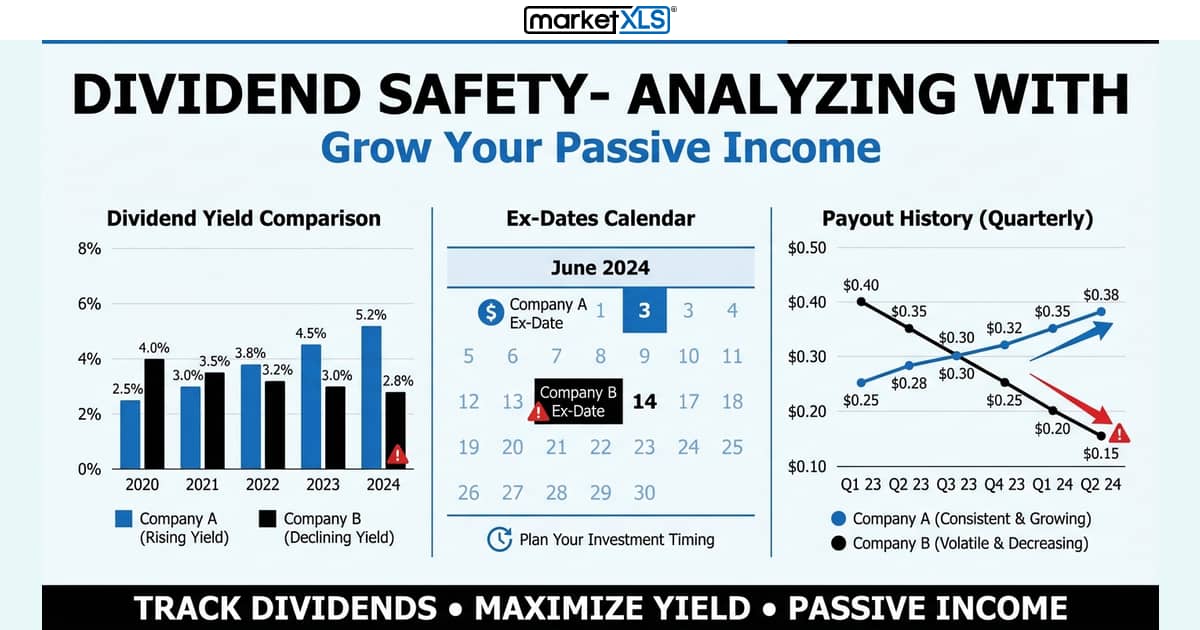
Judge dividend safety with payout ratio, free cash flow payout, dividend coverage, dividend growth history, and the Altman Z-Score, using MarketXLS in Excel.
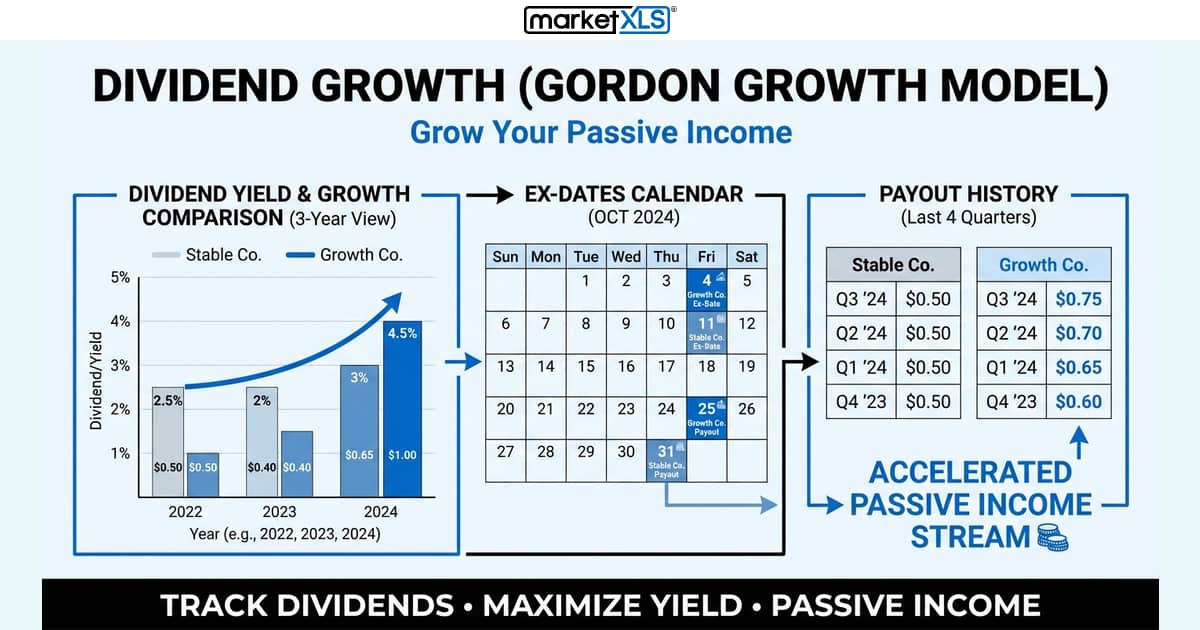
The Gordon Growth Model values a stock as next year's dividend divided by the required return minus the dividend growth rate: D1 / (k - g).
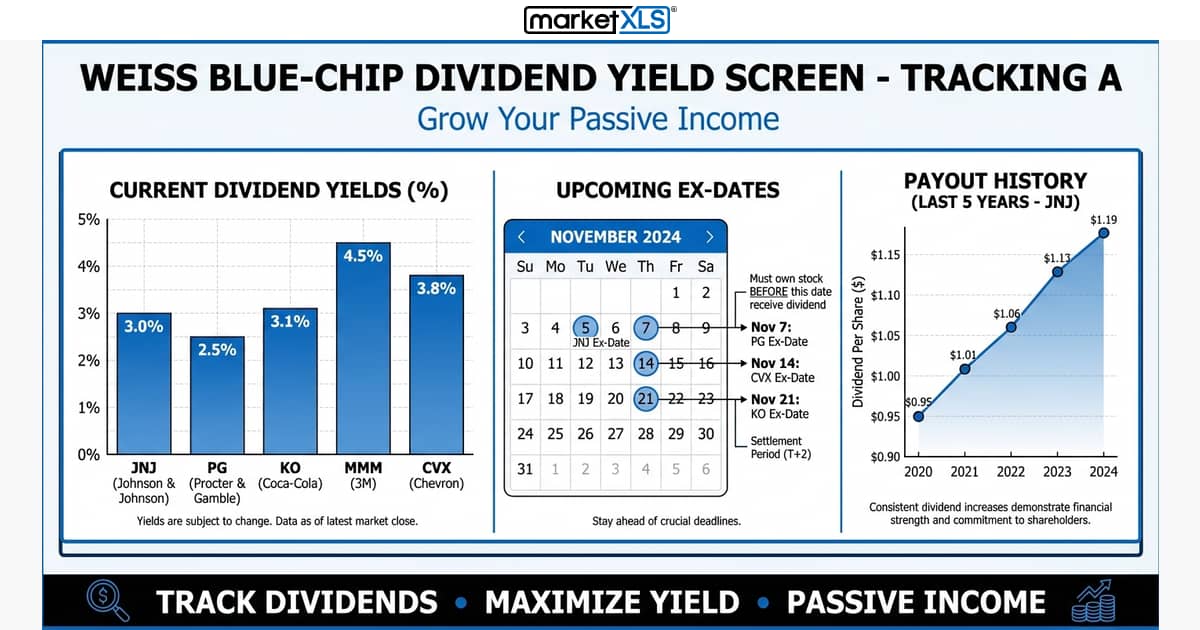
The Weiss Blue-Chip Dividend Yield Screen filters for companies with 25 years of dividends, steady EPS and dividend growth, low debt, and a payout ratio under 50%.

How to build and read a stock correlation matrix in Excel: pull prices, compute returns, use CORREL for each pair, and apply the results to diversification.
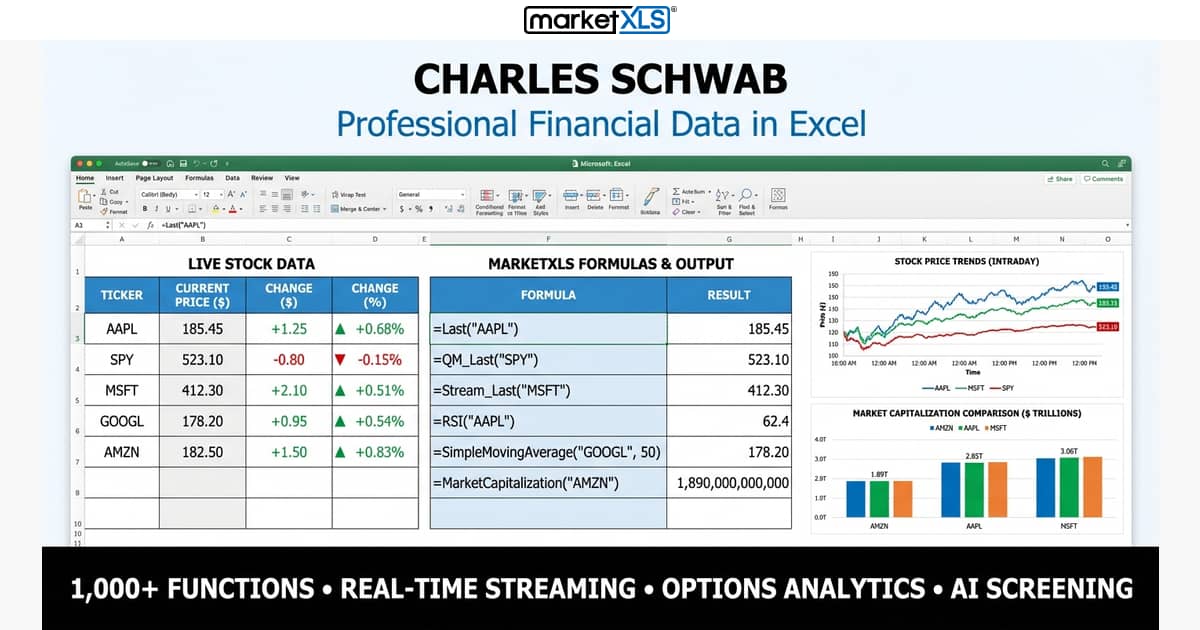
Charles Schwab users can export positions to Excel as .csv or .xls and analyze them with MarketXLS formulas. Learn how to build risk dashboards, calculate efficient frontiers, and analyze holdings beyond Schwab's built-in tools.
Browse articles by topic, arranged in reading order.
Live market data, stock screening, options analytics and portfolio management inside Excel.