
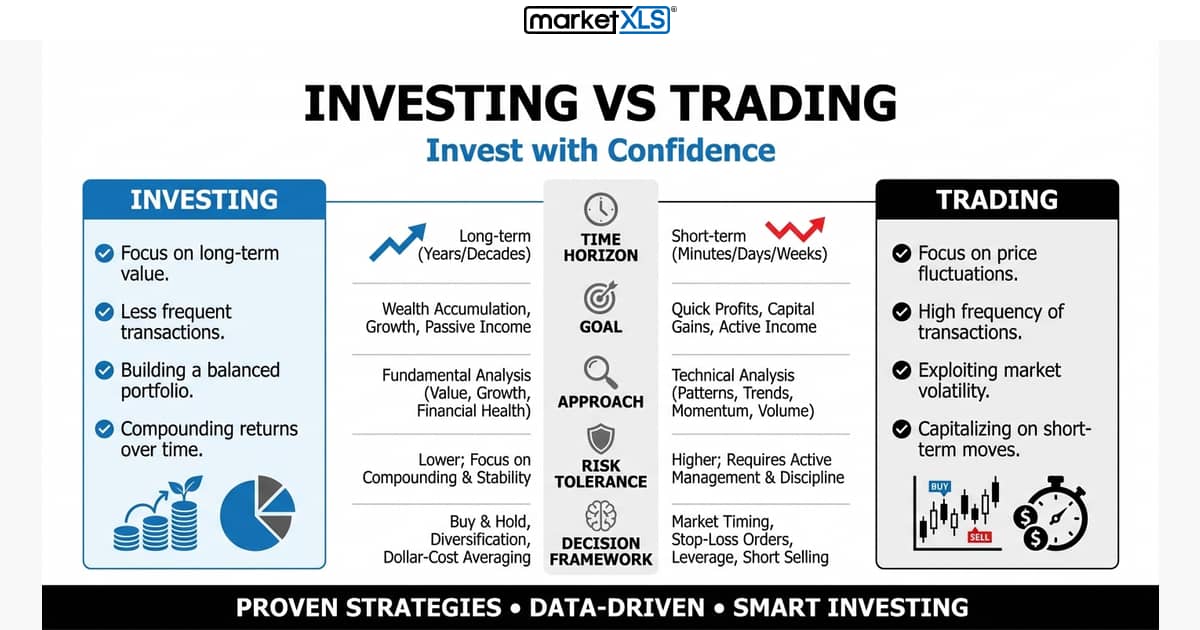
Investing vs trading: investing holds assets for years to build wealth; trading buys and sells over days or weeks to profit from price moves, with more risk.
Portfolio & Investment Strategies
Investing vs trading: investing holds assets for years to build wealth; trading buys and sells over days or weeks to profit from price moves, with more risk.
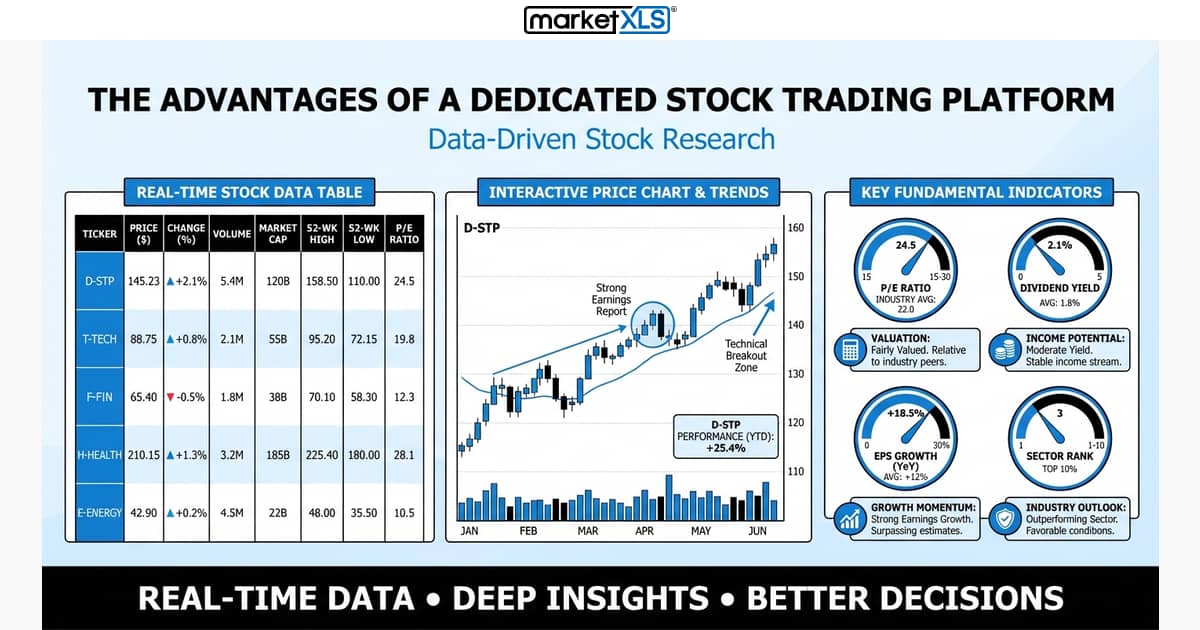
A dedicated stock trading and analysis platform replaces gut feel with data: faster research, consistent screening, and easier diversification.
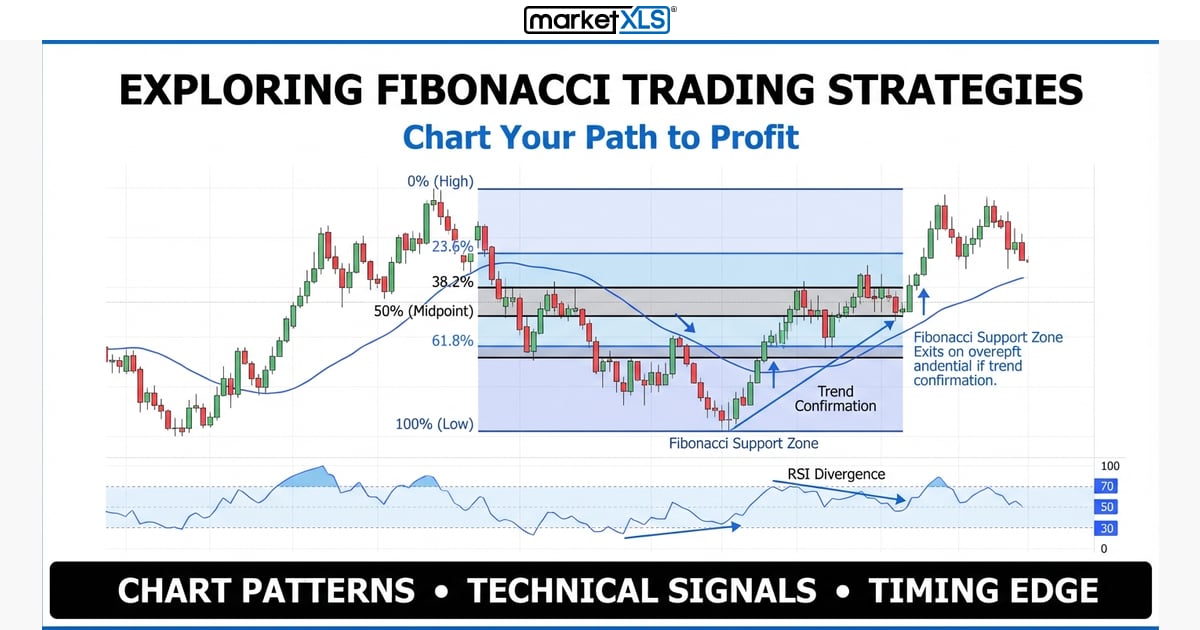
Fibonacci retracement levels (23.6%, 38.2%, 50%, 61.8%) mark where a trending price may pull back before resuming. How to calculate and use them.
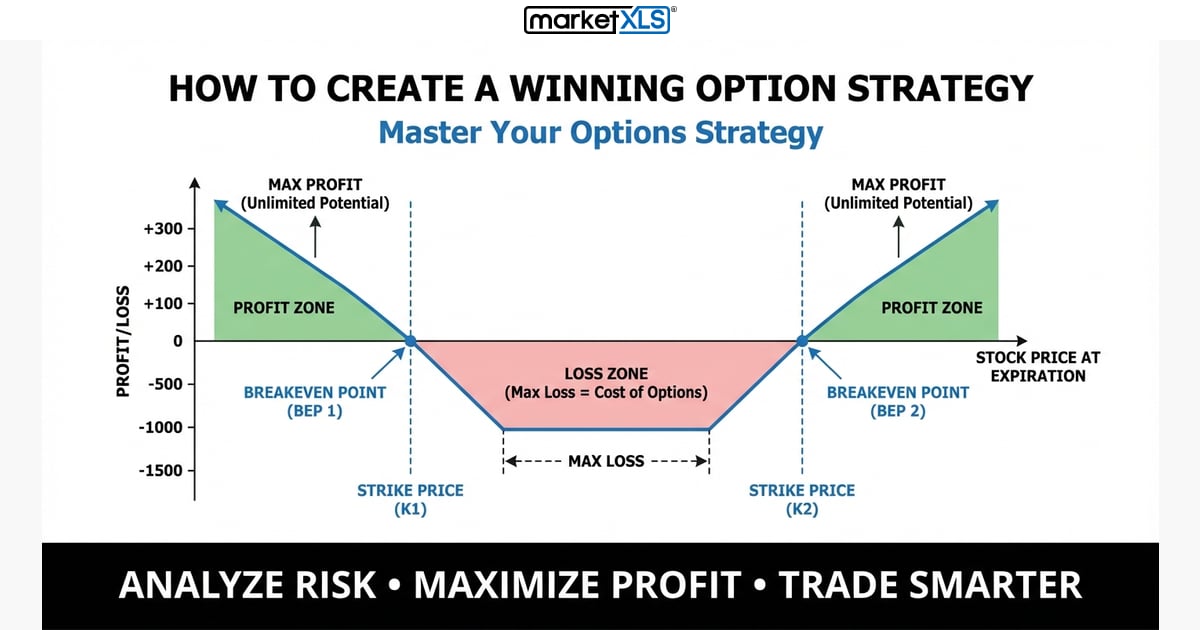
An option strategy needs four parts: the right analysis tools, a defined strategy such as a spread or straddle, diversification, and position-level risk limits.
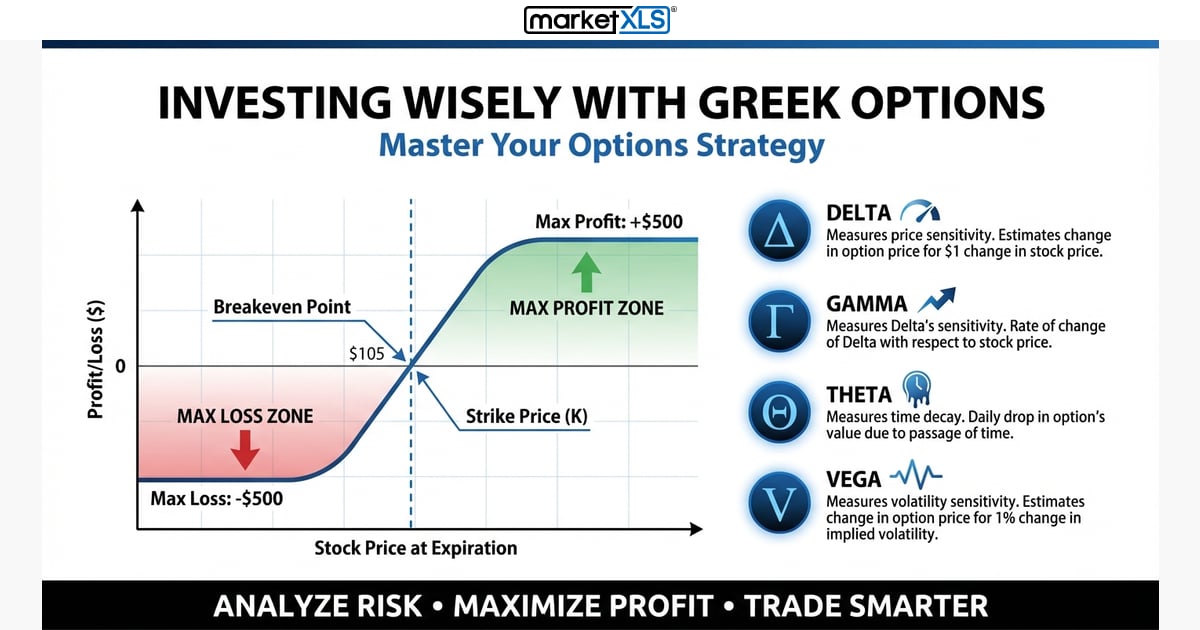
Investing Wisely With Greek Options Greeks in option trading are popularly known as parameters that define the behavior of options or derivatives. Knowing about these parameters is essential for making wise decisions regarding investments. In this article, we will discuss the importance of Options Greeks, different risk management techniques to get maximum returns and finally, */ -->
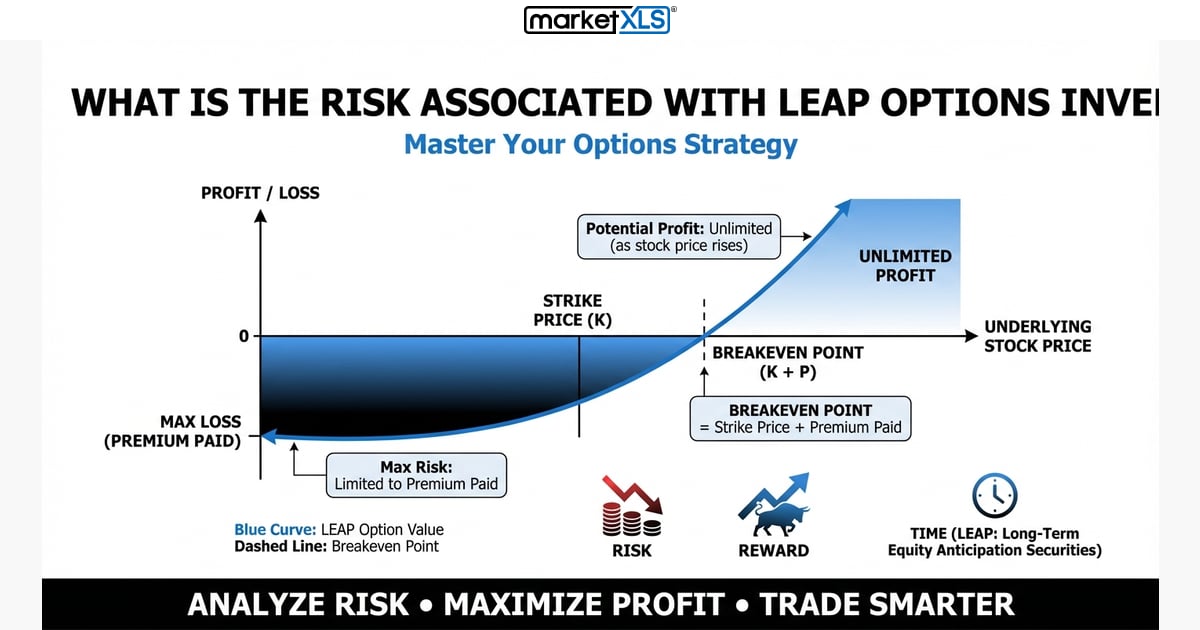
The main risk of buying LEAPS is losing the full premium if the stock does not pass the strike by expiration. Time decay, IV drops, and wide spreads add risk.
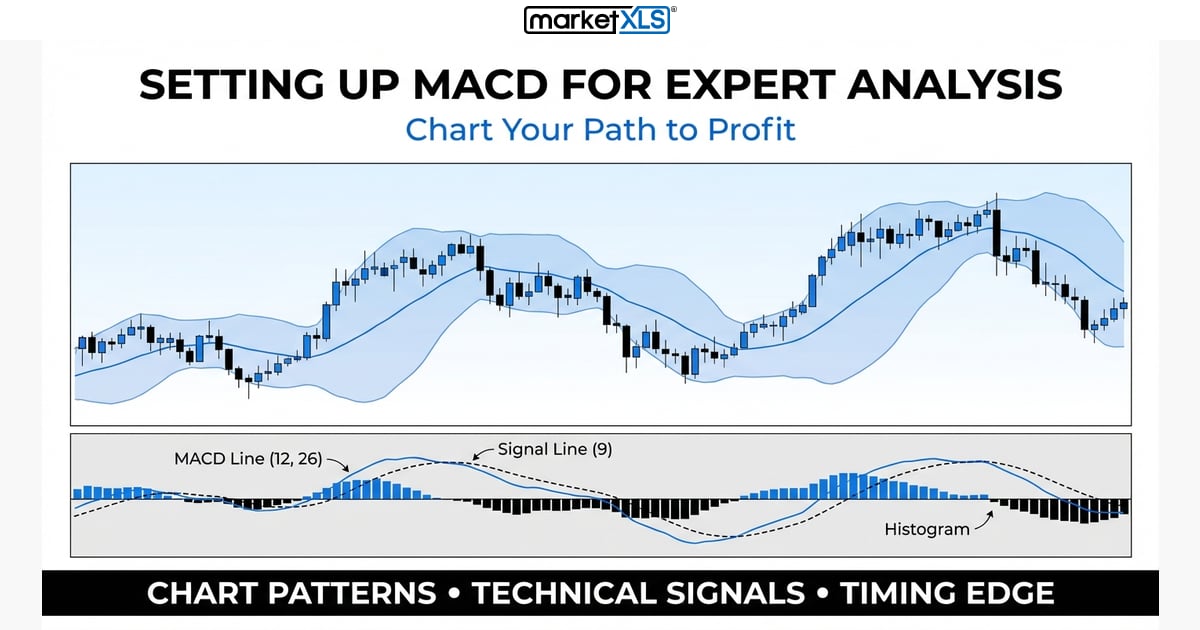
MACD is the 12-day EMA minus the 26-day EMA, with a 9-day EMA signal line. How to set it up, read crossovers and the histogram, and calculate it in Excel.
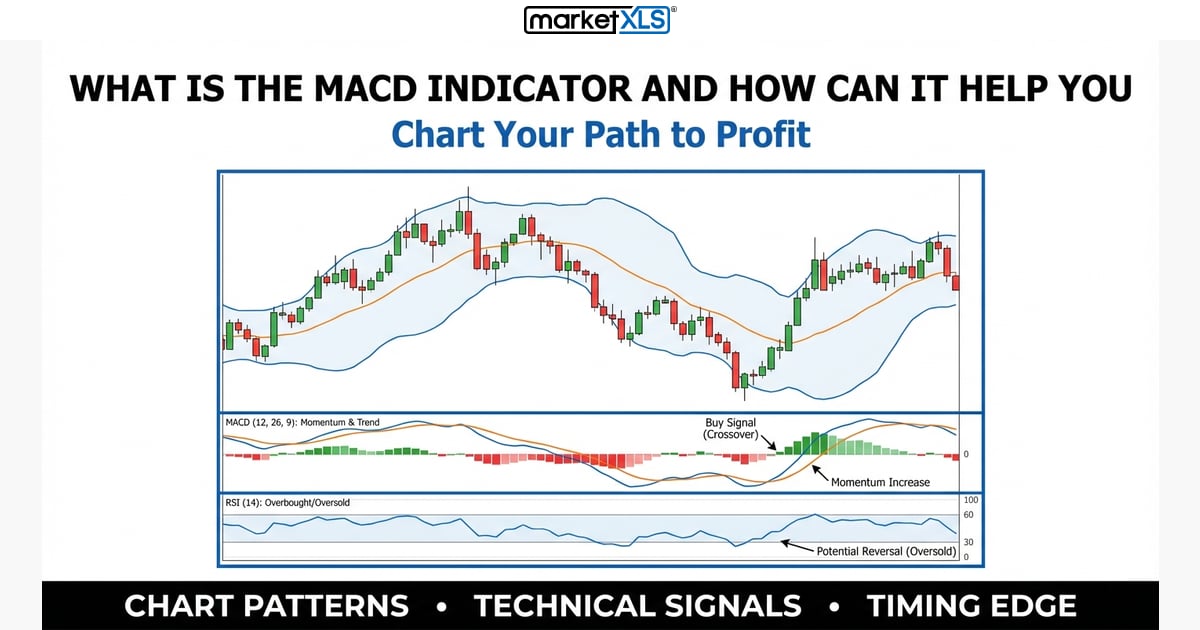
MACD is the 12-day EMA minus the 26-day EMA, with a 9-day EMA signal line. How to read crossovers, the histogram and divergence, and pull MACD into Excel.
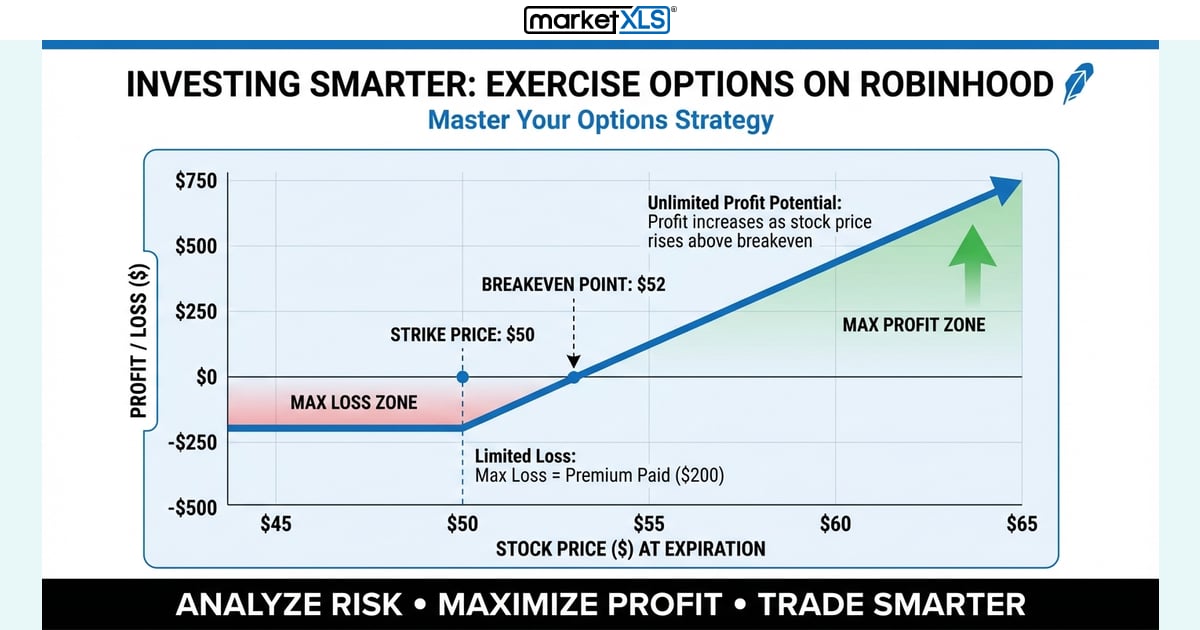
How exercising a call or put option works on a broker such as Robinhood, when selling the option is better, and how to track options in Excel.
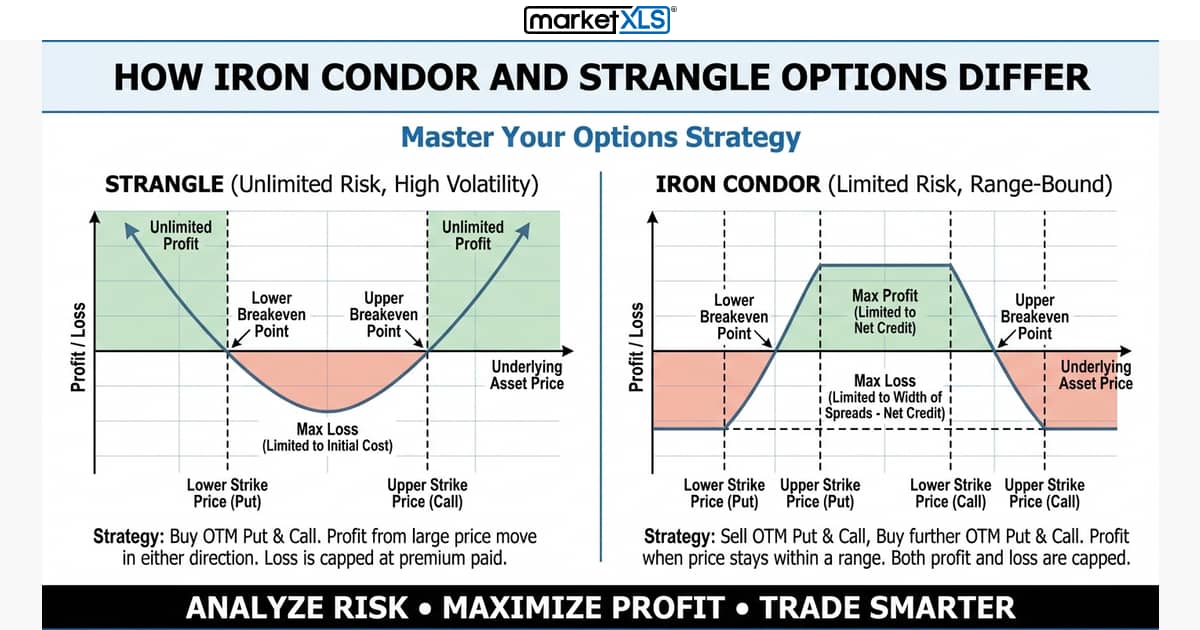
An iron condor is a four-leg, defined-risk credit trade; a strangle is a two-leg trade with undefined risk when sold. How the two differ in structure, volatility view, risk, and payoff.
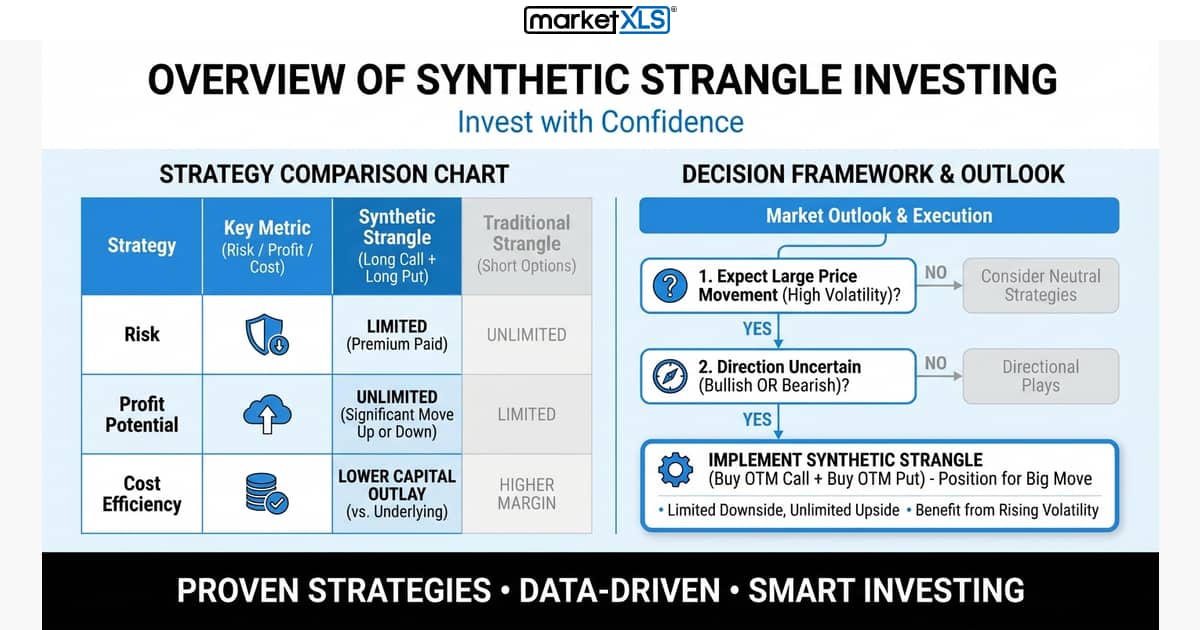
A synthetic strangle copies a long strangle using stock plus two puts. How it is built, its profit and loss, its Greeks (long vega, short theta), and the risks.
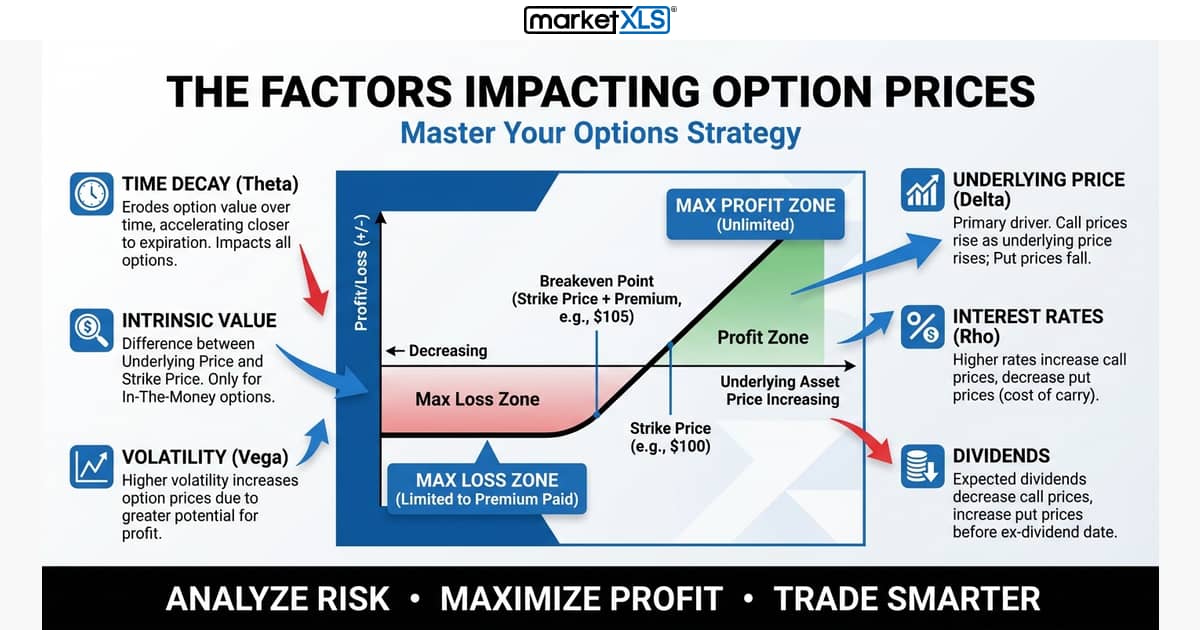
Option prices depend on the stock price, strike, time to expiration, implied volatility, interest rates, and dividends. How each one moves call and put premiums.
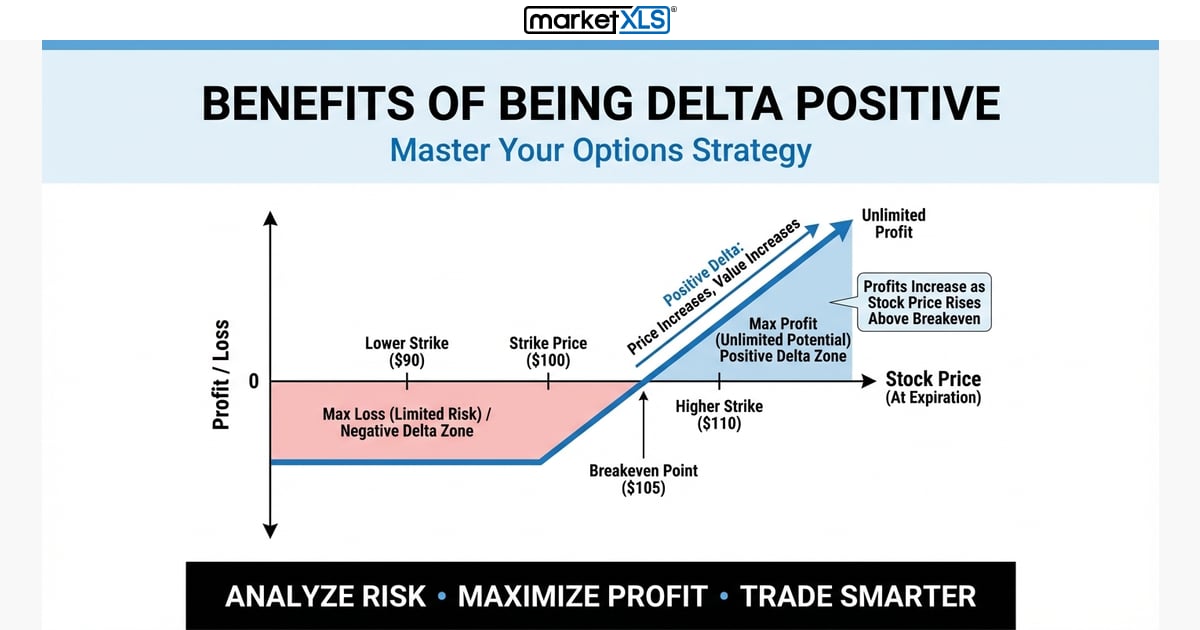
Being delta positive means an options position gains when the stock rises. Learn how position delta works and which strategies (long calls, bull spreads, covered calls) are delta positive.

The Basics of Put Call Forward Parity Put-call forward parity states that for European options with the same underlying, strike, and expiration, the call price minus the put price equals the present...
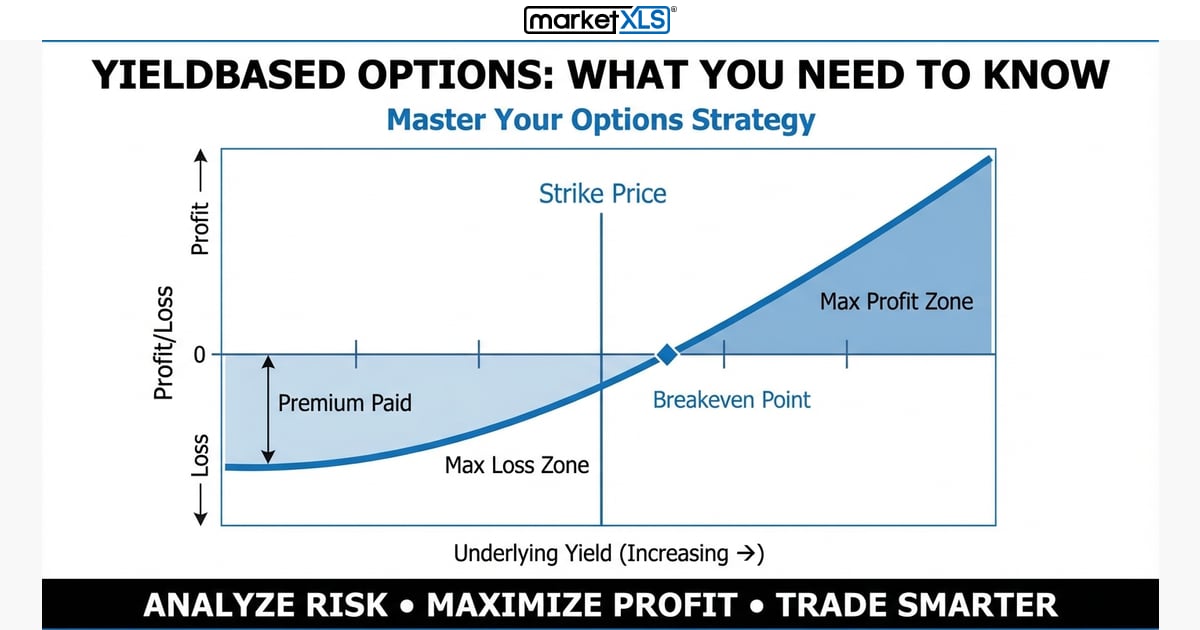
Yield enhancement with options means selling options, such as covered calls and cash-secured puts, to earn premium. How it works, what it costs, and the risks.
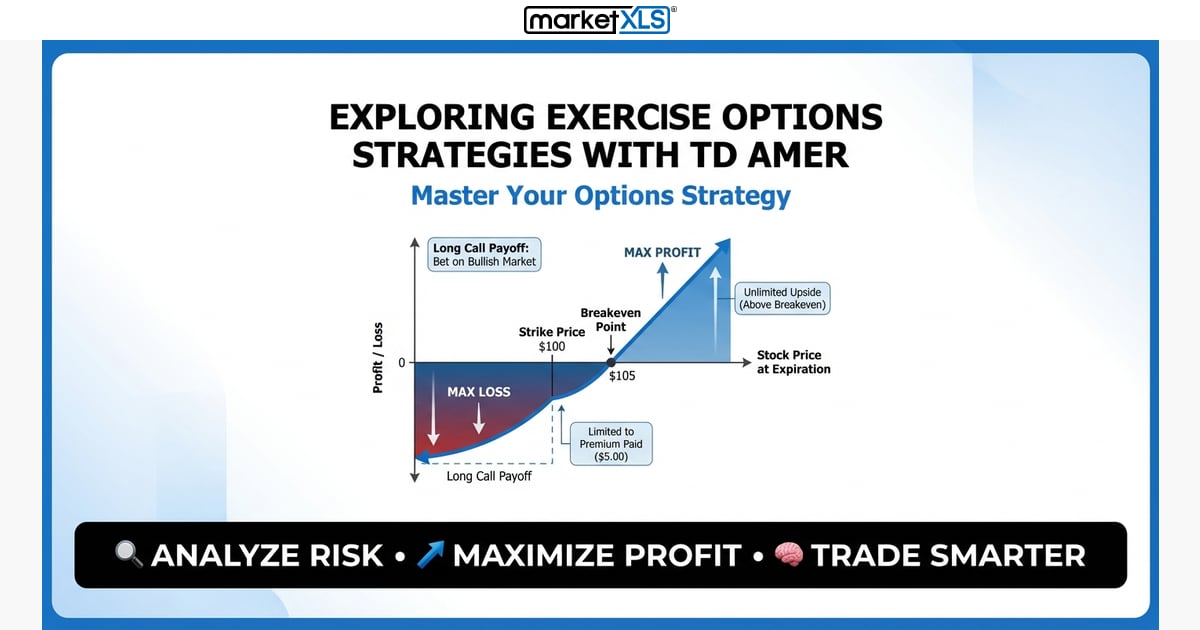
What exercising a stock option means, when early exercise makes sense, and where TD Ameritrade (now Charles Schwab) accounts handle exercise requests.
Browse articles by topic, arranged in reading order.
Live market data, stock screening, options analytics and portfolio management inside Excel.